comment
reviews
reports
deposited research
interactions
information
refereed research
Research
Bayesian analysis of gene expression levels: statistical
quantification of relative mRNA level across multiple strains or
treatments
Jeffrey P Townsend* and Daniel L Hartl
Address: Department of Organismic and Evolutionary Biology, Harvard University, 26 Oxford Street, Cambridge, MA 02138, USA. *Current address: Miller Institute for Basic Research in Science, University of California Berkeley, 2536 Channing Way, Berkeley, CA 94720-5190, USA.
Correspondence: Jeffrey P Townsend. E-mail: [email protected]
Abstract
Background: Methods of microarray analysis that suit experimentalists using the technology are vital. Many methodologies discard the quantitative results inherent in cDNA microarray comparisons or cannot be flexibly applied to multifactorial experimental design. Here we present a flexible, quantitative Bayesian framework. This framework can be used to analyze normalized microarray data acquired by any replicated experimental design in which any number of treatments, genotypes, or developmental states are studied using a continuous chain of comparisons.
Results: We apply this method to Saccharomyces cerevisiae microarray datasets on the transcriptional response to ethanol shock, to SNF2and SWI1deletion in rich and minimal media, and to wild-type and zap1expression in media with high, medium, and low levels of zinc. The method is highly robust to missing data, and yields estimates of the magnitude of expression differences and experimental error variances on a per-gene basis. It reveals genes of interest that are differentially expressed at below the twofold level, genes with high ‘fold-change’ that are not statistically significantly different, and genes differentially regulated in quantitatively unanticipated ways.
Conclusions: Anyone with replicated normalized cDNA microarray ratio datasets can use the freely available MacOS and Windows software, which yields increased biological insight by taking advantage of replication to discern important changes in expression level both above and below a twofold threshold. Not only does the method have utility at the moment, but also, within the Bayesian framework, there will be considerable opportunity for future development.
Published: 20 November 2002
GenomeBiology2002, 3(12):research0071.1–0071.16
The electronic version of this article is the complete one and can be found online at http://genomebiology.com/2002/3/12/research/0071 © 2002 Townsend and Hartl, licensee BioMed Central Ltd (Print ISSN 1465-6906; Online ISSN 1465-6914)
Received: 23 May 2002 Revised: 5 September 2002 Accepted: 3 October 2002
Background
Methods for analysis of cDNA microarray data include those that cluster hierarchically [1] by principles of self-organiza-tion [2] or by k-means [3]. These methods yield enormous amounts of information about similarities of cell state and coordination of gene regulation, and are useful for grouping
which observed fold-measures were considered to be reflec-tive of actual fold-change. Other approaches use likelihood-based methods [5,6] to obtain P-values for gene expression differences in replicated comparisons. These methods make the assumptions and have the power of model-based statis-tics, but as yet are not formulated to handle more than two genotypes, environments, or developmental states within a single, cohesive framework.
One method for analyzing experiments that involve numer-ous treatments is the use of analysis of variance on microar-ray data. Methods have been developed that can yield a profusion of information about the sources of experimental variation [7,8] or, at a biological level, about the proportion of variation in expression profile attributable to biological factors such as sex or genotype [9]. These methods can esti-mate the magnitude of effects as well as significance, but also impose considerable constraints on experimental design [10], and they are not robust to missing or excluded data.
Volcano plots [8] have highlighted well the important dis-tinction between biological and statistical significance. There are effects that may be biologically important that may not be statistically significant, and vice versa. Because many microarray experiments can have a complex and unbalanced design, owing to the technical failure of certain hybridiza-tions and the iterative nature of the work itself, we have developed an approach for assessing statistical significance that could potentially use all the available observations in any transitively connected design. Our goal is to identify effects of biologically significant magnitude to statistically significant precision.
To that end, we introduce a Bayesian analysis of gene expression level (BAGEL) model for statistical inference of gene expression and demonstrate its utility by re-examining cDNA microarray data on the response of yeast to ethanol
shock [11], on transcriptional regulation by SNF2 and SWI1
[12], and on zinc regulation [13].
Results and discussion
Our model estimates gene-expression levels, i,and error
variances, i for each gene by Markov chain Monte Carlo
integration of the likelihood function of observed gene-expression ratios, and incorporates a prior distribution for
the parameters. With an uninformative prior, statistical
analysis within this model is possible as long as there are as many comparisons as there are parameters to be estimated. Unfortunately, many cDNA microarray studies have been carried out with minimal replication, and most use a refer-ence-sample design (for example [4,14-16]) that yields weak statistical information ([7,8]; see also below).
Figure 1 diagrams the experimental design of three recent cDNA microarray studies [11-13] that have incorporated
some replication. Each expression node is diagrammed as a circle, with genotype and environmental state inscribed. For
some studies (Figure 1a), n= 2: expression during normal
[image:2.609.313.555.83.507.2]log growth, and expression after 30 minutes of ethanol Figure 1
Experimental designs for three studies analyzed using the BAGEL framework. Each circle represents an expression ‘node’, typically characterized by a particular genotype, environment and developmental state. Here, each circle is inscribed with a genotype and environment. Arrows represent individual two-color cDNA microarray experiments, with the arrowhead pointing toward the sample labeled with the Cy3 fluorophore. (a)A comparison of global gene expression of wild-type (WT) yeast in rich medium at log-growth to that of yeast at log-growth after 30 min exposure to 7% v/v ethanol [11]. (b)A comparison of swi1 and snf2mutants to wild type in rich and minimal media [12]. (c)A comparison of wild-type yeast and zap1mutants in synthetic complete medium with three different concentrations of zinc [13], in a long, unbroken, replicated chain of comparisons. Circles surrounded by a double line highlight the samples that turned out to be most important to their study.
WT
rich
ethanol
WT
rich
WT
rich
swi1
∆
rich
swi2
∆
rich
swi2
∆
minimal
WT
minimal
WT
10
µ
M Zn
WT
<100 nM
Zn
WT
3 mM Zn
zap1
10
µ
M Zn
zap1
<100 nM
Zn
zap1
3 mM Zn
swi1
∆
minimal
(a)
(b)
comment
reviews
reports
deposited research
interactions
information
refereed research
shock. For others, nis larger. For instance, the examination
of snf2, swi1, and wild-type genotypes in rich and
minimal medium, yields an n= 3 in each of two conditions,
and the study of zap1and wild-type strains in high, medium,
and low zinc yields n = 6. These studies, in an exemplary
fashion [17], have incorporated replication into their experi-mental design. As the experiments were not originally designed for analysis by this method, analysis of these datasets demonstrates some of the flexibility and utility of the BAGEL statistical framework. Furthermore, data from experiments following any of the replicated experimental designs described in Yang and Speed [18] may be directly and easily imported and analyzed by the BAGEL software.
Ethanol shock
Alexandre et al. [11] examined the effect of 30 minutes of
ethanol shock on a culture of yeast exposed during log-phase growth, by comparing the global gene expression of the ethanol-exposed cells to the global gene expression of cells in the mid-log phase of growth (Figure 1a). If we arbitrarily assign the node with the lower estimated expression to a level of unity and assume an equal error variance in both treatment and control, there are only two parameters to estimate: the mean
expression level of the higher-expressed node, and their
common error variance 2. Figure 2a shows contour plots of
the likelihood functions
kf(zk) (see Materials and methods) for
[image:3.609.53.557.269.596.2]genes for three yeast transcriptional regulators (MSN4, HSF1
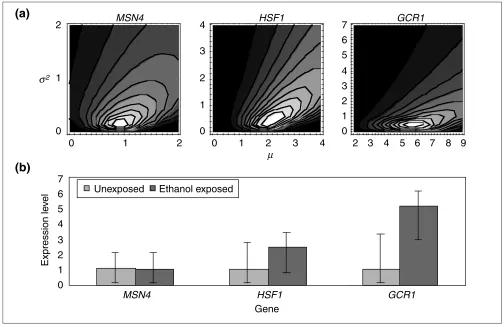
Figure 2
Estimates of gene expression levels for three yeast transcription factors after 30 minutes of exposure to 7% vol/vol ethanol during peak growth phase. (a)Likelihood contour plots for the relative gene-expression level () and experimental error variance (2). For each gene, surfaces have a single peak.
(b)Credible intervals for gene-expression level for three yeast transcription factors that are candidates for the ethanol shock response, taken from cultures at log-phase growth either unexposed or exposed to 30 min of 7% v/v ethanol. Because the slope of the likelihood is much steeper to the right than to the left of this ridge represented in (a), credible intervals with two-sample data such as this are highly asymmetric. More balanced experimental designs have more symmetric credible intervals. Using a conservative gene-by-gene criterion of nonoverlapping 95% credible intervals, none of these transcription factors shows statistically significantly differential gene expression, although GCR1is close. MSN4is the gene for a zinc-finger transcriptional activator for genes regulated through Snf1p. A general regulator for stress response, it does not seem to be responsible for upregulation of stress genes in response to ethanol. HSF1is the gene for a heat-shock transcription factor that binds to the heat-shock DNA element at both normal and elevated temperatures. Although the difference in estimates observed here is suggestive of regulatory action of the heat-shock response, these differences are not statistically significant. GCR1encodes a positive regulator of glycolytic genes, including GLK1. Although the difference in estimates observed here is suggestive of regulatory action on transcription of transposable elements and the trehalose pathway, the differences are not statistically significant by a conservative criterion of nonoverlapping 95% credible intervals.
0
1
2
2
3
4
5
6
7
8
9
0
1
2
3
4
5
6
7
GCR1
0
1
2
3
4
0
1
2
3
4
HSF1
0
1
2
MSN4
σ2
µ
0
1
2
3
4
5
6
7
MSN4
HSF1
GCR1
Gene
Unexposed
Ethanol exposed
Expression le
v
el
(a)
and GCR1) that could potentially be responsible for observed downstream changes discussed later in this text. These three genes demonstrate typical two-dimensional likelihood sur-faces in which the most likely expression levels are equiva-lent, different, and very different, respectively. Msn4p is a zinc-finger transcriptional activator for many genes
regu-lated by Snf1p. When MSN4has a null allele, stress-response
genes including HSP12, HSP26, HSP42, HSP78and HSP104
are upregulated [19]. Hsf1p is a heat-shock transcription factor that binds to the heat-shock DNA element at both normal and raised temperatures. Abundant transcripts from
MSN4 and HSF1 could have a role in the upregulation of
heat shock genes after ethanol shock (see below). Abundant
transcripts of MSN4and GCR1 could have a role in the
con-comitant upregulation of the trehalose pathway (see below).
The observed MSN4ratios in two replicate microarrays were
inconsistent (0.6- and 2-fold). This, in fact, gives very weak support to the hypothesis that the nodes are expressed at nearly the same level. This is in part because, conditional on higher error variances, larger differences in expression become increasingly likely. This effect is seen more
dramati-cally in the contour plot for HSF1, for which the highly
dis-persed, somewhat inconsistent ratios of 0.9-fold, 3-fold and 5-fold were observed. Consistent data, even when relatively
dispersed (ratios 3-fold, 5-fold and 10-fold), as for GCR1,
shows this effect but with a greater slope in the likelihood
surface. Although Figure 2a depicts two-dimensional sur-faces from an ordinary treatment-reference experimental design with a common variance term, it shows typical simple topologies of the likelihood surface. Increasing the amount of data in larger datasets accelerates reliable convergence upon the stationary distribution of the Markov chain, which is required for inference of the posterior distributions of the parameters of interest. Furthermore, in larger datasets, these posterior unconditional distributions of the parame-ters are unimodal. By inference, the multidimensional likeli-hood surfaces are expected to be fairly simple.
These likelihood plots clearly convey the most probable expression levels. To determine statistical significance, we examine the posterior distributions of the parameters, as determined by Markov chain Monte Carlo simulation. In fact, the credible intervals for the expression level for all three of these genes overlap (Figure 2b). There is not enough information in the replicated comparisons of each gene’s ratio of expression to constrain the variance parameter to a small enough value so that expression levels could be inferred to lie within a small range.
[image:4.609.54.557.87.343.2]In contrast to the lack of statistical significance of the expres-sion differences observed in these three upstream transcription factors, many of the downstream conclusions of the original study are not only consistent with BAGEL estimates, but are Figure 3
Stress-induced chaperonins are abundant in log-phase yeast culture shocked by 30 min exposure to 7% ethanol. (a)BAGEL estimates and confidence intervals for seven heat-shock genes. The first four were mentioned by [11], and are significantly abundantly expressed after ethanol shock. HSP30and HSP42are also significantly abundant, whereas HSP82is not. (b)Except for SSA4, these genes of the HSP70family are not statistically significantly differentially expressed after ethanol shock. Note, however, that estimates for their expression level are consistently higher.
HSP104 HSP12 HSP26 HSP30 HSP42 HSP78 HSP82
SSA1
SSA2
SSA3
SSA4
SSE1
Expression le
v
el
Expression le
v
el
Gene
Gene
Normal
Ethanol
Normal
Ethanol
0
2
4
6
8
10
12
14
16
18
20
0
2
4
6
8
10
12
14
16
statistically significant by the conservative gene-by-gene crite-rion of nonoverlapping 95% credible intervals. For instance, the authors concluded that the stress-induced chaperonins (‘heat-shock’ genes) were upregulated by 30 minutes of expo-sure to 7% v/v ethanol [11]. Many of these genes are clearly sig-nificantly abundant in the stressed state (Figure 3a), although there is not enough data to conclude that all of the set of
HSP70-family genes is significantly abundant in the stressed state (Figure 3b). On the basis of the large estimated expression differences (nearly always twofold or greater), an effect on the
HSP70family may yet be large and biologically important.
[image:5.609.101.548.83.444.2]In addition, the trehalose pathway, whose product aids the cell in dealing with excess ethanol [20], is clearly upregulated
(Figure 4). Interestingly, the six genes HXK2, PGM1,
YHL0012w, TSL1, TPS2 and ATH1, form a completely
parallel pathway from -D-glucose to ,-trehalose to
D-glucose. Of those genes, none is significantly upregulated. Teasing apart the biochemical modes of action of these iso-forms (‘redundant’ genes) will lead to a better understand-ing of the modularity of genomes and of the varied methods of response to environmental challenges of organisms.
Alexandre et al. propose a futile trehalose cycle after
observing high ratios of expression of NTH1 in their
ethanol-shocked sample [11]. However, the wide credible intervals around the expression levels of the genes for the neutral trehalase NTH1 (Figure 4) and the acid trehalase ATH1, the observed accumulation of trehalose in fermenta-tions [21], and the potential for compartmentalization [22] indicate that more data are needed before one can infer the extent of such a cycle.
In addition to the results previously noted, it is interesting to observe significant abundant expression of numerous open
comment
reviews
reports
deposited research
interactions
information
refereed research
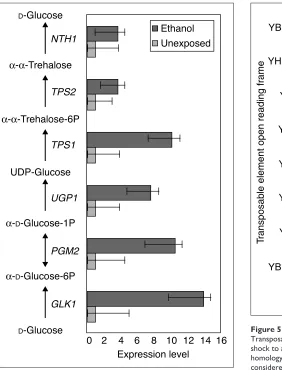
Figure 4
Trehalose pathway transcripts are significantly abundant along the pathway from D-glucose to trehalose 6-phosphate in yeast cultures exposed to 7% ethanol for 30 min at log-phase growth. Trehalose has a protective role after ethanol exposure. Although estimates of trehalase expression are consistent with an increase in transcripts responsible for degradation of trehalose (NTH1, shown; ATH1, not shown but very similar), neither gene has nonoverlapping 95% credible intervals in the two conditions.
αα
α
αα
α
[image:5.609.63.345.85.455.2] [image:5.609.309.556.85.411.2]GLK1
PGM2
UGP1
TPS1
TPS2
NTH1
Figure 5
Transposable-element transcripts are abundant after 30 min ethanol shock to a yeast culture in log-phase growth. The high sequence homology of these ORFs means that the effects charted above cannot be considered independent as observed on a cDNA microarray. The high level of general transposable-element transcript abundance, however, remains interesting.
9
T
ransposab
le element open reading fr
ame
Expression level 0 1 2 3 4 5 6 7 8
Ethanol Unexposed
reading frames (ORFs) containing transposable-element sequence under ethanol shock (Figure 5). Although robust inferences are compromised by the high sequence homology of these ORFs, the fact that six were significantly abun-dant and none was meagerly expressed suggests an inter-esting biological phenomenon. One possible effector is the
transcriptional regulator Gcr1p, whose BAGEL estimate in ethanol shock is fivefold greater than in normal log growth and whose credible intervals in the two conditions barely overlap (Figure 2). Gcr1p elevates transcription of
transpos-able elements Ty2-917 and Ty1-912 [23] as well as of GLK1of
[image:6.609.54.560.87.494.2]the trehalose pathway ([24], and Figure 4). Figure 6
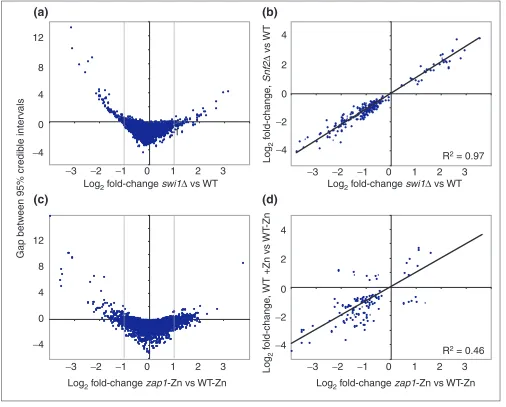
Statistical and biological significance of inferred gene expression levels in swi1, snf2, and zap1mutants compared to wild type (WT).(a)Scatterplot of the log2BAGEL estimate of fold-change in the swi1mutant compared to wild type for all genes (on the x-axis) versus the negative overlap of BAGEL credible intervals for the swi1mutant compared to wild type. Points above zero on the y-axis have nonoverlapping 95% credible intervals. Dashed lines indicate a twofold difference in estimate of gene-expression level. Points outside the region defined by these dashed lines and below zero on the y-axis have low statistical significance despite their high estimated fold-change. Points within the region defined by these dashed lines and above zero on the y-axis have high statistical significance and a low fold-change. Note that these points are very densely packed and appear close to zero on the y-axis because the difference between confidence intervals cannot exceed the difference between estimates. (b)Scatterplot of log2fold-change of gene-expression levels in the swi1mutant compared to wild type against gene-expression levels of the snf2mutant. Genes shown have nonoverlapping 95% credible intervals with wild type. The regression passes through zero without forcing. (c)Scatterplot of the log2BAGEL estimate of fold-change in the zap1mutant in zinc-deficient medium compared to wild type in zinc-deficient medium for all genes (on the x-axis) versus the negative overlap of BAGEL credible intervals for the zap1mutant compared to wild type in zinc-deficient medium. (d)Scatterplot of log2fold-change of gene-expression levels in zap1mutant compared to wild type in zinc-deficient medium versus wild type in zinc-replete medium compared to wild type in zinc-deficient medium. The regression is forced through zero; its y-intercept and slope are slightly lower when not forced. Genes shown have nonoverlapping 95% credible intervals with wild type.
Log
2fold-change swi1
∆
vs WT
Log
2fold-change swi1
∆
vs WT
Log
2fold-change zap1-Zn vs WT-Zn
Log
2fold-change zap1-Zn vs WT-Zn
Log
2
f
old-change
,
WT +Zn vs
WT
-Zn
R
2= 0.97
1
0
−
1
1
2
3
−
2
−
3
−
3
−
2
−
1
0
1
2
3
0
−
1
1
2
3
−
2
−
3
−
3
−
2
−
1
0
1
2
3
Log
2
f
old-change
,
Snf2
∆
vs
WT
Gap betw
een 95% credib
le inter
v
als
R
2= 0.46
0
8
12
4
−
4
0
8
12
4
−
4
0
2
4
−
2
−
4
0
2
4
−
2
−
4
(a)
(b)
There are many reasons why data points in microarray experiments are wisely excluded from analysis. Whole sectors occasionally fail due to premature drying during hybridization, spots are occasionally malformed, and exper-imental signal is frequently so low compared to background that a spot is best excluded from the data. Only 2,041 genes of 6,138 in these data passed the spot background-fore-ground acceptance criteria (see Materials and methods) in all three experiments. Of these genes, 65 were significantly different by a gene-by-gene criterion, demanding nonover-lapping 95% confidence intervals. A further 2,337 genes had one observation missing; their credible intervals were appropriately wider after BAGEL analysis of the data and only 22 were statistically significant. Genes with one accept-able observation were not analyzed. Use of an informative prior distribution on the variance, however, would allow such analysis.
Table 1 gives an overview of informative pairwise compar-isons from the experiments analyzed here. In the ethanol-shock experiments, only the 87 genes listed in Table 1 are statistically significantly different out of the, on-average, 1,851 genes measured as greater than twofold differentially expressed in these single microarray experiments. BAGEL analysis allows unambiguous inference as to the expression levels and confidence intervals of these genes of interest. In this dataset with only three replicates, we detect no signifi-cant differences at below a twofold level. Datasets with greater direct replication, or with less dispersed ratios, or with transitively informative comparisons (see below and J.P.T., unpublished data) promise to do so.
Deletion ofSWI1and SNF2
Sudarsanam et al. undertook a study to ascertain which
genes were controlled by the Snf2p/Swi1p chromatin-remodeling and transcriptional-activator complex subunits, whether the genes had any distinct regulatory roles, and how their regulatory roles compare in rich and minimal media ([12], and Figure 1b). In rich medium, the credible intervals among mutant and wild-type expression levels do not overlap for 251 genes (more than 4% of the genome). Impor-tantly, 46 genes with estimated ratios greater than twofold have overlapping credible intervals (Figure 6a, lower left and lower right quadrants). Moreover, almost one quarter of the 251 significantly different genes have estimated ratios less than twofold (densely packed between the dashed lines because the difference between estimates cannot exceed the distance between credible intervals, Figure 6a). In minimal medium, similar results were acquired; a greater number of significant results were obtained, due in part to greater repli-cation (Figure 1b, Table 1). The credible intervals of mutant and wild-type expression levels do not overlap for 604 genes, almost 10% of the genome. Interestingly, 14 genes with esti-mated ratios greater than twofold have overlapping credible intervals, and 361 (more than 50%) of the 604 significantly differentially expressed genes are differentially expressed below the twofold level.
Whether these genes represent all of the genes controlled by the Snf/Swi complex depends, of course, on what level of dif-ference is deemed biologically significant, which in many cases depends upon the gene of interest. For many transcrip-tion factors, it may be that small changes in expression level
comment
reviews
reports
deposited research
interactions
information
[image:7.609.55.556.117.343.2]refereed research
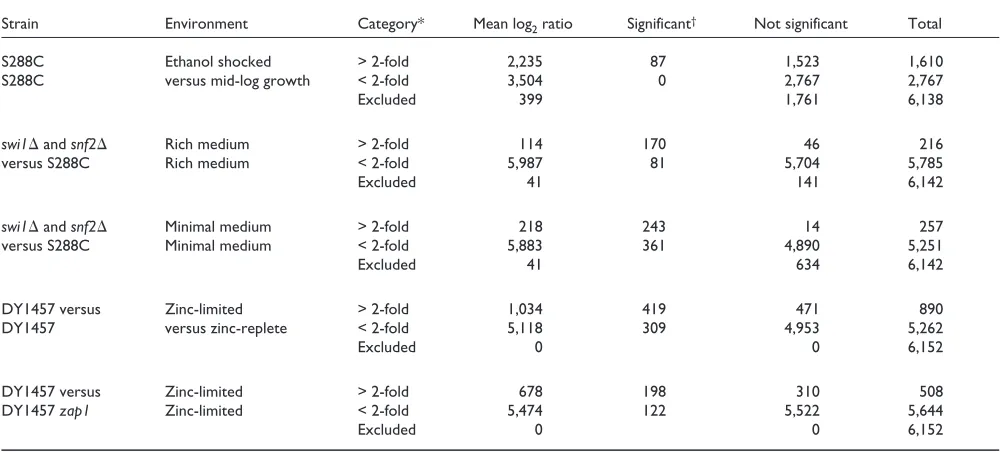
Table 1
Pairwise comparisons of gene-expression level category by mean log2ratio and by Bayesian estimation with statistical significance Strain Environment Category* Mean log2ratio Significant† Not significant Total
S288C Ethanol shocked > 2-fold 2,235 87 1,523 1,610
S288C versus mid-log growth < 2-fold 3,504 0 2,767 2,767
Excluded 399 1,761 6,138
swi1andsnf2 Rich medium > 2-fold 114 170 46 216
versus S288C Rich medium < 2-fold 5,987 81 5,704 5,785
Excluded 41 141 6,142
swi1andsnf2 Minimal medium > 2-fold 218 243 14 257
versus S288C Minimal medium < 2-fold 5,883 361 4,890 5,251
Excluded 41 634 6,142
DY1457 versus Zinc-limited > 2-fold 1,034 419 471 890
DY1457 versus zinc-replete < 2-fold 5,118 309 4,953 5,262
Excluded 0 0 6,152
DY1457 versus Zinc-limited > 2-fold 678 198 310 508
DY1457 zap1 Zinc-limited < 2-fold 5,474 122 5,522 5,644
Excluded 0 0 6,152
cause very large changes in biological state [25-27], and for many metabolic genes, very large changes in expression may change pathway throughput very little [28]. Note also that
these criteria do not distinguish between cis and trans
effects on expression level. Presumably, many transeffects
percolate into much or all of the genome in very small ways; some of these effects may be overwhelmed by systematic
error induced by the technology, but most should be detectable with sufficient replication.
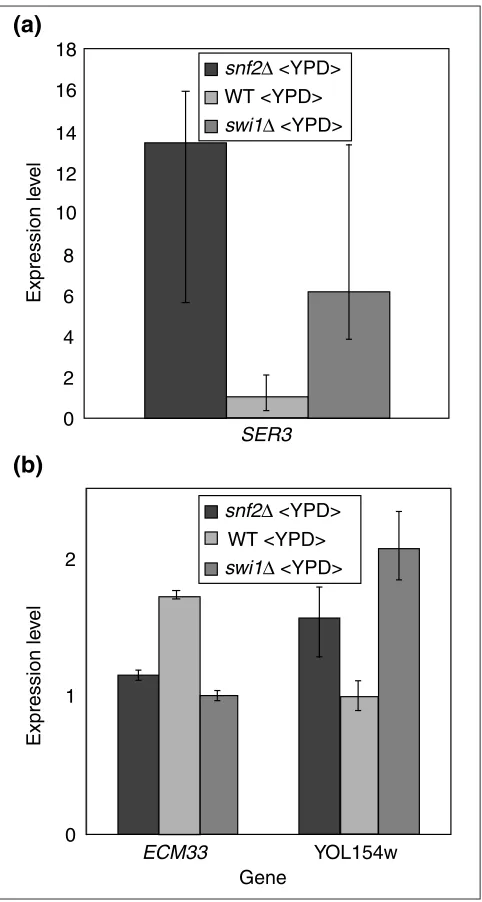
Credible intervals determined using BAGEL make it clear
that even SER3, which Sudarsanam et al.examine as a
can-didate gene differentially affected in the snf2 and swi1
strains on the basis of cDNA microarray and northern data [12], should not be inferred to be differentially affected solely on the basis of their cDNA microarray data. Although
estimates of the abundance of SER3 transcript differ by
more than twofold, the credible intervals for these two mutants have extensive overlap (Figure 7a). Examining the rich-media cDNA microarray dataset for other candidates for differential expression, we observe that there are 27 genes in which only one of the two mutants has nonoverlap-ping credible intervals with the wild type.
More important, there are just two genes in this global dataset for which the credible intervals of expression levels
in snf2 and swi1 mutants do not overlap. This answers a
question posed by Sudarsanam et al.as to whether the
dif-ferences in gene expression between these mutants that they observed were due to variation in microarray measurements or to real differences between the mutants [12]. Nearly all differences they observed in the transcriptional profiles of these two mutants are potentially due to variation in
microarray experiments. A scatterplot of the log2 estimates
of gene-expression levels for genes significantly different from wild type, in the two deletion mutants compared to wild type, yields a linear correlation of 0.97 (Figure 6b). The large number of genes meagerly expressed compared to wild type in both deletion mutants is consistent with the roles of Snf2p and Swi1p as transcriptional activators. In addition, globally, not a single gene shows a contrasting change in expression in comparison to wild type. This affirms the con-clusion [12] that the two genes work almost entirely in concert in the media conditions tested. The expression levels of the two genes detected by BAGEL as having significantly
different expression in the two mutants, ECM33 and
YOL154w, are shown in Figure 7b. The small magnitude of
the difference observed in ECM33between the two strains
may indicate that this highly statistically significant differ-ence is biologically irrelevant, but certainly further investiga-tion of the significantly different gene-expression levels observed in YOL154w is warranted.
[image:8.609.56.297.85.536.2]Quantitation of short transcript sequence tags by serial analysis of gene expression (SAGE) [29] yields absolute counts of expressed sequences in the yeast genome [30]. These quantitations may be used to put relative expression values obtained from BAGEL on an absolute scale. There are issues with sampling error and non-uniqueness of sequence tags in SAGE assays [31] as well as with the linearity of cDNA microarray ratio measures [17], and with differences between the ‘wild-type’ strain used in SAGE and in cDNA microarray experiments. These sources of error are many, Figure 7
Candidates for genes differentially expressed in mutants snf2and swi1. (a)SER3is an example of a gene that should not be inferred to be differentially expressed on the basis of this microarray data despite a greater than twofold difference in estimated expression level. Credible intervals for gene expression of SER3in swi1andsnf2mutants do not overlap with the credible interval for wild-type gene expression, but have extensive overlap with each other. (b)Two genes detected by BAGEL as differentially expressed in the two mutants.
SER3
Expression le
v
el
Expression le
v
el
0 2 4 6 8 10 12 14 16 18
snf2∆ <YPD> WT <YPD>
swi1∆ <YPD>
Gene 0
1 2
ECM33 YOL154w
snf2∆ <YPD> WT <YPD> swi1∆ <YPD>
(a)
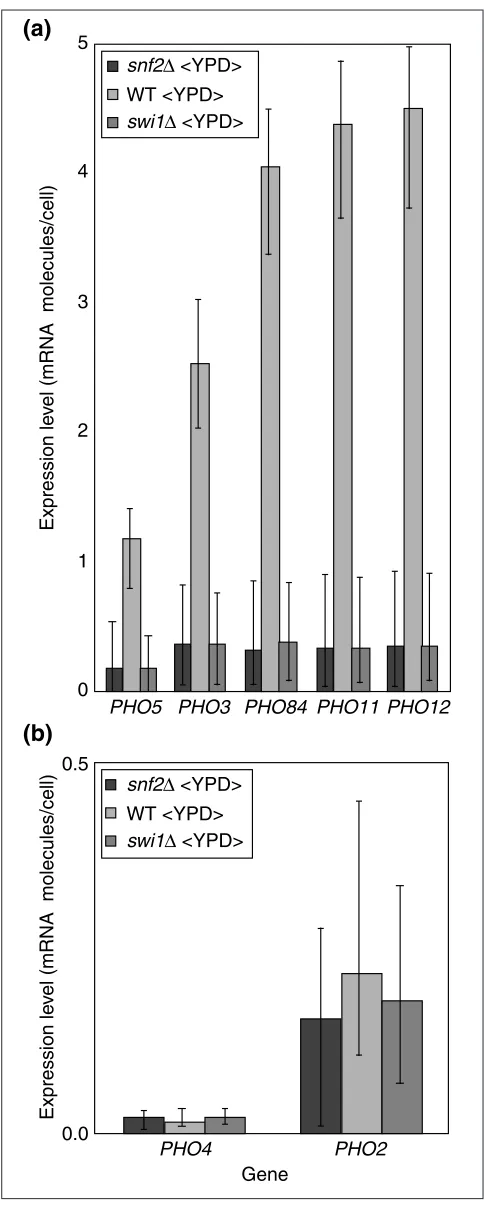
but small and uncorrelated. With these caveats in mind, Figure 8a assumes that SAGE counts are exact in order to provide absolute expression levels inferred using BAGEL,
normalized so that the wild-type strain on rich medium is assumed to have the same expression levels as indicated by SAGE assay [30]. Figure 8a shows that, as observed by
Sudarsanam et al.[12], the acid phosphatase genes are
mea-gerly expressed in snf2and swi1mutants.
Note that although there is esthetic appeal to having the measurements reported on an absolute basis of transcripts per cell, little additional information is obtained by this transformation for most experimental questions, as the
result is simply a rescaling of the y-axis for each gene. Also,
whereas the statistical significance of BAGEL results is robust to considerable deviation from general linearity of cDNA microarray results, the quantitative result using SAGE counts as a basis depends critically upon the linearity of cDNA microarray measurements. Lastly, it is unclear how to scale meagerly expressed genes that had a count of zero in a
SAGE analysis. PHO4is such a gene; in Figure 8b, we have
arbitrarily charted a frequency that would be appropriate if it were present at approximately one order of magnitude below the SAGE experiment’s detection threshold of 0.1
mol-ecules per cell. Neither PHO2nor PHO4shows significant
evidence of differential expression in snf2/swi1mutants.
Consideration of the raw ratio data led Sudarsanam et al.
[12] to thus conclude that PHO5gene expression is directly
controlled by Snf2p/Swi1p. PHO3, a ‘constitutive’ acid
phos-phatase, shows the same relative abundance across
snf2/swi1mutants as does PHO5(data not shown). The 87% identity of the nucleotide sequence of these genes means that cross-hybridization may confound inference
about their regulation. However, unlike PHO5, there is
cur-rently no evidence that PHO3 is regulated by PHO2 or
PHO4. PHO5 may share a direct Snf2p/Swi1p regulatory
mechanism with PHO3.
Analysis presented here supports the result that SWI1and
SNF2work almost entirely in concert within the cell in rich
medium [12]. As Sudarsanam et al. noted, however, the
proteins may not always be produced together in all condi-tions. Moreover, it should be noted that their experimental
comment
reviews
reports
deposited research
interactions
information
refereed research
PHO3
PHO5 PHO84 PHO11 PHO12
Gene
Expression le
v
el (mRNA molecules/cell)
Expression le
v
el (mRNA molecules/cell)
PHO4 PHO2
WT <YPD> swi1∆ <YPD> snf2∆ <YPD>
WT <YPD> swi1∆ <YPD> snf2∆ <YPD> 0
1 2 3 4 5
0.0 0.5
(a)
[image:9.609.55.297.83.688.2](b)
Figure 8
design has the least power to detect these specific differ-ences. This is because all comparisons of expression level between the mutant strains are transitive comparisons, which inherit the variance associated with the intermediary wild-type expression level as well as the variance associated with the expression levels of the two mutant strains. The result is that on a log scale the credible intervals of gene-expression level are broader for the two mutants than for the wild type. This outcome is a recurrent problem with a repeated reference-sample experimental design: one learns the most information about the reference sample, which is frequently arbitrary and not necessarily of interest. An ideal addition to the experimental design in Figure 1b would be several direct comparisons of the mutant strains. Then, both transitive and direct information would contribute to the statistical power of a BAGEL analysis for any comparison. It is also clear that an increase in number of comparisons would yield more power to detect differentially expressed genes, and would indeed find more of them. Every single gene that was detected as significantly differentially expressed in only one of the two mutants compared to wild type in the rich medium was significantly different in
expres-sion level only in the swi1mutant. The swi1mutant
com-parison to wild type had one more replicate than did the
comparison of the snf2mutant (Figure 1b).
Zinc regulation
Lyons et al.examined wild-type and zap1mutant strains of
yeast growing in cultures containing three different con-centrations of zinc ([13], and Figure 1c). Zap1p is a tran-scriptional activator that appears to regulate transcription of the zinc-uptake system genes in response to zinc [32]. Using the nonoverlapping 95% credible interval criterion, a BAGEL analysis on this data reveals 469 genes signifi-cantly more abundantly expressed in cells grown in zinc-deficient medium compared to cells grown in zinc-supplemented medium, and reveals 261 genes signifi-cantly less abundant in the same comparison. This is a total of about 10% of the genome, and is two thirds of the number found by use of an averaged twofold criterion. A considerable number of the genes viewed as abundant by a twofold criterion, then, are not significantly different by the credible interval criterion (Table 1, Figure 6c, lower left and lower right quadrants). Moreover, 42 of the genes sig-nificantly different by the credible-interval criterion are significantly different at a ratio of below twofold (Figure 6c, densely packed between the dashed lines delim-iting a twofold change). As one might generally expect,
making ZAP1 nonfunctional in a zinc-deficient
environ-ment creates a similar relative effect on most significantly differentially expressed genes to that created by providing zinc to a zinc-deficient wild-type strain (Figure 6d).
A common technique to discover candidate genes of interest in microarray studies is to pick out overlapping sets of genes expressed at a ratio greater than some cutoff from replicate
and/or different microarray experiments (for example, Figure 1 of [13], Figure 1 of [33]). BAGEL supplants any need to examine overlapping gene sets in replicate experiments. Moreover, it provides a statistically rigorous method for comparison of multiple different experiments. The equiva-lent of an overlap in two lists of highly expressed genes is that neither of the credible intervals for gene-expression level in a given gene in two experimental conditions overlaps the reference condition.
For instance, BAGEL analysis of the zinc-regulation data revealed 96 genes whose levels of gene expression in a wild-type genotype and zinc-deficient medium were significantly
greater than both zinc-supplemented wild-type and zap1 in
zinc-deficient medium. This is 31 more genes than were detected using the twofold criterion. Figure 9 shows BAGEL
results for two genes, PHM7and YGL121c, discussed by [13],
as well as results on four other genes. A zinc-responsive element (ZRE) consensus DNA sequence, ACCYTNARGGT (in the single-letter amino-acid code, where N is any nucleotide, Y is C or T, and R is A or G) (compare Figure 2 of
[13]), is located in close proximity to CTT1 (chromosome
VII, location 65270-80), MNT2(VII, 20659-69 and
20774-84), YOL083w (XI, 442975-85) and YNL253w (XIV, 169669). BAGEL results shown in Figure 9 convey not just the significance but also the extent of differential regulation.
CTT1 and YOL083w are like the two genes PHM7 and
YGL121c discussed by [13], in that having the zap1::TRP1
genotype does not entirely eliminate transcriptional response to zinc deficiency. These intermediate levels of expression indicate the action of auxiliary zinc-regulatory mechanisms.
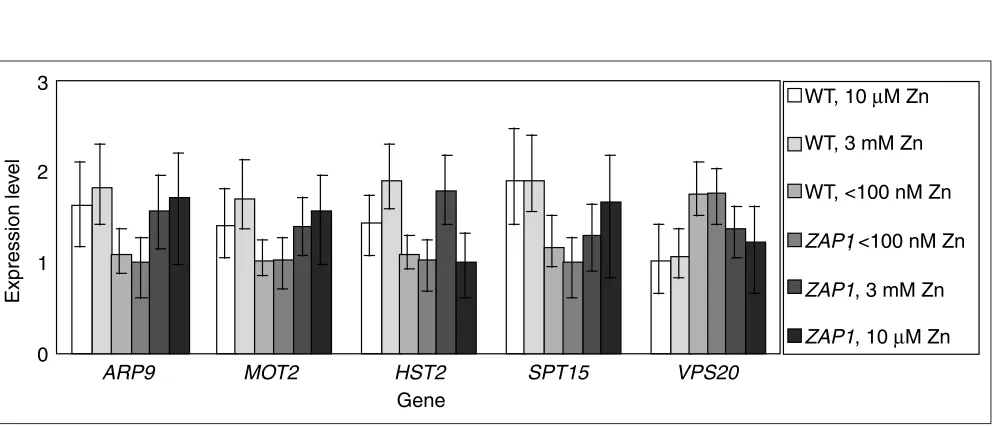
Figure 10 charts several transcription factors that are sig-nificantly differentially expressed below the twofold level. For every gene shown, the credible intervals between wild type in 3 mM zinc and wild type in < 100 nM zinc do not
overlap. For VPS20, in contrast to the other four genes,
expression is greater when in zinc-deficient medium. Expression levels in Figure 10 are graphed cosequentially with the experimental design structure (Figure 1c). As a result, the increasing size of credible intervals as one scans from the middle expression nodes to the expression nodes at the ends of the chain of experiments is clear. The largest
credible interval is for the zap1strain grown in 10M zinc,
on the far right of each cluster of columns. This is as expected, given that it is at the end of the line of compar-isons and is informed by only one cDNA microarray com-parison. In a balanced linear set of comparisons such as this, it turns out that for any gene on a log scale, the credi-ble intervals around the gene-expression values of the ends are greater than the credible intervals around those in the middle of the chain (data not shown).
than two neighbors. Specifically, direct comparisons
between wild type in 3 mM Zn and zap1in 3 mM Zn would
complete a circle of comparisons, increasing transitive infor-mation on all expression nodes. Cross-circle comparisons would also contribute considerable power. Generally, elimi-nating ‘ends’ of chains of comparisons should be a goal of any cDNA microarray experimental design.
Conclusions
Small datasets such as the ethanol dataset are very good can-didates for use of a more informative prior distribution to keep variances within a reasonable range and yield better results. Analysis of larger datasets indicates that true vari-ances for microarray data within this model are not larger than one. The impact of using less-vague priors, especially
comment
reviews
reports
deposited research
interactions
information
[image:11.609.59.556.88.293.2]refereed research
Figure 9
A sample of genes differentially expressed between (wild type, 3 mM zinc) and (wild type, < 100 nM zinc) expression nodes. Six genes located in proximity to zinc-responsive element consensus sequence ACCYTNARGGT that are meagerly expressed in both wild-type genotype grown with 3 mM zinc and zap1genotype grown with < 100 nM zinc. PHM7and YGL121c were identified and remarked upon in [13] for the difference in expression level between (wild type, < 100 nM zinc) and (zap1, < 100 nM zinc), which reflects the action of zinc-regulatory mechanisms auxiliary to Zap1p.
PHM7
YGL121c
CTT1
YNL253w
Gene
WT 3 mM Zn
WT <100 nM Zn
zap1 <100 nM Zn
MNT2
YOL083w
Expression le
v
el
0
5
10
15
20
25
Figure 10
Six transcription factors that are significantly differentially expressed at below the twofold level between wild type, 3 mM zinc and wild type, < 100 nM zinc. Note that each column cluster above is arranged in the linear order of the experimental comparison chain, from wild type, 10 M zinc to zap1, 10M zinc; credible intervals for expression levels obtained for expression nodes at the ends of the chain are wider than those obtained for expression nodes in the middle of the chain.
ARP9
MOT2
HST2
SPT15
VPS20
Gene
WT, 10
µ
M Zn
WT, 3 mM Zn
WT, <100 nM Zn
ZAP1, <100 nM Zn
ZAP1, 3 mM Zn
ZAP1, 10
µ
M Zn
Expression le
v
el
[image:11.609.59.558.360.573.2]for the variance, when there are few comparisons, is under investigation by a number of researchers. A hierarchical Bayesian model [34] has been used to analyze ratio data and provide 95% confidence intervals for the log ratio of gene expression from reference to control. This method assumes normal distributions of the log ratios rather than ratios of normal distributions. It has a hierarchical structure that allocates error variance among microarrays and experi-ments. The authors suggest use of calibration data, or, alter-natively, empirical evaluation of the distribution of variances across all other genes in order to construct a prior. A subset of genes of nearly equal intensity can be used to form a prior for variances [35]. This prior was used by the authors to
input reliable variances in t-tests of significance. Promising
advances have been made on Bayesian methods for correct-ing misleadcorrect-ing fold-change measurements made from low-intensity spots [36], using a gamma rather than normal model of ratio results.
All these methods have considerable potential to be incorpo-rated as priors into a framework such as that presented here, so that the prior may be applied to multiple samples from different genotypes, environments or developmental states. Priors such as those above should result in smaller credible intervals and detection of increasingly significant differences because they curtail the exploration of unrealistically high variances that small datasets have too few observations to rule out ‘on their own’. Continued work in this area, using an increased amount of non-ratio data provided from scanned microarrays, should be very fruitful [10]. Furthermore, pos-terior distributions from such analyses of gene-expression level have subsequent use in Bayesian methodologies for clustering [37] and tumor identification [38].
In summary, the model-based approach we have imple-mented can accommodate complex and unbalanced experi-mental designs. Some research will continue to be carried out comparing just two samples multiple times. However, complex designs will increase in popularity as investigators explore multiple genotypes, environments and develop-mental states within a single research project [18]. The utility of this approach in determining levels of gene expression may be maximized if these designs incorporate certain features.
First, compare samples of direct interest directly. When interested in the differences between two samples, compare them to each other rather than to an arbitrary reference sample [7,8]. Whenever possible, study a few expression nodes thoroughly, rather than many superficially.
Second, replicate each comparison at least once [39]. Whether this is done directly by incorporation of dye during reverse transcription, or, preferably, by labeling incorpo-rated amino-allyl-dUTP, reverse the dye labeling to amelio-rate any dye effect thereof [9,10,18].
Third, eliminate ‘ends’ of comparison chains by carrying out hybridizations comparing one end to another. This allows reconciliation of transitive data around a circle of compar-isons. The more circles created, the more reconciliation occurs. The smaller the circumference of the circle created, the stronger the transitive power.
Fourth, connect nodes otherwise distantly located on a chain of comparisons with extra cross-comparisons. The number of ‘extra’ comparisons to make depends on what size of effect is of interest. The observation of a small but significant effect on key regulatory genes may be of greater biological interest than the same observation on a metabolic enzyme. The appropriate weighing of the cost of additional comparisons against the greater precision of measurement depends criti-cally upon the question being asked.
For time-course experiments or any other experiment with
an explicit ordered x-axis these guidelines may still be
fol-lowed, as long as replicate comparisons are made among nodes. Inferred estimates at each node are assessed
inde-pendently of location along the x-axis, so that regressions
across them are valid. Ultimately, experimental design may be subject to limitation owing to lack of resources or experi-mental failure. Fortunately, within a framework such as that developed here, missing spots or missing comparisons do not require any special consideration or any change in methodology. Credible intervals acquired for less well deter-mined genes or less well deterdeter-mined expression nodes are correspondingly larger. This quantitative information on gene-expression levels tendered by a thorough analysis of microarray results should be carefully considered in assess-ments of the biological effects of genetic or environmental differences upon cellular state.
Materials and methods
NormalizationFor the ethanol-shock dataset [11], raw data from GenePix files was processed as follows. Any spot was excluded from analysis if both the Cy3 and Cy5 fluorescence signals were within two standard deviations of the distribution of intensi-ties of the background pixels for that spot. These low-inten-sity spots are those most aberrant in fold-change and are those for which the magnitude is adjusted most by the model
of Newton et al.[36]. Expression values were normalized by
linear scaling of the Cy5 values so that the mean Cy5 and Cy3 values of nonexcluded spots were equal. Two of three experi-ments thereby achieved a linear log-log intensity plot for included spots, with slope approximately 1. The third was linearized by exponentiation of the Cy3 channel to 0.8, before normalization of the means.
For other experiments, ratio and spot pass criteria were used as reported in the papers. In the dataset released by
hybridizations between wild-type and snf2 nodes was excluded from analysis because it had an anomalous global mean log ratio of -0.26, whereas for all others that value was very nearly zero. For the zinc-regulation dataset [13], no pass criterion had been used to ensure each spot on each microar-ray carried considerably more signal than noise. The data appeared to be of high quality. However, in a few cases, one or two misleading data points from low-intensity spots may have led to especially high gene-by-gene error variance esti-mates and thus concealed otherwise significant differences.
The best normalization method and spot pass criteria are highly dependent on cDNA microarray protocol, methodol-ogy, experimental experience and analytical resources. As long as normalization method and spot pass criteria are applied uniformly within a dataset, the resulting ratios should be appropriate for analysis by the model described here.
Model
In microarray experiments, the original idea was that, with current technology, spots on a cDNA microarray had a number of confounding pseudolinear terms - whose varia-tion from experiment to experiment could be minimized but not eliminated - which contributed to the intensity measure-ments observed when a hybridization was scanned. Model parameters under this scheme differ from those used for high-density oligonucleotide microarrays [40]. These terms included the density and size of the cDNA deposition, the correspondingly larger or smaller amount of labeled mRNA hybridized to the microarray, the hybridization conditions and the sequence of the gene [41]. With these assumptions, the post-normalization intensity in one fluorescence channel at a reporter spot may be modeled linearly as
q
m=1cm
t
l=q+1
cl+ , (1)
where is the absolute quantity of mRNA per cell, the cmare
terms for any qmultiplicatively confounding factors, the cl
are terms for any q - tlinearly confounding factors, and is
an error term accounting for mild pseudorandom departures from linearity and unavoidable small variations in cell-growth conditions. Note that multiplicative error associated with the sample must have been compensated for by an appropriate normalization ([42], reviewed by [43]); if, on the other hand, there are considerable multiplicative factors that
are common to a spot, they are accommodated by the cm
above. This model cannot be directly implemented because experimental replication to estimate each confounding term is technically difficult. These difficulties led to a rapid con-clusion that the information that can be best obtained from a cDNA microarray experiment is ratio information rather than absolute quantification. This is because the confound-ing spot terms above will apply equally to two samples com-petitively hybridized against a single spot on a single microarray, yielding a ratio that correctly represents the ratio of expression levels in the comparison of interest.
When comparing just two samples, ratio measurements are nearly as good as absolute data. However, when more than one genotype or environmental condition or cell develop-mental stage is examined, ratio measurements rapidly become cumbersome because comparing across numerous states requires a common unit of measurement. Therefore it is of interest to use these ratio measurements within a statis-tical model to estimate gene-expression levels in a common (if arbitrary) unit, and also to assess the significance of such a difference.
Consistent with the original interpretation of cDNA microarray data that privileged ratio over absolute quantification [41],
the observed ratios of intensities, yij, may be modeled as
i
qm=1cm
t
l=q+1
cl + i
yij= ———————————————————— , (2)
j
qm=1cm
t
l=q+1
cl + j
where i and j are the scaled quantities of mRNA in
samples iversus j. This expression is true for any terms that
are consistent for both mRNA preparations, regardless of linearity, which is fortunate, as there are known nonlineari-ties in microarray data acquisition [17]. This yields
i
i+ ———————————
mq=1cmt
l=q+1
cl
yij= ———————————————————— , (3)
j
i+ ———————————
mq=1cmt
l=q+1
cl
Assuming that error terms are composed of many small,
unbiased effects, and scaling the error terms iand jby
mq=1cmt
l=q+1
cl,
a constant for every microarray spot, so that they are
distrib-uted with variances specific to each sample, i2 and
j2, it
follows directly that the observed ratio data, zij, are drawn
from
N(i, 2i) ———————.
N(j, 2j)
This can be true even if the distribution of intensities across spots and arrays is decidedly not Gaussian, because con-founding factors which vary linearly or multiplicatively or even interactively across spots or arrays are commonly pre-sumed not to be different between two labeled samples hybridized to a single spot [41]. Note that samples may,
comment
reviews
reports
deposited research
interactions
information
under this formulation, have different variances as well as different means.
The ratio of standard normal distributions is a Cauchy distri-bution, which has the unpleasant property that it has no moments. The ratio of nonstandard normal distributions is not much better. Fortunately, the infinite tails of the normal distributions that result in this property are not generally observed in real data; in fact, a model that allows negative gene expression levels is not valid. The joint normal distribu-tion may be truncated at a considerable distance from its peak, along an elliptical probability contour within the
posi-tive quadrant [44], yielding a ratio zijdistributed
approxi-mately as
(i- jz)
2
i
2
,j+ j2,iz - —————
fziji,2i,2j = —————————————— e 2(i
2+
j
2z2)
. (4)
2——i2+ j2z23--2
This approximation of the density of the ratio of two
nonstan-dard normal distributions is extremely good as long as i>>i
and j>> j, which is certainly true for informative cDNA
microarray experiments. It is not symmetrical like a normal distribution, but skewed with a long right-hand tail, like gene expression data. Moreover, as implied above, if microarray data contain no negative expression levels (a natural
proposi-tion), it is likely that the distribution of zabove is closer to the
true distribution of microarray data than is the distribution of the ratio of true normal distributions.
Let us consider how this result may be used. An ideal statis-tical framework for the analysis of microarray ratio data could be used to analyze microarray data of any experimen-tal design including any number of treatments, genotypes, or developmental states; would be highly robust to missing data; and would yield estimates of the magnitude of expres-sion differences and measures of statistical significance across all treatments, genotypes, and developmental states.
The number of expression nodes, n, is equal to the number
of permutations of strain, treatment, and developmental state that are examined. Unless informative prior informa-tion about expression levels or error variance is used, the fol-lowing (minimal) requirements must be met. First, every node of interest must be present in at least one comparison. Second, every node of interest must be connected to every other node of interest by an unbroken chain of comparisons. And third, there must be as many comparisons as there are mean and variance parameters to be estimated.
If separate error variances for each sample are to be esti-mated as well as means, the last requirement indicates that
there must be at least 2n -1 measurements when each
expression node is assumed to have an independent
vari-ance, and there must be at least n measurements when each
expression node is assumed to have the same error variance.
A few measurements beyond the minimum contribute greatly to the power to detect differences in gene expression and to the ease with which significance of results is ascer-tained within the Bayesian framework. Figure 1 shows the comparison structure of experiments examined in this paper. The three-dimensional matrix of ratio results from
these comparisons, Z, may be constructed, with dimensions
idenoting the sample labeled with one fluorophore, j
denot-ing the sample labeled with another, and k denoting the
replicate ordinate of that particular comparison. Then, for any continuous structure of comparisons among the nodes
of interest, the likelihood density for the parameters land
l2, 1 l n, is, by Bayes’ rule,
h(1,i
2
…l, l
2
|Z) =
i=1n
f zijk|i,i2,j,j2
gi,i2,j,j2j=1
k
————————————————————————––––-————, (5)
Mll
i=1n
f zijk|i,i2,j,j2
gi,i2,j,j2 dl2 dlj=1
k
where g(i, i2, j, j2) is the prior distribution of the
para-meters, and where the probability f(zijk) of empty elements
in the data matrix Zis evaluated as 1.
Any genes for which i,j,kI(zijk1) < v, where Iis an indicator
variable and v= nwhen variances are common among all
samples within a gene and v= 2n - 1 when variances are not,
yield improper posteriors unless an informative prior is used. These few genes are not analyzed here, nor are genes
whose matrix Zis reducible. Note that diagonal entries in Z
are control, self-self hybridizations, in which the same expression node has been labeled with two different dyes. In this framework, these controls can and should be included in the dataset if performed with all sources of experimental error included in their preparation. They contribute to esti-mation of the error variance of genes.
credible intervals constructed are close to those that would be found by maximum likelihood if analytical integration of the full multidimensional parameter surface were feasible. A
frequently used ‘noninformative’ prior such as -1[45] is in
this case not desirable, because, in practice, the most likely variances observed are so small that this prior has a consid-erable impact on the posterior distribution.
Fortunately, we may use the constant denominator of the Bayes’ rule formulation (Equation 5) to assert that
h(1,12…l, l2|Z)
i=1
n
f zijk|i,i2,j,j2
gi,i2,j,j2.j=1
k
(6)
This may be used to construct a Markov chain whose station-ary distribution is the posterior distribution of the
parame-ters given the data. A vector 씮2 and a vector 씮 of initial
expression levels, [1, …,n] is chosen such that 1—
n
n
1l= 1 at
step t = 0, and subsequent values in the chain are
deter-mined iteratively by choosing successive proposed values according to an acceptance rule.
Our proposed values are constructed in two separate steps.
First, two of the ngene-expression level parameters from 씮
are chosen at random. A step size is drawn at random from a triangular distribution centered at zero with range
[-, +]. The first of the two chosen parameters is
incre-mented by the chosen step size, and the second is
decre-mented by the same quantity, so that 1—
n
n
1lⴕ= 1 is
maintained, where the apostrophe indicates a proposed parameter value. In the next iteration, the variance
parame-ters, l2 are incremented by an amount drawn at random
from a triangular distribution with range [-2, +2] to
form l2ⴕ. Because these operations have probabilities of
transitions from the current state to the proposed state equal to the probabilities that the converse transitions would have, this proposal scheme satisfies Hastings [46] and can be implemented in the Metropolis [47] algorithm. Thus the con-jecture is accepted for the next state of the Markov chain if
i=1n
f zijk|iⴕ,2iⴕ,jⴕ,j2ⴕ
giⴕ,i2ⴕ,jⴕ,j2ⴕj=1
k
RANDOM(0,1) < ——————————————————––––————,
i=1n
f zijk|i,i
2
,j,j
2
gi,i
2
,j,j
2
j=1
k
(7)
Otherwise the original state is retained for the next iteration of the Markov chain.
These steps are repeated over many generations in order to ‘burn in’ the chain, so that it converges from the initial
parameter settings to a stationary distribution. Subse-quently, states are sampled from the chain at regular inter-vals to build a posterior distribution for each parameter, integrated across the probable states of all other parameters. An easy-to-use stand-alone software program entitled BAGEL, which implements this Bayesian analysis of gene expression levels on MacOS or Windows platforms, is avail-able on the web with an online manual [48]. It accepts tab-delimited text files of ratio data as input.
To decrease the number of parameters that must be esti-mated, we estimate a single variance parameter for each gene across all expression nodes, which is equivalent to the
assumption that i and j from the same distribution for
every sample. On larger, more highly replicated datasets, where all parameters could be estimated, constraining the variance has not led to substantially different results (J.P.T., unpublished data and J.M. Ranz, personal communication). All analyses in this paper were performed with 20,000 gen-erations of burn-in, followed by 200,000 gengen-erations during which the chain was sampled every 20 generations to con-struct the posterior distribution. Runs using multiple
start-ing vectors씮and씮2 were performed and always converged
to the same, unimodal, posteriors, indicating that this is a well-behaved multidimensional likelihood surface (see Figure 2a). Results reported here were the outcomes of
Markov chains started with the elements of씮 all equal to
one, and started with the elements of 씮2 all equal to 0.03.
Step sizes and 2were tuned for each gene so that
accep-tance ratios for each parameter update were in the efficient and well-mixed range (0.15, 0.50) [49]. If acceptance ratios for either parameter jump were less than 0.15 or greater than 0.5, the chain was run again with a better-tuned jump size, until acceptable ratios for both parameters were obtained. In this way, there is no alteration of the jump size during any run. There is only the evaluation of pilot Markov chains to optimize jump size.
Output from the BAGEL software is in the form of a tab-delimited text file with one header row. Each row thereafter displays the results for a single gene, including columns with the estimate of expression level for each sample (the median of the posterior distribution); the additions and subtractions to make 95% upper and lower bounds on that estimate; the stationary acceptance rates for the Monte Carlo steps for that gene; and a column that reads ‘TRUE’ when those rates are acceptable. Further columns contain the posterior prob-abilities for whether that gene’s expression level in each expression node is greater, or lesser, than that gene’s expres-sion level in each other expresexpres-sion node.
Additional data files
Estimates and credible intervals for expression levels of all genes assayed in these experiments in all conditions are available with the online version of this manuscript as
comment
reviews
reports
deposited research
interactions
information
[image:15.609.58.295.577.671.2]![Figure 1Experimental designs for three studies analyzed using the BAGELand comparison of wild-type yeast and medium with three different concentrations of zinc [13], in a long,unbroken, replicated chain of comparisons](https://thumb-us.123doks.com/thumbv2/123dok_us/8652243.868072/2.609.313.555.83.507/experimental-bageland-comparison-different-concentrations-unbroken-replicated-comparisons.webp)