Effects of visible implanted elastomer
marking on physiological traits of frogs
Antwis, RE, Purcell, R, Walker, SL, Fidgett, AL and Preziosi, RF
http://dx.doi.org/10.1093/conphys/cou042
Title
Effects of visible implanted elastomer marking on physiological traits of
frogs
Authors
Antwis, RE, Purcell, R, Walker, SL, Fidgett, AL and Preziosi, RF
Type
Article
URL
This version is available at: http://usir.salford.ac.uk/id/eprint/36707/
Published Date
2014
USIR is a digital collection of the research output of the University of Salford. Where copyright
permits, full text material held in the repository is made freely available online and can be read,
downloaded and copied for noncommercial private study or research purposes. Please check the
manuscript for any further copyright restrictions.
Research article
Effects of visible implanted elastomer marking
on physiological traits of frogs
Rachael E. Antwis
1*, Rebecca Purcell
2, Susan L. Walker
2, Andrea L. Fidgett
2and Richard F. Preziosi
11Faculty of Life Sciences, University of Manchester, Carys Bannister Building, Dover Street, Manchester M13 9PL, UK 2Chester Zoo, Upton-by-Chester, Chester CH2 1EU, UK
*Corresponding author: Faculty of Life Sciences, University of Manchester, Carys Bannister Building, Dover Street, Manchester M13 9PL, UK. Tel: +44 7792 404546. Email: [email protected]
Amphibians possess innate immune defences, including antimicrobial peptides and symbiotic bacterial communities, that can protect them from infectious diseases, including chytridiomycosis. On-going research is attempting to use amphibian symbiotic bacteria to develop probiotic treatments that can protect hosts from the causative agent of chytridiomycosis, the fungal pathogen Batrachochytrium dendrobatidis. Events that cause disruption of symbiotic bacterial communities or deplete peptide stores could increase the susceptibility of individuals to disease and may have implications for amphibians involved in probiotic trials or time course studies that investigate symbiotic bacterial communities. It has previously been shown that passive integrated transponder tagging of frogs causes a rapid (within 24 h) and major proliferation of micro-organisms on the skin. Here, we show that marking of red-eyed tree frogs (Agalychnis callidryas) with visible elastomer has no effect on adrenal response (represented by faecal glucocorticoid metabolite concentrations) or peptide production, although there was evidence of a slightly greater microbial abundance associated with the skin of marked frogs 2 weeks after tagging. The results indicate that visible elastomer may be a preferable marking technique to passive integrated transponder tagging, particularly in the context of probiotic trials or time course studies that investigate symbiotic bacterial communities. More work is required to determine the effects of different marking techniques on physiological responses of amphibians, whether these physiological responses are consistent across host species and whether such ‘non-invasive’ marking methods affect the susceptibility of amphibians to infectious pathogens, such as B. dendrobatidis.
Key words: Amphibian, glucocorticoid, marking technique, peptide, symbiotic bacteria Editor: Steven Cooke
Received 23 May 2014; Revised 15 August 2014; Accepted 19 August 2014
Cite as: Antwis RE, Purcell R, Walker SL, Fidgett AL, Preziosi RF (2014) Effects of visible implanted elastomer marking on physiological traits of frogs. Conserv Physiol 2: doi:10.1093/conphys/cou042.
Introduction
Amphibians are currently undergoing major global popula-tion declines, a major driver of which are emerging infec-tious diseases, such as chytridiomycosis and ranaviruses (reviewed by Gray et al., 2009; Kilpatrick et al., 2010). Amphibians possess innate immune defences, including antimicrobial peptides and symbiotic bacterial communi-ties, that can protect them from such diseases (reviewed by
Rollins-Smith and Conlon, 2005; Rollins-Smith et al., 2011;
Bletz et al., 2013). The potential for using symbiotic bacte-ria for probiotic treatments against chytridiomycosis is cur-rently being investigated (reviewed by Bletz et al., 2013), and on-going research has identified symbiotic bacteria that inhibit the growth of the chytridiomycosis fungus,
Batrachochytrium dendrobatidis, from a number of
amphibian species (e.g. Harris et al., 2006; Culp et al., 2007; Lauer et al., 2007; Banning et al., 2008; Brucker
et al., 2008; Flechas et al., 2012; Loudon et al., 2013; Roth
et al., 2013).
by guest on October 8, 2014
http://conphys.oxfordjournals.org/
Research article Conservation Physiology • Volume 2 2014
Events that cause disruption of symbiotic bacterial com-munities or deplete peptide stores could potentially increase the susceptibility of individuals to disease and may have implications for amphibians involved in probiotic trials or time course studies that investigate symbiotic bacterial com-munities. Wild and captive amphibians are often marked for a variety of reasons, including identification of individuals, in order to avoid resampling, or to conduct mark–release– recapture surveys. Historically, toe-clipping was often used for identification, although less invasive techniques, such as passive integrated transponder (PIT) tagging or visible implant elastomer (VIE) dyes, are now more commonly used. The existing literature indicates that these marking techniques have few negative effects on amphibians (e.g.
Kinkead et al., 2006; Phillips and Fries, 2009; Schmidt and Schwarzkopf, 2010; Sapsford et al., 2014), although a recent study showed that PIT tagging causes a proliferation in resi-dent bacteria and fungi on the skin of frogs (Antwis et al., 2014a).
Amphibian peptides are produced and stored in granular glands and control the colonization of the skin by both pathogenic and symbiotic micro-organisms (reviewed by
Conlon, 2011). It is thought that amphibian peptides have a reciprocal relationship with symbiotic bacterial communities on the skin and may play a role in maintaining the bacterial community by limiting their antimicrobial potency (reviewed by Boman, 2000; Conlon, 2011). Although peptide produc-tion and secreproduc-tion occurs continuously at a low level, it increases substantially in response to stressful events, such as alarm, injury or pathogenic infection (Rollins-Smith et al., 2011; Pask et al., 2012). Peptide granular glands are sur-rounded by a layer of myoepithelial cells containing
α-adrenoreceptors that are activated by adrenaline (epineph-rine) or noradrenaline (norepineph(epineph-rine) to induce the release of peptides (reviewed by Rollins-Smith, 2001; Delfino et al., 2006). The greater the stress experienced, the greater the level of peptide release by an individual; Xenopus laevis injected with increasing concentrations of noradrenaline showed a concurrent increase in release of peptides ( Rollins-Smith et al., 2005). Particularly stressful events can cause granular glands to become exhausted of peptides, and studies have shown that concurrent increases in glucocorti-coids lead to the inhibition of transcription factors required to produce peptides (Simmaco et al., 1997, 1998). This tem-porary absence of peptides can lead to the proliferation of bacterial communities (Simmaco et al., 1998) and may explain the results seen by Antwis et al. (2014a).
There are limited studies that have investigated the effects of marking techniques on steroid (e.g. adrenaline, noradrena-line, glucocorticoid) production in amphibians. Kinkead et al. (2006) showed that two species of salamanders (Desmognathus
fuscus and Desmognathus monticola) marked with VIE or
toe-clipped under varying degrees of anaesthesia did not exhibit increased noradrenalineor adrenaline levels in com-parison to unmarked salamanders. Handling has been shown to increase circulating glucocorticoid concentrations in a
range of amphibian species (Woodley and Lacy, 2010;
Narayan et al., 2011a, 2012a, 2013), and toe-clipping causes a significant and prolonged (>3 days) increase in circulating corticosterone in cane toads (Rhinella marina; Narayan et al., 2011b). However, to the authors’ knowledge, the effects of other marking techniques on glucocorticoid production have not been evaluated for amphibians, along with concurrent effects on peptide release and bacterial communities. Here, we determine the effects of VIE marking on culturable cutaneous microbial abundance, peptide release and faecal glucocorti-coid metabolite concentrations of captive red-eyed tree frogs (Agalychnis callidryas).
Materials and methods
Ethics statement
The Chester Zoo Ethical Committee and the University of Manchester Ethics Committee approved this study prior to starting. This study did not require a UK Home Office licence because VIE tagging is an approved method for the identifica-tion of frogs, and data were collected during routine marking of frogs for identification purposes. Frogs were checked daily throughout the study and for 2 weeks after for any signs of adverse reaction to any of the techniques used, none of which was observed.
Study animals, husbandry and
experimental design
A total of 16 adult A. callidryas were used in this study; eight (four males, four females) in the control (unmarked) group and eight (four males, four females) in the marked group. All frogs were from the same clutch of F3 generation captive-bred individuals and had not previously been involved in any other studies. Prior to the start of the experiment, frogs were group housed in 60 × 45 × 45 cm glass tanks (ExoTerra®, UK) with a naturalistic set-up consisting of a LECA base for drainage and a soil layer covered with dried oak leaves, and planted with a peace lily and cuttings of devil’s ivy. Two weeks prior to the start of the study, frogs were randomly assigned to 16 individual experimental housing tubs (30 × 18 × 20 cm ExoTerra® plastic faunariums), with frogs from the same group housed tanks spread across treatment groups to allow for prior variation in bacterial communities. Individual housing was required to distinguish faecal samples between individuals and to avoid the potential for bacterial communities to be confounded by group housing during the study. Experimental tanks were lined with damp paper tow-els and contained a water dish and a cutting of devil’s ivy. Paper towels and water dishes were changed twice weekly. All tanks were maintained with a ZooMed Reptisun® 10.0 ultraviolet strip light with reflectors and a Philips daylight bulb with reflectors, both of which were on a 10:14 light:dark cycle. Frogs were fed three or four times weekly with black crickets (Gryllus bimaculatus) gut-loaded on fresh fruit and vegetables and dusted with Nutrobal (VetArk, UK).
2
by guest on October 8, 2014
http://conphys.oxfordjournals.org/
After a 2 week habituation period in the individual hous-ing, faecal samples were collected daily from day 1 until the end of the study (day 28) to measure faecal glucocorticoid metabolite concentrations (see ‘Faecal glucocorticoid
metab-olite concentrations’ section below for further details). On
day 8, frogs were sampled for bacterial communities and peptide release as described below (see ‘Microbial
communi-ties’ and ‘Peptide release’ sections). This provided baseline
data for each individual, which is referred to hereafter as ‘start of study’. On day 14, frogs in the ‘marked’ group were tagged using VIE dye (see ‘Marking techniques’ below for details). On day 15, all frogs were sampled again for bacte-rial communities and peptide release, and these data are referred to as ‘post-marking’. On day 28, bacterial communi-ties and peptide release were sampled again, and these data are referred to as ‘end of study’.
Marking techniques
Agalychnis callidryas in the marked group were tagged on
day 14 of the study using VIE dye (Northwest Marine Technology Inc., USA). This method was chosen because frogs were due to be rehomed at another institution and it was necessary to distinguish these frogs from existing A.
cal-lidryas in the collection at the receiving institution without
the requirement for individual identification. The elastomer dye was prepared according to the manufacturer’s instruc-tions. Gloves were worn throughout marking and changed between frogs to minimize cross- contamination. During marking, the frog was restrained on a flat and stable surface that had previously been sterilized, and the sterile needle con-taining the dye was inserted smoothly and quickly under the skin of the underside of the tibiofibular (G. Garcia, personal communication). The marking process was standardized and took ~30 s per individual. In order to determine whether the whole marking process affected physiological traits of frogs, control frogs were not sham injected or manipulated at the post-marking time point. All frogs were monitored for the remainder of the study and for 2 weeks after the end of the study for any signs of adverse reaction, none of which was observed.
Faecal glucocorticoid metabolite
concentrations
Tanks were checked daily within an hour of the lights coming on (A. callidryas are nocturnal and so defaecate at night), and any faecal samples were frozen at −20°C for subsequent anal-yses. Gloves were used to handle samples and changed between to avoid contamination. Glucocorticoid metabolite analyses were conducted at the Chester Zoo’s Wildlife Endocrinology Laboratory.
Glucocorticoid metabolites were extracted from faecal samples following thawing and manual homogenization using a wet-weight shaking extraction adapted from Walker
et al. (2002). In brief, the individual faecal sample weight was
recorded (mean = 0.138 ± 0.007 g) and then combined with
90% methanol, shaken overnight at room temperature and centrifuged for 20 min at 598g. The supernatant was decanted and evaporated to dryness under air. Faecal extracts were resuspended in 0.25 ml of 100% methanol and stored at −20°C until analysis.
Glucocorticoid metabolites (corticosterone) were analysed using a modified enzyme immunoassay (EIA) as previously described (Munro and Stabenfeldt, 1984; Watson et al., 2013). Each EIA used an antibody (polyclonal corticosterone antiserum CJM006 supplied by C. J. Munro, University of California, Davis, CA, USA), horseradish peroxidase- conjugated label (corticosterone prepared according to Munro and Stabenfeldt, 1984) and standards (corticosterone; Sigma-Aldrich, UK). The modified assay procedures were as follows for the corticosterone EIA. Antiserum was diluted at 1:15 000 in coating buffer (0.05 m NaHCO3, pH 9.6), and 50 µl per well was loaded onto a 96-well Nunc-Immuno Maxisorp (Thermo-Fisher Scientific) microtiter plate, which was cov-ered with a plate sealer and left overnight at 4°C. Plates were washed five times (0.15 m NaCl, 0.05% Tween 20) and then 50 µl per well of each standard and sample (3.9–1000 pg per well or samples diluted 1:10 in EIA buffer) were loaded in duplicate with 50 µl per well of horseradish peroxidase conju-gate diluted in EIA buffer (1:70 000). Following incubation in the dark for 2 h at room temperature, plates were washed five times and incubated with 100 µl per well of substrate [0.4 mm 2,2′-azino-di-(3-ethylbenzthiazoline sulfonic acid) diammo-nium salt, 1.6 mm H2O2 and 0.05 m citrate, pH 4.0], left to develop at room temperature in the dark and measured at 405 nm at optical density 0.8–1.0. The corticosterone EIA was biochemically validated for measuring corticosterone metabolites in A. callidryas faeces through parallelism (sam-ple percentage binding = 30.606 ± 0.8129, r2= 0.9209,
F1,7 = 81.461, P < 0.001) and matrix interference assess-ment (observed = 31.074 ± 1.522, r2= 0.998, F
1,7= 4089.8,
P < 0.001). The cross-reactivities for corticosterone antiserum CJM006 have been reported elsewhere (Watson et al., 2013), and the intra- and interassay variation were 7.52 and 6.33%, respectively. The assay was biologically validated by demon-strating a significant rise in faecal glucocorticoid metabolite concentrations from prior to any manipulations being con-ducted on frogs (i.e. days 1–8) to the highest value collected for each individual after this time (days 9–28; Student’s paired
t test; t = 3.213, d.f. = 15, P = 0.006).
Final corticosterone metabolite concentrations were calcu-lated per gram of wet faecal mass. Data collected before any handling or marking events (days 1–7) were assigned as ‘start of study’, data collected from 1 day post-marking until 5 days post-marking (days 16–19) were assigned as ‘post-marking’, and data collected from day 20 until day 28 were assigned as ‘end of study’. Raw data values for faecal glucocorticoid metabolite concentrations indicated an increase at around 3–5 days post-marking (days 17–19; Fig. 1), which is within the expected lag time in glucocorticoid metabolite deposition in faeces for a range of species (Wasser et al., 2000; Bamberg
by guest on October 8, 2014
http://conphys.oxfordjournals.org/
Research article Conservation Physiology • Volume 2 2014
et al., 2001; Martínez-Mota et al., 2008; Santymire et al.,
2012; Smith et al., 2012) including amphibians (Cikanek
et al., 2014). Therefore these data were used for the
post-marking time point as described above. Data were analysed in RStudio (using the lme4 package) for effects of treatment, time point and the interaction between treatment and time point using a generalized linear mixed model, with individual included as a random effect, with Tukey’s post hoc analysis for pairwise comparisons.
Microbial communities
Microbial communities were collected using similar methods to those previously described by Antwis et al. (2014b). Briefly, frogs were rinsed to remove transient bacteria using 50 ml of ultrapure water, which was retained for peptide quantification (see ‘Peptide release’ below). Frogs were then swabbed on their ventral surface 20 times using sterile swabs (Eurotubo®, Rubi, Spain). Gloves were worn throughout the swabbing process, which took ~30 s per frog, and changed between individuals to minimize cross-contamination. Swabbing meth-ods were consistent across individuals, treatment groups and time points. Swabs were placed into 1 m NaCl2 solution and serial dilutions constructed up to a concentration of 10−2. Concentrations of 10−1 and 10−2 were plated out on low-nutrient agar (R2A; Lab M, UK). Bacterial and fungal colony abundances were counted every 2 days until negligible new growth was observed (10 days after initial plating). Bacterial and fungal counts were then multiplied by their respective dilution factors and averaged for each individual. Data for bacterial abundance and fungal abundance were analysed
separately in RStudio (using the lme4 package) for effects of treatment, time point and the interaction between treatment and time point using a generalized linear mixed model with Poisson distribution, with individual included as a random effect. Tukey’s post hoc analysis was conducted for pairwise comparisons.
Peptide release
Prior to sampling for cutaneous microbes, frogs were rinsed on their dorsal and ventral surfaces by pouring 50 ml of ultrapure water over each surface five times. The final volume of liquid collected was recorded, and peptides were extracted from the water using previously described techniques (Rollins-Smith
et al., 2002; Woodhams et al., 2006; Sheafor et al., 2008;
Conlon et al., 2011). Briefly, samples were acidified to 1% using trifluoroacetic acid (TFA; Sigma Aldrich, UK) and then passed over individual Sep-Pak C-18 cartridges (Waters Associates, Milford, MA, USA) at a rate of 5 ml/min. Sep-Pak cartridges were primed prior to use with 1 ml of 1% TFA solu-tion as recommended by the manufacturers. Peptides were then eluted using 2 ml of elution solution composed of 70% acetonitrile (Sigma Aldrich, UK), 29.9% ultrapure water and 0.1% TFA. Eluted peptides were concentrated to dryness in a vacuum centrifuge (Genevac MiVac Modular Concentrator System) and reconstituted in 150 µl of ultrapure water.
Peptides were quantified in triplicate for each sample using a BCA Protein Assay Kit (Thermo Scientific Pierce, UK) according to the manufacturer’s instructions, except that bradykinin (Sigma Aldrich, UK) was used to establish a
[image:5.612.127.489.78.318.2]4
Figure 1: Faecal glucocorticoid metabolite concentrations for control (green) and visible implant elastomer dye (VIE)-marked Agalychnis callidryas (blue) over the 28 day study period. Error bars show ±1 SEM.
by guest on October 8, 2014
http://conphys.oxfordjournals.org/
standard curve (Rollins-Smith et al., 2002; Woodhams et al., 2006; Sheafor et al., 2008; Conlon et al., 2011). Interpolated peptide concentrations were averaged for each individual and adjusted by a scaling factor that accounted for the volume of liquid passed through the SepPak cartridges, and then divided by the mass of the corresponding frog to give a final peptide concentration per gram of frog. Peptide data were analysed in RStudio (using the lme4 package) for effects of treatment, time point and the interaction between treatment and time point using a generalized linear mixed model with Poisson distribu-tion, with individual included as a random effect. Tukey’s post
hoc analysis was conducted for pairwise comparisons.
Results
Faecal glucocorticoid metabolite
concentration
There was a significant effect of time (χ2= 29.679, d.f. = 2,
P < 0.001) but not treatment (χ2= 1.257, d.f. = 1, P = 0.0262) or the interaction between treatment and time (χ2= 1.990, d.f. = 2, P = 0.370; Figs 1 and 2) on faecal glucocorticoid metabolite concentrations. Post hoc analyses showed signifi-cant differences between control frogs at the start of the study and at the end of the study (P = 0.002) and between control frogs post-marking and at the end of the study (P = 0.001), with end-of-study faecal glucocorticoid metabo-lite concentrations being lower at the end of the study than at the other two time points (Supplementary Table S1; Fig. 2). Marked frogs at the end of the study had significantly lower faecal glucocorticoid metabolite concentrations than control frogs post-marking (Supplementary Table S1; Fig. 2). As time was the only statistically significant predictor of faecal glucocorticoid metabolite concentrations in the original
model, a simplified generalized linear mixed model contain-ing only this variable was run. This model was statistically significant (χ2= 29.282, d.f. = 2, P < 0.001), and post hoc analyses showed that faecal glucocorticoid metabolite con-centrations at the end of the study were significantly lower than those at the start of the study (P < 0.001) and post-marking (P < 0.001) across all frogs, but there were no sig-nificant differences between faecal glucocorticoid metabolite concentrations at the start of the study and post-marking (P = 0.377).
Microbial communities
There was a significant effect of time (χ2= 12 800, d.f. = 2,
P < 0.001) and the interaction between treatment and time (χ2= 2893, d.f. = 2, P < 0.001) on bacterial abundance, but not of treatment alone (χ2= 0.963, d.f. = 1, P = 0.326). Post
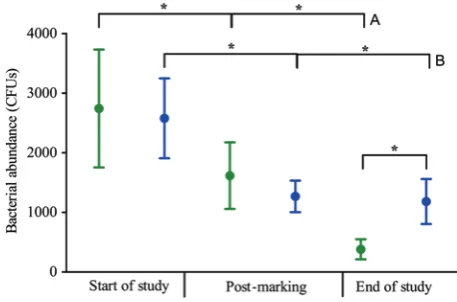
hoc analyses showed overall that there were significant
decreases in bacterial abundance over time for both treatment groups, and the bacterial abundance associated with control frogs at the end of the study was significantly lower than that of marked frogs at all time points (Supplementary Table S1; Fig. 3). In particular, marked frogs had significantly greater bacterial abundance than control frogs at the end of the study (i.e. 2 weeks post-marking).
There was a significant effect of time (χ2= 544, d.f. = 2,
[image:6.612.313.542.450.601.2]P < 0.001) on the abundance of fungi associated with the skin of frogs, but no significant effects of treatment (χ2= 1.309, d.f. = 1, P = 0.253) or the interaction between time and treatment (χ2= 0.016, d.f. = 2, P = 0.992). Post hoc analyses showed that marked frogs had a significantly greater fungal abundance at the end of the study than post-marking (Supplementary Table S1; Fig. 4).
Figure 2: Average faecal glucocorticoid metabolite concentrations for control (green) and VIE-marked A. callidryas (blue) at the start of the study, post-marking and at the end of the study. Error bars show
±1 SEM. An asterisk indicates a significantly different result (P < 0.05).
Figure 3: Average cutaneous bacterial abundance (in colony-forming units, CFUs) for control (green) and VIE-marked A. callidryas (blue) at the start of the study, post-marking and at the end of the study. Error bars show ±1 SEM. An asterisk indicates a significantly different result (P < 0.05; only main comparisons are shown, and all significant results are shown in Supplementary Table S1). Group A significance bars are all statistically different to one another and indicate a significant decrease in bacterial abundance over time for control frogs, and likewise for group B significance bars for marked frogs.
by guest on October 8, 2014
http://conphys.oxfordjournals.org/
[image:6.612.65.292.478.646.2]Research article Conservation Physiology • Volume 2 2014
Peptide release
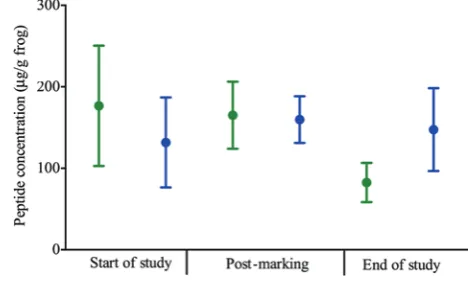
There were no significant effects of time (χ2= 2.226, d.f. = 2,
P = 0.329), treatment (χ2= 0.042, d.f. = 1, P = 0.838) or the interaction between treatment and time (χ2= 2.531, d.f. = 2,
P = 0.282) on the release of peptides by frogs (Fig. 5), and none of the pairwise comparisons was statistically significant (Supplementary Table S1).
Discussion
In this study, we found no evidence that VIE marking of frogs leads to an increase in faecal glucocorticoid metabolite concen-trations in comparison to unmanipulated control animals. It has previously been shown that marking Desmognathus sala-manders with VIE does not lead to increased noradrenaline or adrenaline in comparison to handling alone (Kinkead et al., 2006), but that handling leads to an increase in glucocorticoid concentrations above baseline levels in blood or urine from a range of amphibian species (Woodley and Lacy, 2010; Narayan
et al., 2011b, 2012a, b, 2013). There is evidence of a small
increase in faecal glucocorticoid metabolite concentrations from all frogs in this study after marking or handling (Fig. 1), although the individuals used in this study were captive bred and so may have been accustomed to some degree of manipu-lation. There was an overall decrease in faecal glucocorticoid metabolite concentrations across all frogs over the course of the study, with significantly lower concentrations at the end of the study compared with the other time points (Fig. 2). This may be due to the frogs becoming more familiar with the new environment or individual housing over the course of the study. Cikanek et al. (2014) found similar results in Panamanian harlequin frogs (Atelopus certus and Atelopus glyphus), with frogs maintained individually exhibiting lower faecal glucocorticoid metabolite concentrations than those main-tained in groups of two or eight, and those mainmain-tained in
group housing exhibiting a decline in glucocorticoid metabo-lite concentrations over the 4 week study period.
Faecal samples have been used to measure glucocorticoid metabolite concentrations in a range of taxa (e.g. Wasser et al., 2000; Bamberg et al., 2001; Martínez-Mota et al., 2008;
Santymire et al., 2012; Smith et al., 2012), including amphib-ians (Cikanek et al., 2014). The values for faecal glucocorti-coid metabolite concentrations obtained in the study presented here are similar to those obtained from A. certus and A.
glyphus, and adrenocorticotrophic hormone challenges in
these species indicated a similar lag time in glucocorticoid metabolite deposition in the faeces as for A. callidryas in this study (Cikanek et al., 2014). Changes in glucocorticoids are observed much more rapidly in urine and blood (within min-utes to 2 days; e.g. Woodley and Lacy, 2010; Narayan et al., 2011a, b, 2012a, 2013; Graham et al., 2013). Faecal sampling, however, offers an almost completely non-invasive method for monitoring adrenal activity in comparison to blood or urine collection, which requires handling of individuals to collect samples and thus can confound the data. Moreover, there is evidence from studies with mammals that faecal glucocorti-coid metabolites remain relatively stable over a number of days at room temperature (Washburn and Millspaugh, 2002;
Evans et al., 2013). The suitability of faecal or urine sampling for different species will be dependent on how a given species separates the deposition of glucocorticoid metabolites in waste products (e.g. Wasser et al., 2000; Bamberg et al., 2001). For example, attempts to validate glucocorticoid metabolites bio-chemically in the urine of A. callidryas and Agalychnis
more-letii by our research group were unsuccessful (R. Purcell,
personal observation), indicating that these species may pri-marily deposit glucocorticoid metabolites in their faeces.
Overall, there was a decrease in the abundance of bacteria on the skin of all frogs throughout the study period in both treatment groups, which may be related to the change in environment for the frogs (from group housing in naturalistic vivaria to individual housing in more sterile experimental enclosures). Küng et al. (2014) also observed shifts in
[image:7.612.309.545.74.215.2]6
Figure 4: Average cutaneous fungal abundance for control (green) and VIE-marked A. callidryas (blue) at the start of the study, post-marking and at the end of the study. Error bars show ±1 SEM. An asterisk indicates a significantly different result (P < 0.05).
Figure 5: Average peptide concentrations for control (green) and VIE-marked A. callidryas (blue) at the start of the study, post-marking and at the end of the study.
by guest on October 8, 2014
http://conphys.oxfordjournals.org/
[image:7.612.69.293.78.229.2]microbial communities over time, and environmental condi-tions in captivity are known to affect the bacterial communi-ties associated with A. callidryas (Loudon et al., 2013;
Michaels et al., 2014). However, at the end of study the marked frogs had a significantly greater bacterial abundance than the control frogs, with an elevated fungal abundance in comparison to themselves post-marking. Although the varia-tion around the fungal abundance data for marked frogs at the end of the study is considerable (Fig. 4), fungi were cul-tured from four of eight frogs in the marked group at this time point, in comparison to one frog post-marking and no frogs at the start of the study. These results indicate there may be some delayed microbial growth on the skin of frogs in response to VIE marking, although it is not clear if this con-tinued beyond the end of the study or whether the bacterial communities had undergone a proliferation between the post-marking and end-of-study time points, and the results seen at the end of the study were the microbial communities returning to normal. However, no obvious skin infections were observed in frogs for 2 weeks after the study had finished.
The cause of the delayed greater abundance of microbes (although minor) on the skin of marked frogs is unclear. The VIE tags were unlikely to be completely sterile due to the preparation methods, and the greater abundance of microbes may reflect a minor infection from the tags. Alternatively, it is possible that the act of marking caused a disruption in the dynamics of the bacterial communities that may have had delayed effects for the microbial community or elicited a physiological response in the frogs. For example, studies in rats and humans have shown increases in immunoglobulins, lymphocytes and macrophages in response to injection of silicone (as contained in VIE tags; Smalley et al., 1995; Hill
et al., 1996). The implications of the greater microbial
abun-dance is not known, and it would be of interest to investigate the susceptibility of amphibians to B. dendrobatidis after tag-ging with VIE and other marking systems. Moreover, cultur-ing methods are known to underestimate microbial diversity greatly (reviewed by Amann et al., 1995), and molecular techniques (e.g. next-generation sequencing) are required to characterize the community more fully and determine whether VIE marking and other techniques affect the non-culturable portion of the microbiome.
The results presented here are in contrast to the results found by Antwis et al. (2014a), which demonstrated a major and rapid proliferation in culturable bacteria on the skin of
A. moreletii 1 day after marking with PIT tags. The needle
used for VIE tagging is much narrower (30 gauge or 0.31 mm outer diameter) than for PIT tagging (18 gauge or 1.27 mm), and the ‘foreign body’ inserted under the skin is much smaller; therefore, frogs undergoing PIT tagging may experi-ence greater adrenal activity than those that are VIE tagged, leading to differences in the responses of the microbial com-munity (Simmaco et al., 1997, 1998; Antwis et al., 2014a). However, definitive conclusions are difficult to draw because the two studies were conducted on different Agalychnis
species and the restraint time was slightly longer during PIT tagging than VIE marking (~1 minute and 30 s, respectively).
There were no changes in the quantity of peptides released by frogs throughout the study period for either treatment group, indicating that VIE marking has no effect on avail-ability or release of peptide stores of A. callidryas. This result is expected given that VIE marking also had no effect of fae-cal glucocorticoid metabolite concentrations, which have the potential to inhibit the production of new peptides for stor-age (Simmaco et al., 1997, 1998). To our knowledge, this is the first study to quantify the effects of a marking technique on the production of peptides by amphibians, and further research into the effects of other marking techniques (partic-ularly PIT tagging) on peptide production and release is required.
Overall, we have shown that there is no effect of VIE marking on adrenal response (represented by faecal gluco-corticoid metabolite concentrations) or peptide release of
A. callidryas, although there was evidence of a minor increase
in microbial abundance on the skin. This indicates that VIE may be a preferable marking technique to PIT tagging (which causes a rapid and major proliferation of skin microbes), par-ticularly in the context of probiotic trials or time course stud-ies that investigate symbiotic bacterial communitstud-ies. Although more work is required to determine differences between host species in response to different marking tech-niques, as well as the effects of marking on the susceptibility of amphibians to disease, these results together with those of
Antwis et al. (2014a) indicate that captive amphibians should not be released immediately after marking, and that where possible, probiotic treatments should not be applied to indi-viduals less than 3 or 4 weeks after marking. Moreover, marking of wild amphibians should be carefully considered.
Supplementary material
Supplementary material is available at Conservation
Physiology online.
Acknowledgements
The authors would like to thank Jade Newton-Youens, Christopher Michaels and Nadia Jogee for assistance with laboratory work.
Funding
This work was supported by a Biotechnology and Biological Sciences Research Council (BBSRC) PhD studentship to R.E.A.
References
Amann RI, Ludwig W, Schleifer KH (1995) Phylogenetic identification and in situ detection of individual microbial cells without cultiva-tion. Microbiol Rev 59: 143–169.
by guest on October 8, 2014
http://conphys.oxfordjournals.org/
Research article Conservation Physiology • Volume 2 2014
Antwis RE, Garcia G, Fidgett AL, Preziosi RF (2014a) Passive integrated transponder (PIT) tagging frogs causes disruption to the cutaneous bacterial community and proliferation of opportunistic fungi. Appl Environ Microbiol 80: 4779–4784.
Antwis RE, Haworth RL, Engelmoer DJP, Ogilvy V, Fidgett AL, Preziosi RF (2014b) Ex situ diet influences the bacterial community associated with the skin of red-eyed tree frogs (Agalychnis callidryas). PLoS ONE 9: e85563.
Bamberg E, Palme R, Meingassner G (2001) Excretion of corticosteroid metabolites in urine and faeces of rats. Lab Anim 35: 307–314.
Banning JL, Weddle AL, Wahl GW 3rd, Simon MA, Lauer A, Walters RL, Harris RN (2008) Antifungal skin bacteria, embryonic survival, and communal nesting in four-toed salamanders, Hemidactylium scuta-tum. Oecologia 156: 423–429.
Bletz MC, Loudon AH, Becker MH, Bell SC, Woodhams DC, Minbiole KP, Harris RN (2013) Mitigating amphibian chytridiomycosis with bio-augmentation: characteristics of effective probiotics and strategies for their selection and use. Ecol Lett 16: 807–820.
Boman HG (2000) Innate immunity and the normal microflora. Immunol Rev 173: 5–16.
Brucker RM, Harris RN, Schwantes CR, Gallaher TN, Flaherty DC, Lam BA, Minbiole KP (2008) Amphibian chemical defense: antifungal metab-olites of the microsymbiont Janthinobacterium lividum on the sala-mander Plethodon cinereus. J Chem Ecol 34: 1422–1429.
Cikanek SJ, Nockold S, Brown JL, Carpenter JW, Estrada A, Guerrel J, Hope K, Ibáñez R, Putman SB, Gratwicke B (2014) Evaluating group housing strategies for the ex-situ conservation of harlequin frogs (Atelopus spp.) using behavioral and physiological indicators. PLoS ONE 9: e90218.
Conlon JM (2011) The contribution of skin antimicrobial peptides to the system of innate immunity in anurans. Cell Tissue Res 343: 201–212.
Conlon JM, Mechkarska M, Ahmed E, Coquet L, Jouenne T, Leprince J, Vaudry H, Hayes MP, Padgett-Flohr G (2011) Host defense peptides in skin secretions of the Oregon spotted frog Rana pretiosa: implica-tions for species resistance to chytridiomycosis. Dev Comp Immunol 35: 644–649.
Culp CE, Falkinham JO 3rd, Belden LK (2007) Identification of the natural bacterial microflora on the skin of Eastern newts, bullfrog tadpoles and redback salamanders. Herpetologica 63: 66–71.
Delfino G, Drewes RC, Magherini S, Malentacchi C, Nosi D, Terreni A (2006) Serous cutaneous glands of the Pacific tree-frog Hyla regilla (Anura, Hylidae): patterns of secretory release induced by nor- epinephrine. Tissue Cell 38: 65–77.
Evans N, Narayan EJ, Hero JM (2013) Effects of natural weathering con-ditions on faecal cortisol metabolite measurements in the greater bilby (Macrotis lagotis). Aust J Zool 61: 351–356.
Flechas SV, Sarmiento C, Cárdenas ME, Medina EM, Restrepo S, Amézquita A (2012) Surviving chytridiomycosis: differential anti-Batrachochytrium dendrobatidis activity in bacterial isolates from three lowland species of Atelopus. PLoS One 7: e44832.
Graham CM, Narayan EJ, McCallum H, Hero JM (2013) Non-invasive monitoring of glucocorticoid physiology within highland and low-land populations of native Australian Great Barred Frog (Mixophyes fasciolatus). Gen Comp Endocrinol 191: 24–30.
Gray MJ, Miller DL, Hoverman JT (2009) Ecology and pathology of amphibian ranaviruses. Dis Aquat Org 87: 243–266.
Harris RN, James TY, Lauer A, Simon MA, Patel A (2006) Amphibian pathogen Batrachochytrium dendrobatidis is inhibited by the cuta-neous bacteria of amphibian species. EcoHealth 3: 53–56.
Hill SL, Landavere MG, Rose NR (1996) The adjuvant effect of silicone gel and silicone elastomer particles in rats. Curr Top Microbiol Immunol 210: 123–137.
Kilpatrick AM, Briggs CJ, Daszak P (2010) The ecology and impact of chy-tridiomycosis: an emerging disease of amphibians. Trends Ecol Evol 25: 109–118.
Kinkead KE, Drew Lanham J, Montanucci RR (2006) Comparison of anes-thesia and marking techniques on stress and behavioral responses in two Desmognathus salamanders. J Herpetol 40: 323–328.
Küng D, Bigler L, Davis LR, Gratwicke B, Griffith E, Woodhams DC (2014) Stability of microbiota facilitated by host immune regulation: informing probiotic strategies to manage amphibian disease. PLoS One 9: e87101.
Lauer A, Simon MA, Banning JL, André E, Duncan K, Harris RN (2007) Common cutaneous bacteria from the eastern red-backed salaman-der can inhibit pathogenic fungi. Copeia 3: 630–640.
Loudon AH, Woodhams DC, Parfrey LW, Archer H, Knight R, McKenzie V, Harris RN (2013) Microbial community dynamics and effect of environ-mental microbial reservoirs on red-backed salamanders (Plethodon cinereus). ISME J 8: 830–840.
Martínez-Mota R, Valdespino C, Rebolledo JAR, Palme R (2008) Determination of fecal glucocorticoid metabolites to evaluate stress response in Alouatta pigra. Int J Primatol 29: 1365–1373.
Michaels CJ, Antwis RE, Preziosi RF (2014) Impact of plant cover on fit-ness and behavioural traits of captive red-eyed tree frogs (Agalychnis callidryas). PLoS ONE 9: e95207.
Munro C, Stabenfeldt G (1984) Development of a microtitre plate enzyme immunoassay for the determination of progesterone. J Endocrinol 101: 41–49.
Narayan EJ, Cockrem JF, Hero JM (2011a) Urinary corticosterone metab-olite responses to capture and captivity in the cane toad (Rhinella marina). Gen Comp Endocrinol 173: 371–377.
Narayan EJ, Molinia FC, Kindermann C, Cockrem JF, Hero JM (2011b) Urinary corticosterone responses to capture and toe-clipping in the cane toad (Rhinella marina) indicate that toe-clipping is a stressor for amphibians. Gen Comp Endocrinol 174: 238–245.
Narayan EJ, Cockrem JF, Hero JM (2012a) Urinary corticosterone metab-olite responses to capture and handling in two closely related spe-cies of free-living Fijian frogs. Gen Comp Endocrinol 177: 55–61.
Narayan EJ, Hero JM, Cockrem JF (2012b) Inverse urinary corticosterone and testosterone metabolite responses to different durations of
8
by guest on October 8, 2014
http://conphys.oxfordjournals.org/
restraint in the cane toad (Rhinella marina). Gen Comp Endocrinol 179: 345–349.
Narayan EJ, Cockrem J, Hero JM (2013) Changes in serum and urinary corticosterone and testosterone during short-term capture and handling in the cane toad (Rhinella marina). Gen Comp Endocrinol 191: 225–230.
Pask J, Woodhams DC, Rollins-Smith LA (2012) The ebb and flow of antimicrobial skin peptides defends northern leopard frogs, Rana pipiens, against chytridiomycosis. Glob Change Biol 18: 1231–1238.
Phillips CT, Fries JN (2009) An evaluation of visible implant elastomer for marking the federally listed fountain darter and the San Marcos sal-amander. N Am J Fish Manage 29: 529–532.
Rollins-Smith LA (2001) Neuroendocrine-immune system interactions in amphibians. Immunol Res 23: 273–280.
Rollins-Smith LA, Conlon JM (2005) Antimicrobial peptide defenses against chytridiomycosis, an emerging infectious disease of amphibian populations. Dev Comp Immunol 29: 589–598.
Rollins-Smith LA, Carey C, Longcore J, Doersam JK, Boutte A, Bruzgal JE, Conlon JM (2002) Activity of antimicrobial skin peptides from ranid frogs against Batrachochytrium dendrobatidis, the chytrid fungus associated with global amphibian declines. Dev Comp Immunol 26: 471–479.
Rollins-Smith LA, Reinert LK, O’Leary CJ, Houston LE, Woodhams DC (2005) Antimicrobial peptide defenses in amphibian skin. Integr Comp Biol 45: 137–142.
Rollins-Smith LA, Ramsey JP, Pask JD, Reinert LK, Woodhams DC (2011) Amphibian immune defenses against chytridio mycosis: impacts of changing environments. Integr Comp Biol 51: 552–562.
Roth T, Foley J, Worth J, Piovia-Scott J, Pope K, Lawler S (2013) Bacterial flora on Cascades frogs in the Klamath mountains of California. Comp Immunol Microbiol Infect Dis 36: 591–598.
Santymire RM, Freeman EW, Lonsdorf EV, Heintz MR, Armstrong DM (2012) Using ACTH challenges to validate techniques for adrenocor-tical activity analysis in various African wildlife species. Int J Anim Vet Adv 4: 99–108.
Sapsford SJ, Roznik EA, Alford RA, Schwarzkopf L (2014) Visible implant elastomer marking does not affect short-term move-ments or survival rates of the treefrog Litoria rheocola. Herpetologica 70: 23–33.
Schmidt K, Schwarzkopf L (2010) Visible implant elastomer tagging and toe-clipping: effects of marking on locomotor performance of frogs and skinks. Herpetol J 20: 99–105.
Sheafor B, Davidson EW, Parr L, Rollins-Smith L (2008) Antimicrobial peptide defenses in the salamander, Ambystoma tigrinum, against emerging amphibian pathogens. J Wildl Dis 44: 226–236.
Simmaco M, Boman A, Mangoni ML, Mignogna G, Miele R, Barra D, Boman HG (1997) Effect of glucocorticoids on the synthesis of anti-microbial peptides in amphibian skin. FEBS Lett 416: 273–275.
Simmaco M, Mangoni ML, Boman A, Barra D, Boman HG (1998) Experimental infections of Rana esculenta with Aeromonas hydroph-ila: a molecular mechanism for the control of the normal flora. Scand J Immunol 48: 357–363.
Smalley DL, Shanklin DR, Hall MF, Stevens MV, Hanissian A (1995) Immunologic stimulation of T lymphocytes by silica after use of sili-cone mammary implants. FASEB J 9: 424–427.
Smith JE, Monclús R, Wantuck D, Florant GL, Blumstein DT (2012) Fecal glucocorticoid metabolites in wild yellow-bellied marmots: experi-mental validation, individual differences and ecological correlates. Gen Comp Endocrinol 178: 417–426.
Walker SL, Waddell WT, Goodrowe KL (2002) Reproductive endocrine patterns in captive female and male red wolves (Canis rufus) assessed by fecal and serum hormone analysis. Zoo Biol 21: 321–335.
Washburn BE, Millspaugh JJ (2002) Effects of simulated environmental conditions on glucocorticoid metabolite measurements in white-tailed deer feces. Gen Comp Endocrinol 127: 217–222.
Wasser SK, Hunt KE, Brown JL, Cooper K, Crockett CM, Bechert U, Millspaugh JJ, Larson S, Monfort SL (2000) A generalized fecal gluco-corticoid assay for use in a diverse array of nondomestic mammalian and avian species. Gen Comp Endocrinol 120: 260–275.
Watson R, Munro CJ, Edwards KL, Norton V, Brown JL, Walker SL (2013) Development of a versatile enzyme immunoassay for non-invasive assessment of glucocorticoid metabolites in a diversity of taxo-nomic species. Gen Comp Endocrinol 186: 16–24.
Woodhams DC, Voyles J, Lips KR, Carey C, Rollins-Smith LA (2006) Predicted disease susceptibility in a Panamanian amphibian assem-blage based on skin peptide defenses. J Wildl Dis 42: 207–218.
Woodley SK, Lacy EL (2010) An acute stressor alters steroid hormone lev-els and activity but not sexual behavior in male and female Ocoee salamanders (Desmognathus ocoee). Horm Behav 58: 427–432.
by guest on October 8, 2014
http://conphys.oxfordjournals.org/