R E S E A R C H
Open Access
Prognostic consequences of borderline
dysnatremia: pay attention to minimal serum
sodium change
Michael Darmon
1*, Eric Diconne
1, Bertrand Souweine
2, Stéphane Ruckly
3,4, Christophe Adrie
5, Elie Azoulay
6,
Christophe Clec
’
h
7, Maïté Garrouste-Orgeas
8, Carole Schwebel
4, Dany Goldgran-Toledano
9, Hatem Khallel
10,
Anne-Sylvie Dumenil
11, Samir Jamali
12, Christine Cheval
13, Bernard Allaouchiche
14, Fabrice Zeni
1and
Jean-François Timsit
3,4Abstract
Introduction:To assess the prevalence of dysnatremia, including borderline changes in serum sodium concentration, and to estimate the impact of these dysnatremia on mortality after adjustment for confounders. Methods:Observational study on a prospective database fed by 13 intensive care units (ICUs). Unselected patients with ICU stay longer than 48 h were enrolled over a 14-year period were included in this study. Mild to severe hyponatremia were defined as serum sodium concentration < 135, < 130, and < 125 mmol/L respectively. Mild to severe hypernatremia were defined as serum sodium concentration > 145, > 150, and > 155 mmol/L respectively. Borderline hyponatremia and hypernatremia were defined as serum sodium concentration between 135 and 137 mmol/L or 143 and 145 respectively.
Results:A total of 11,125 patients were included in this study. Among these patients, 3,047 (27.4%) had mild to severe hyponatremia at ICU admission, 2,258 (20.3%) had borderline hyponatremia at ICU admission, 1,078 (9.7%) had borderline hypernatremia and 877 (7.9%) had mild to severe hypernatremia. After adjustment for confounder, both moderate and severe hyponatremia (subdistribution hazard ratio (sHR) 1.82, 95% CI 1.002 to 1.395 and 1.27, 95% CI 1.01 to 1.60 respectively) were associated with day-30 mortality. Similarly, mild, moderate and severe hypernatremia (sHR 1.34, 95% CI 1.14 to 1.57; 1.51, 95% CI 1.15 to 1.99; and 2.64, 95% CI 2.00 to 3.81 respectively) were independently associated with day-30 mortality.
Conclusions:One-third of critically ill patients had a mild to moderate dysnatremia at ICU admission. Dysnatremia, including mild changes in serum sodium concentration, is an independent risk factor for hospital mortality and should not be neglected.
Introduction
Dysnatremia is a common finding at ICU admission [1-3]. Abnormal serum sodium concentrations are known to adversely affect physiologic function and an increasing body of evidence suggests that dysnatremia may be associated with adverse outcome [1-4]. Critically ill patients are particularly exposed to dysnatremia due
to the nature of the disease leading to ICU admission and to lack of free access to water [2,4,5]. Up to one-third of critically ill patients have a dysnatremia at ICU admission [2]. In addition, another one-third of critically ill patients will develop an ICU-acquired dysnatremia during ICU stay [4,6]. Prevalence of dysnatremia at ICU admission, however, varies greatly according to the cho-sen definition [1,2,7,8].
Doubts exist regarding prognostic impact of borderline changes in serum sodium concentration. Serum sodium concentration is closely regulated and physiological serum sodium concentration ranges between 138 and * Correspondence: [email protected]
1Medical ICU, Saint-Etienne University Hospital, Avenue Albert Raymond,
42270, Saint-Priest-en-Jarez, France; Jacques Lisfranc Faculty of Medicine, Jean Monnet University, 15 Rue Ambroise Paré, 42023, Saint-Etienne, France Full list of author information is available at the end of the article
142 mmol per liter [9] whereas abnormal serum concen-tration are usually defined as serum sodium lower than 135 or higher than 145 mmol per liter [2]. Most of the studies performed to date chose to focus on severe dys-natremia [1,5,7,10]. Recently, Funk and colleagues demonstrated influence of dysnatremia at ICU admission to be independently associated with outcome [2]. In this study, mild dysnatremia was independently associated with a poor outcome [2]. In addition, the association between serum sodium concentration and prognosis fol-lowed a U shape [2]. According to this observation, we hypothesized that borderline and mild changes in serum sodium concentration, lower than changes that usually alert physicians, should be taken into account.
The objective of this study was to assess the preva-lence of dysnatremia, including borderline changes in serum sodium concentration in a large multicenter cohort of patients and to confirm the association of mild or moderate abnormal serum sodium concentra-tion with mortality.
Materials and methods Study design and data source
We conducted a retrospective study on a prospective multicenter database (OutcomeRea™) to assess the epi-demiological characteristics and prognostic impact of dysnatremia. This study was approved by our institu-tional review board (CECIC Clermont-Ferrand - IRB number 5891; Ref: 2007-16) according to the French reg-ulation on non-interventional studies which waived the need for signed informed consent for patients included in this database. Patients and patients’next of kin were, however, consulted for their willingness to decline parti-cipation to this database, and none refused to participate. The database, fed by 13 French ICUs, collects prospective data on daily disease severity, iatrogenic events, and nosocomial infections. Each year, each ICU includes a random sample of at least 50 patients who have ICU stays longer than 24 h. Each ICU could choose to obtain the random sample by taking either consecutive admis-sions to selected ICU beds throughout the year or conse-cutive admissions to all ICU beds for 1 month.
Study population and definitions
We included consecutive patients who met the following criteria: age older than 18 years, entry in the database between January 1997 and April 2011. Patients without serum sodium measurement at ICU admission or with ICU stay of less than 48 h were secondarily excluded from the study.
Serum sodium concentration is reported at ICU admission.
We defined normal serum sodium concentration as a serum sodium level between 138 and 142 mmol/L [9].
Borderline dysnatremia were defined as serum sodium concentration between 135 and 137 mmol/L and between 143 and 145 mmol/L for borderline hyponatre-mia and for borderline hypernatrehyponatre-mia respectively.
Hyponatremia were defined as serum sodium concen-tration < 135 and≥130, < 130 and≥125 or < 125 for mild, moderate and severe hyponatremia respectively [6].
Hypernatremia were defined as serum sodium concen-tration > 145 and≤150, > 150 and≤155 or > 155 for mild, moderate and severe hypernatremia respectively [6].
Data collection
Data were collected daily by senior physicians and/or specifically trained study monitors in the participating ICUs. For each patient, the investigators entered the data into a computer case-report form using data-capture
software (RHEA; OutcomeRea™, France) and imported
all records into the OutcomeRea™database. All codes
and definitions were established prior to study initiation. The data quality checking procedure has been already described elsewhere [11]. The following information was recorded: age and sex, admission category (medical, scheduled surgery, or unscheduled surgery), origin (home, ward, or emergency department). Severity of ill-ness was evaluated on the first ICU day using the Simpli-fied Acute Physiology Score (SAPS) II, Sequential Organ Failure Assessment (SOFA) score and the Logistic Organ Dysfunction (LOD) score [12-14]. Knaus scale definitions were used to record preexisting chronic organ failures including respiratory, cardiac, hepatic, renal, and immune system failure [15].
Quality of the database
For most of the study variables, the data-capture software immediately ran an automatic check for internal consis-tency, generating queries that were sent to the ICUs for resolution before incorporation of the new data into the database. In each participating ICU, data quality was checked by having a senior physician from another parti-cipating ICU review a 2% random sample of the study data every other year. A 1-day data-capture training course held once a year was open to all the Outco-meRea™investigators and study monitors. All qualitative variables used in the analyses hadcoefficients > 0.8 and all variables had inter-rater coefficients in the 0.67 to 1 range, indicating good to excellent reproducibility.
Statistical analysis
Values of categorical variables are reported as numbers (%) and values of continuous variables as medians (inter-quartile range, IQR). The chi-square test was used for categorical data and the Wilcoxon test for continuous data. Potential risk factors for dysnatremia were entered in a Fine and Gray extension of a Cox model. Then, we
Darmonet al.Critical Care2013,17:R12 http://ccforum.com/content/17/1/R12
used the Fine and Gray subdistribution hazard regres-sion model [16], with day-30 mortality as the variable of interest. Discharge alive from the ICU was handled as a competing event. Subdistribution hazard ratios (sHR) and 95% confidence intervals (95% CI) were calculated.
P values < 0.05 were considered significant. Analyses were performed using SAS 9.1 software (SAS Institute; Cary, NC, USA).
Results
Study population
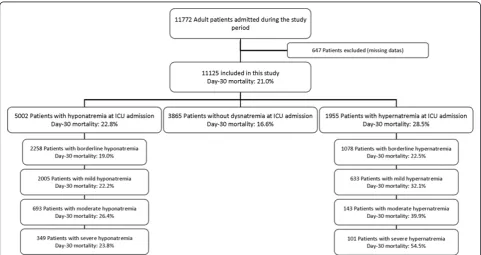
Of the 11,772 patients with ICU stays longer than 48 h who were entered into the database during the study period, 647 (5.5%) were excluded because of missing data (Figure 1). A total of 11,125 patients were included in this study. Some 3,047 (27.38%) had mild to severe hyponatremia at ICU admission, 2,258 (20.30%) had borderline hyponatremia at ICU admission, 1,078 (9.69%) had borderline hypernatremia and 877 (7.88%) had mild to severe hypernatremia (Figure 1). Among patients with mild to severe hyponatremia, 2,005 (18.02% of overall population) had mild hyponatremia, 693 (6.23% of overall population) had moderate hypona-tremia, and 349 (3.14% of overall population) had severe hyponatremia. Among patients with mild to severe hypernatremia, 633 (5.69% of overall population) had mild hypernatremia, 143 (1.29% of overall population) had moderate hypernatremia, and 101 (0.91%) had severe hypernatremia (Figure 1 and Additional file 1,
Figure S1). Serum sodium value at ICU admission is reported in Figure 2.
Characteristics of patients
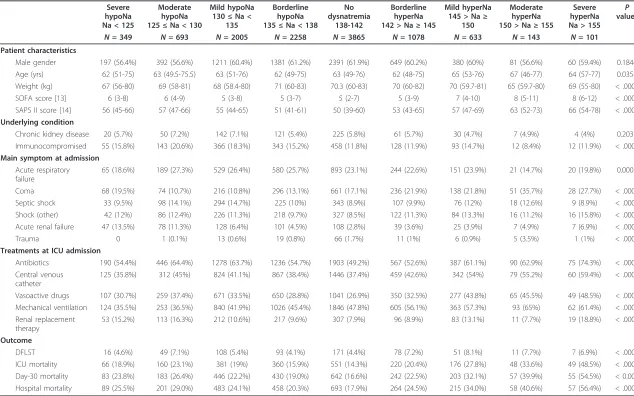
Characteristics of patients at ICU admission are reported in Table 1. Overall, patients with dysnatremia were older, less frequently of male gender, had a higher body weight at ICU admission, a greater disease severity as assessed by SAPS II, SOFA score, organ failure at ICU admission or need for supportive therapy. In addi-tion, patients with dysnatremia had more frequently underlying chronic illnesses.
Outcome of patients with hypernatremia at ICU admission
[image:3.595.57.539.457.712.2]Before adjustment, mortality at day 30 was 21.0% in the overall population of patients. Crude hospital mortality was increased in patients with borderline to severe hypernatremia and in patients with borderline to severe hyponatremia (Figure 1 and 3). Day-30 mortality was of 16.6% in patients without dysnatremia at ICU admission, 19.0% in patients with borderline hyponatremia, 22.2% in patients with mild hyponatremia, 26.4% in patients with moderate hyponatremia and 23.8% in patients with severe hyponatremia (Table 1 and Figure 3). Day-30 mortality was 22.5% in patients with borderline hyperna-tremia, 32.1% in patients with mild hypernahyperna-tremia, 39.9% in patients with moderate hypernatremia and 54.5% in patients with severe hypernatremia. Cumulated
incidence of mortality according to serum sodium con-centration at ICU admission is reported in Additional file 1, Figure S2a (hyponatremia) and Additional file 1, Figure S2b (hypernatremia). Relationship between serum sodium concentration and day-30 mortality is reported in Additional file 1, Figure S3.
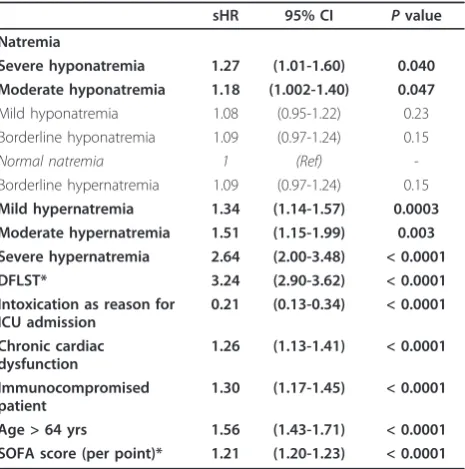
When entered into a Fine and Gray model (Table 2), moderate to severe hyponatremia (sHR 1.82, 95% CI 1.002 to 1.395 and sHR 1.27, 95% CI 1.01 to 1.60 for moderate and severe hyponatremia respectively) and mild to severe hypernatremia (sHR 1.34, 95% CI 1.14 to 1.57; sHR 1.51, 95% CI 1.15 to 1.99; and sHR 2.64, 95% CI 2.00 to 3.81 for mild, moderate and severe hypernatremia respectively) remained independently associated with day-30 mortality. Borderline hyponatremia (sHR 1.09, 95% CI 0.97 to 1.23;P = 0.15) and borderline hypernatremia (sHR 1.14, 95% CI 0.99 to 1.33;P= 0.08) were not associated with day-30 mortality after adjustment for confounders. Figure 3 reports adjusted association between different class of dysnatremia and day-30 mortality before and after adjustment.
Discussion
This large multicenter cohort study, focusing specifically on dysnatremia at ICU admission, demonstrates that this electrolyte disorder is common and is an indepen-dent risk factor for ICU mortality. This study confirms that mild hypernatremia and moderate hyponatremia (that is serum sodium concentration < 130 mmol/L or > 145 mmol/L respectively) are independently associated with poor outcome.
In this study, one-third of critically ill patients had a moderate to severe dysnatremia at ICU. Mild to severe hypernatremia and hyponatremia were present in respec-tively 7.8% and 27.4% of the admitted patients. Hypona-tremia is the most common electrolyte disorder in hospitalized patients. Up to 40% of the overall population of hospitalized patients has a hyponatremia at admission [17]. Presence of severe hyponatremia on hospital admis-sion has been demonstrated to be independently asso-ciated with an increased risk for ICU admission and poor prognosis [18]. Hyponatremia may be due to chronic organ dysfunctions (that is heart failure or liver dysfunc-tion) but also to diuretic use, syndrome of inappropriate antidiuretic hormone (ADH) secretion, adrenal insuffi-ciency, and cerebral or renal salt wasting syndromes [9,19]. Each of these conditions is frequently encountered in critically ill patients and may explain the high preva-lence of hyponatremia at ICU admission. Similarly, although less frequent than hyponatremia, several studies demonstrated hypernatremia to be common at ICU admission [4-7]. Since thirst and free access to water are the most important mechanisms that prevent hypernatre-mia, critically ill patients and older patients are at high risk for this disorder [4,19]. Only 2.5% patients have been found to develop moderate to severe hypernatremia in the general in-hospital population of patients. Higher prevalence has been reported in geriatric or critically ill patients [20-23].
[image:4.595.58.544.90.329.2]In keeping with previous findings, our study demon-strates a close association between dysnatremia and hospi-tal morhospi-tality [1-3,8,13,24]. After adjustment for patients’
Figure 2Natremia distribution at ICU admission.
Darmonet al.Critical Care2013,17:R12 http://ccforum.com/content/17/1/R12
Severe hypoNa Na < 125
Moderate hypoNa 125≤Na < 130
Mild hypoNa 130≤Na <
135
Borderline hypoNa 135≤Na < 138
No dysnatremia
138-142
Borderline hyperNa 142 > Na≥145
Mild hyperNa 145 > Na≥
150
Moderate hyperNa 150 > Na≥155
Severe hyperNa Na > 155
P
value*
N= 349 N= 693 N= 2005 N= 2258 N= 3865 N= 1078 N= 633 N= 143 N= 101
Patient characteristics
Male gender 197 (56.4%) 392 (56.6%) 1211 (60.4%) 1381 (61.2%) 2391 (61.9%) 649 (60.2%) 380 (60%) 81 (56.6%) 60 (59.4%) 0.1846
Age (yrs) 62 (51-75) 63 (49.5-75.5) 63 (51-76) 62 (49-75) 63 (49-76) 62 (48-75) 65 (53-76) 67 (46-77) 64 (57-77) 0.0358
Weight (kg) 67 (56-80) 69 (58-81) 68 (58.4-80) 71 (60-83) 70.3 (60-83) 70 (60-82) 70 (59.7-81) 65 (59.7-80) 69 (55-80) < .0001
SOFA score [13] 6 (3-8) 6 (4-9) 5 (3-8) 5 (3-7) 5 (2-7) 5 (3-9) 7 (4-10) 8 (5-11) 8 (6-12) < .0001
SAPS II score [14] 56 (45-66) 57 (47-66) 55 (44-65) 51 (41-61) 50 (39-60) 53 (43-65) 57 (47-69) 63 (52-73) 66 (54-78) < .0001
Underlying condition
Chronic kidney disease 20 (5.7%) 50 (7.2%) 142 (7.1%) 121 (5.4%) 225 (5.8%) 61 (5.7%) 30 (4.7%) 7 (4.9%) 4 (4%) 0.2031
Immunocompromised 55 (15.8%) 143 (20.6%) 366 (18.3%) 343 (15.2%) 458 (11.8%) 128 (11.9%) 93 (14.7%) 12 (8.4%) 12 (11.9%) < .0001
Main symptom at admission
Acute respiratory failure
65 (18.6%) 189 (27.3%) 529 (26.4%) 580 (25.7%) 893 (23.1%) 244 (22.6%) 151 (23.9%) 21 (14.7%) 20 (19.8%) 0.0003
Coma 68 (19.5%) 74 (10.7%) 216 (10.8%) 296 (13.1%) 661 (17.1%) 236 (21.9%) 138 (21.8%) 51 (35.7%) 28 (27.7%) < .0001
Septic shock 33 (9.5%) 98 (14.1%) 294 (14.7%) 225 (10%) 343 (8.9%) 107 (9.9%) 76 (12%) 18 (12.6%) 9 (8.9%) < .0001
Shock (other) 42 (12%) 86 (12.4%) 226 (11.3%) 218 (9.7%) 327 (8.5%) 122 (11.3%) 84 (13.3%) 16 (11.2%) 16 (15.8%) < .0001
Acute renal failure 47 (13.5%) 78 (11.3%) 128 (6.4%) 101 (4.5%) 108 (2.8%) 39 (3.6%) 25 (3.9%) 7 (4.9%) 7 (6.9%) < .0001
Trauma 0 1 (0.1%) 13 (0.6%) 19 (0.8%) 66 (1.7%) 11 (1%) 6 (0.9%) 5 (3.5%) 1 (1%) < .0001
Treatments at ICU admission
Antibiotics 190 (54.4%) 446 (64.4%) 1278 (63.7%) 1236 (54.7%) 1903 (49.2%) 567 (52.6%) 387 (61.1%) 90 (62.9%) 75 (74.3%) < .0001
Central venous catheter
125 (35.8%) 312 (45%) 824 (41.1%) 867 (38.4%) 1446 (37.4%) 459 (42.6%) 342 (54%) 79 (55.2%) 60 (59.4%) < .0001
Vasoactive drugs 107 (30.7%) 259 (37.4%) 671 (33.5%) 650 (28.8%) 1041 (26.9%) 350 (32.5%) 277 (43.8%) 65 (45.5%) 49 (48.5%) < .0001
Mechanical ventilation 124 (35.5%) 253 (36.5%) 840 (41.9%) 1026 (45.4%) 1846 (47.8%) 605 (56.1%) 363 (57.3%) 93 (65%) 62 (61.4%) < .0001
Renal replacement therapy
53 (15.2%) 113 (16.3%) 212 (10.6%) 217 (9.6%) 307 (7.9%) 96 (8.9%) 83 (13.1%) 11 (7.7%) 19 (18.8%) < .0001
Outcome
DFLST 16 (4.6%) 49 (7.1%) 108 (5.4%) 93 (4.1%) 171 (4.4%) 78 (7.2%) 51 (8.1%) 11 (7.7%) 7 (6.9%) < .0001
ICU mortality 66 (18.9%) 160 (23.1%) 381 (19%) 360 (15.9%) 551 (14.3%) 220 (20.4%) 176 (27.8%) 48 (33.6%) 49 (48.5%) < .0001
Day-30 mortality 83 (23.8%) 183 (26.4%) 446 (22.2%) 430 (19.0%) 642 (16.6%) 242 (22.5%) 203 (32.1%) 57 (39.9%) 55 (54.5%) < 0.001
Hospital mortality 89 (25.5%) 201 (29.0%) 483 (24.1%) 458 (20.3%) 693 (17.9%) 264 (24.5%) 215 (34.0%) 58 (40.6%) 57 (56.4%) < .0001
*Comparison across different subclasses of serum sodium concentration at ICU admission. The data are reported as medians (IQR). SOFA, Sequential Organ Failure Assessment, which can range from 0 to 24; SAPS II, Simplified Acute Physiology Score version II, which can range from 0 to 155; DFLST, decision to forgo life-sustaining treatments.
Critical
Care
2013,
17
:R12
tent/17/1/R1
2
Page
5
of
[image:5.794.65.699.96.492.2]severity, increasing degree of dysnatremia was associated with increasing prognostic impact. Interestingly, our study demonstrates that mild to severe hypernatremia and mod-erate to severe hyponatremia are independently associated with outcome. Earlier studies reported an association between dysnatremia and hospital mortality [1-3,10]. However, most of these studies evaluated the more severe patients [1-3,10]. Recent studies suggested mild to moder-ate changes in serum sodium concentration to be asso-ciated with prognosis [2,24]. In our study, after adjustment for comorbidities, case mix, or patients’severity, even mild hypernatremia and moderate hyponatremia were indepen-dently associated with poor outcome. Hypernatremia has multiple adverse effects that may explain this association. Hypernatremia has been shown to be associated wit per-ipheral insulin resistance, impaired hepatic lactate clear-ance, decreased left ventricular contractility or various neuromuscular manifestations ranging from muscle weak-ness to delayed weaning from mechanical ventilation [25-28]. Similarly, hyponatremia may be associated with dismal neurological manifestations although occurring in
profound hyponatremia [9,19]. Our study, however, was not designed to evaluate these consequences and no caus-ality relationship can be drawn from this association. Last, our study was unable to demonstrate an association between outcome and borderline changes in natremia or mild hyponatremia. Nevertheless, progressive association between serum sodium changes and hospital mortality suggest that we should pay attention to mild abnormal serum sodium concentration.
[image:6.595.58.539.88.435.2]Our study has several limitations. First, our study design did not allow us to evaluate the causes of dysna-tremia. No data regarding fluid balance or diuretic ther-apy before ICU admission were available. In addition, as previously stated, our study was not designed to evaluate factors leading to this association. Although a causal role for dysnatremia in death is biologically plausible, we can-not determine from our data whether the association between dysnatremia and mortality reflected a direct effect of dysnatremia, a surrogate marker for underlying comorbidities or reason for ICU admission, or both. Further studies evaluating the influence of dysnatremia
Figure 3Relationship between hospital admission serum sodium concentrations and day-30 mortality. Subdistribution hazard ratio (sHR) and 95% confidence interval (95% CI) are represented before (light grey) and after adjustment for confounders (dark).
Darmonet al.Critical Care2013,17:R12 http://ccforum.com/content/17/1/R12
correction on prognosis or the influence of therapeutic intervention in patients with mild to moderate dysnatre-mia may help in answering this clinical question.
Conclusions
Our results confirm the high prevalence of dysnatremia at ICU admission and demonstrate that even mild to moderate abnormal serum sodium concentrations are independent risk factors for ICU mortality. Although we must acknowledge that dysnatremia may be a surrogate for patients’severity, treatment or case mix, we believe that mild abnormal serum sodium concentration should not be neglected. Further studies are needed to under-stand factors leading to this prognostic association and the potential benefit from therapeutic strategies aiming at this metabolic disturbance.
Key messages
• Dysnatremia is common at ICU admission. Mild to
severe hypernatremia and hyponatremia were present in respectively 7.8% and 27.4% of the critically ill patients.
•Dysnatremia is independently associated with ICU
mortality. In our study, mild hypernatremia (that is serum sodium concentration > 145 mmol/L) and mod-erate hyponatremia (that is serum sodium concentration < 130 mmol/L) are independently associated with poor outcome (respective sHR of 1.34 (95% CI 1.14 to 1.57) and 1.18 (95% CI 1.002 to 1.40)).
•Although a causal role for dysnatremia in death is biologically plausible, we cannot determine from our data whether the association between dysnatremia and mortality reflected a direct effect of dysnatremia, a sur-rogate marker for underlying comorbidities or reason for ICU admission, or both.
Additional material
Additional file 1: Additional figures and members of the Outcomerea study group.Figure S1:Frequency of dysnatremia for each of the evaluated subgroups.Figure S2: Cumulative incidence (Y) for mortality according to serum sodium concentration at ICU admission in patients with hyponatremia(2a)and hypernatremia(2b).Figure S3. Relationship between hospital admission serum sodium concentrations and day-30 mortality.Appendix A: Members of the Outcomerea study group.
Abbreviations
95% CI: 95% confidence interval; ICU: intensive care unit; SAPS II: Simplified Acute Physiology Score version II; sHR: subdistribution hazard ratio; SOFA: Sequential Organ Failure Assessment.
Authors’contributions
Prof Darmon and Prof Timsit had full access to all of the data in the study and take responsibility for the integrity of the data and the accuracy of the data analysis. MD participated in the study concept and design, the acquisition of date, the interpretation of the data, and the drafting of the manuscript. ED participated in the study design, the acquisition of the data and critical revisions of the manuscript. BS participated in the study design, the acquisition of the data and critical revisions of the manuscript. SR participated in the statistical analysis and critical revision of the manuscript. CA, EA, CC, MGO, CS, DGT, HK, ASD, SJ, CCh and BA participated in the acquisition of the data, interpretation of the results and critical revisions of the manuscript. FZ participated in the study design, the acquisition of the data and critical revisions of the manuscript. JFT participated in the study design, acquisition of date, statistical analysis, interpretation of the data, and drafting of the manuscript. The final version of the manuscript was read and approved by all of the authors.
Competing interests
The authors have no competing interests to declare.
Acknowledgements
We thank A. Wolfe MD for helping with this manuscript. This study was performed on the behalf of the Outcomerea™study group.
Author details
1Medical ICU, Saint-Etienne University Hospital, Avenue Albert Raymond,
42270, Saint-Priest-en-Jarez, France; Jacques Lisfranc Faculty of Medicine, Jean Monnet University, 15 Rue Ambroise Paré, 42023, Saint-Etienne, France. 2Medical ICU, Gabriel Montpied University Hospital, 58 Rue Montalembert,
63003, Clermont-Ferrand Cedex 1, France.3University of Grenoble 1 (Joseph Fourier) Integrated Research Center U 823 - Albert Bonniot Institute, Grenoble University Hospital, Rond Point de la Chantourne, 38706, La Tronche, Grenoble, France.4Polyvalent ICU, Grenoble University Hospital, Pavillon Dauphine, BP217, 38043, Grenoble Cedex 9, France.5Department of Physiology, Cochin University Hospital, APHP, 27 Rue du Faubourg St Jacques, 75014, Paris, France.6Medical ICU, St Louis University Hospital, 1 Avenue Claude Vellefaux, 75010, Paris, France.7Medical-Surgical ICU, Avicenne University Hospital, 125 Rue de Stalingrad, 93000, Bobigny, France; Paris-13 University, 93000, Bobigny, France.8Polyvalent ICU, Groupe Hospitalier St Joseph, 145 Rue Raymond Losserand, 75014, Paris, France. 9
[image:7.595.58.291.110.345.2]Polyvalent ICU, Gonesse General Hospital, 25 Rue Bernard Fevrier, 95500, Gonesse, France.10Intensive Care Unit, Centre Hospitalier Andrée Rosemon, Table 2 Factors independently associated with day-30
mortality.
sHR 95% CI Pvalue
Natremia
Severe hyponatremia 1.27 (1.01-1.60) 0.040 Moderate hyponatremia 1.18 (1.002-1.40) 0.047
Mild hyponatremia 1.08 (0.95-1.22) 0.23
Borderline hyponatremia 1.09 (0.97-1.24) 0.15
Normal natremia 1 (Ref)
-Borderline hypernatremia 1.09 (0.97-1.24) 0.15
Mild hypernatremia 1.34 (1.14-1.57) 0.0003 Moderate hypernatremia 1.51 (1.15-1.99) 0.003 Severe hypernatremia 2.64 (2.00-3.48) < 0.0001 DFLST* 3.24 (2.90-3.62) < 0.0001 Intoxication as reason for
ICU admission
0.21 (0.13-0.34) < 0.0001
Chronic cardiac dysfunction
1.26 (1.13-1.41) < 0.0001
Immunocompromised patient
1.30 (1.17-1.45) < 0.0001
Age > 64 yrs 1.56 (1.43-1.71) < 0.0001 SOFA score (per point)* 1.21 (1.20-1.23) < 0.0001
Avenue des Flamboyants, 97306, Cayenne, France.11Surgical ICU, Antoine Béclère University Hospital, 157 Rue de la Porte de Trivaux, 92141, Clamart Cedex, France.12Polyvalent ICU, Centre Hospitalier Sud Essonne Dourdan-Etampes-Siège, 26 Avenue Charles de Gaulle, 91150, Etampes, France. 13
Medical-Surgical ICU, Hyeres Hospital, Rue du Maréchal Juin, 83407, Hyeres, France.14Surgical ICU, Edouard Herriot University Hospital, Hospices Civiles de Lyon, 5 Place Arsonval, 69437, Lyon, France.
Received: 24 August 2012 Revised: 12 December 2012 Accepted: 11 January 2013 Published: 21 January 2013
References
1. Bennani S-L, Abouqal R, Zeggwagh A-A, Madani N, Abidi K, Zekraoui A, Kerkeb O:[Incidence, causes and prognostic factors of hyponatremia in intensive care].Rev Med Interne2003,24:224-229.
2. Funk G-C, Lindner G, Druml W, Metnitz B, Schwarz C, Bauer P, Metnitz PGH:
Incidence and prognosis of dysnatremias present on ICU admission. Intensive Care Med2010,36:304-311.
3. Lindner G, Funk G-C, Schwarz C, Kneidinger N, Kaider A, Schneeweiss B, Kramer L, Druml W:Hypernatremia in the critically ill is an independent risk factor for mortality.Am J Kidney Dis2007,50:952-957.
4. Hoorn EJ, Betjes MGH, Weigel J, Zietse R:Hypernatraemia in critically ill patients: too little water and too much salt.Nephrol Dial Transplant2008,
23:1562-1568.
5. Lindner G, Kneidinger N, Holzinger U, Druml W, Schwarz C:Tonicity balance in patients with hypernatremia acquired in the intensive care unit.Am J Kidney Dis2009,54:674-679.
6. Darmon M, Timsit J-F, Francais A, Nguile-Makao M, Adrie C, Cohen Y, Garrouste-Orgeas M, Goldgran-Toledano D, Dumenil A-S, Jamali S, Cheval C, Allaouchiche B, Souweine B, Azoulay E:Association between
hypernatraemia acquired in the ICU and mortality: a cohort study. Nephrol Dial Transplant2010,25:2510-2515.
7. Stelfox HT, Ahmed SB, Zygun D, Khandwala F, Laupland K:Characterization of intensive care unit acquired hyponatremia and hypernatremia following cardiac surgery.Can J Anaesth2010,57:650-658.
8. Stelfox HT, Ahmed SB, Khandwala F, Zygun D, Shahpori R, Laupland K:The epidemiology of intensive care unit-acquired hyponatraemia and hypernatraemia in medical-surgical intensive care units.Crit Care2008,
12:R162.
9. Kumar S, Berl T:Sodium.Lancet1998,352:220-228.
10. Polderman KH, Schreuder WO, Strack van Schijndel RJ, Thijs LG:
Hypernatremia in the intensive care unit: an indicator of quality of care? Crit Care Med1999,27:1105-1108.
11. Laupland KB, Zahar J-R, Adrie C, Minet C, Vésin A, Goldgran-Toledano D, Azoulay E, Garrouste-Orgeas M, Cohen Y, Schwebel C, Jamali S, Darmon M, Dumenil A-S, Kallel H, Souweine B, Timsit J-F:Severe hypothermia increases the risk for intensive care unit-acquired infection.Clin Infect Dis
2012,54:1064-70.
12. Timsit J-F, Fosse J-P, Troché G, De Lassence A, Alberti C, Garrouste-Orgeas M, Bornstain C, Adrie C, Cheval C, Chevret S:Calibration and discrimination by daily Logistic Organ Dysfunction scoring
comparatively with daily Sequential Organ Failure Assessment scoring for predicting hospital mortality in critically ill patients.Crit Care Med
2002,30:2003-2013.
13. Le Gall JR, Lemeshow S, Saulnier F:A new Simplified Acute Physiology Score (SAPS II) based on a European/North American multicenter study. JAMA1993,270:2957-2963.
14. Vincent JL, Moreno R, Takala J, Willatts S, De Mendonça A, Bruining H, Reinhart CK, Suter PM, Thijs LG:The SOFA (Sepsis-related Organ Failure Assessment) score to describe organ dysfunction/failure. On behalf of the Working Group on Sepsis-Related Problems of the European Society of Intensive Care Medicine.Intensive Care Med1996,22:707-710. 15. Knaus WA, Draper EA, Wagner DP, Zimmerman JE:APACHE II: a severity of
disease classification system.Crit Care Med1985,13:818-829. 16. Wolkewitz M, Beyersmann J, Gastmeier P, Schumacher M:Modeling the
effect of time-dependent exposure on intensive care unit mortality. Intensive Care Med2009,35:826-832.
17. Sedlacek M, Schoolwerth AC, Remillard BD:Electrolyte disturbances in the intensive care unit.Semin Dial2006,19:496-501.
18. Zilberberg MD, Exuzides A, Spalding J, Foreman A, Jones AG, Colby C, Shorr AF:Epidemiology, clinical and economic outcomes of admission
hyponatremia among hospitalized patients.Curr Med Res Opin2008,
24:1601-1608.
19. Adrogué HJ, Madias NE:Hyponatremia.N Engl J Med2000,342:1581-1589. 20. Macdonald NJ, McConnell KN, Stephen MR, Dunnigan MG:Hypernatraemic
dehydration in patients in a large hospital for the mentally handicapped.BMJ1989,299:1426-1429.
21. Palevsky PM, Bhagrath R, Greenberg A:Hypernatremia in hospitalized patients.Ann Intern Med1996,124:197-203.
22. Long CA, Marin P, Bayer AJ, Shetty HG, Pathy MS:Hypernatraemia in an adult in-patient population.Postgrad Med J1991,67:643-645. 23. Borra SI, Beredo R, Kleinfeld M:Hypernatremia in the aging: causes,
manifestations, and outcome.J Natl Med Assoc1995,87:220-224. 24. Lindner G, Funk G-C, Lassnigg A, Mouhieddine M, Ahmad S-A, Schwarz C,
Hiesmayr M:Intensive care-acquired hypernatremia after major cardiothoracic surgery is associated with increased mortality.Intensive Care Med2010,36:1718-1723.
25. Adrogué HJ, Madias NE:Hypernatremia.N Engl J Med2000,342:1493-1499. 26. Lenz K, Gössinger H, Laggner A, Druml W, Grimm G, Schneeweiss B:
Influence of hypernatremic-hyperosmolar state on hemodynamics of patients with normal and depressed myocardial function.Crit Care Med
1986,14:913-914.
27. Bratusch-Marrain PR, DeFronzo RA:Impairment of insulin-mediated glucose metabolism by hyperosmolality in man.Diabetes1983,
32:1028-1034.
28. Kozeny GA, Murdock DK, Euler DE, Hano JE, Scanlon PJ, Bansal VK, Vertuno LL:In vivo effects of acute changes in osmolality and sodium concentration on myocardial contractility.Am Heart J1985,109:290-296.
doi:10.1186/cc11937
Cite this article as:Darmonet al.:Prognostic consequences of borderline dysnatremia: pay attention to minimal serum sodium change.Critical Care201317:R12.
Submit your next manuscript to BioMed Central and take full advantage of:
• Convenient online submission
• Thorough peer review
• No space constraints or color figure charges
• Immediate publication on acceptance
• Inclusion in PubMed, CAS, Scopus and Google Scholar
• Research which is freely available for redistribution
Submit your manuscript at www.biomedcentral.com/submit Darmonet al.Critical Care2013,17:R12
http://ccforum.com/content/17/1/R12