R E S E A R C H
Open Access
Novel genes exhibit distinct patterns of function
acquisition and network integration
John A Capra
1,2, Katherine S Pollard
1*, Mona Singh
2*Abstract
Background:Genes are created by a variety of evolutionary processes, some of which generate duplicate copies of an entire gene, while others rearrange pre-existing genetic elements or co-opt previously non-coding sequence to create genes with‘novel’ sequences. These novel genes are thought to contribute to distinct phenotypes that distinguish organisms. The creation, evolution, and function of duplicated genes are well-studied; however, the genesis and early evolution of novel genes are not well-characterized. We developed a computational approach to investigate these issues by integrating genome-wide comparative phylogenetic analysis with functional and interaction data derived from small-scale and high-throughput experiments.
Results:We examine the function and evolution of new genes in the yeastSaccharomyces cerevisiae. We observed significant differences in the functional attributes and interactions of genes created at different times and by different mechanisms. Novel genes are initially less integrated into cellular networks than duplicate genes, but they appear to gain functions and interactions more quickly than duplicates. Recently created duplicated genes show evidence of adapting existing functions to environmental changes, while young novel genes do not exhibit enrichment for any particular functions. Finally, we found a significant preference for genes to interact with other genes of similar age and origin.
Conclusions:Our results suggest a strong relationship between how and when genes are created and the roles they play in the cell. Overall, genes tend to become more integrated into the functional networks of the cell with time, but the dynamics of this process differ significantly between duplicate and novel genes.
Background
Large-scale genome sequencing efforts have made it increasingly possible to study the genetics of species divergence on a genome-wide scale. Comparing the complete genomes of many closely related species in the context of well-resolved phylogenetic trees provides clues about the genomic events and evolutionary pro-cesses that generate functionally-relevant differences between species. Several studies have identified lineage-specific differences in the gene sets of recently diverged species in many clades [1-4], and these observed differ-ences often contribute to functional divergence between species [5-7]. Understanding the origin and function of
new genes is critically important to deciphering the evo-lution of cellular networks and genomes; however, pre-vious analyses have not taken into account the different evolutionary mechanisms that can produce new genes.
New genes are created by a variety of processes, includ-ing gene duplication, domain shufflinclud-ing, incorporation of mobile elements, gene fission and fusion, and de novo
acquisition (reviewed in [8]). Gene duplication has long been appreciated as an essential source of new genes and genetic novelty [9]. Whereas duplicate genes typically retain significant homology to their parent genes, evolu-tionary mechanisms like domain shuffling and gene fission and fusion can generate genes with new combinations of pre-existing functional elements [8,10]. Moreover,de novo
gene creation from non-coding sequence is increasingly recognized as an important source of new genes. Examples of recentde novogene creation have been found in fungi [11,12], flies [13-15], and mammals [6,16,17] - with esti-mates that as many as 12% of new genes in fly and 6% in
* Correspondence: [email protected]; [email protected]. edu
1
Gladstone Institutes, University of California, San Francisco, 1650 Owens St, San Francisco, CA 94158, USA
2
Department of Computer Science and Lewis-Sigler Institute for Integrative Genomics, Princeton University, 35 Olden St, Princeton, NJ 08544, USA Full list of author information is available at the end of the article
human were created from non-coding sequence. Surpris-ingly, as more genomes have been sequenced, the preva-lence of‘orphan’genes, with little to no similarity to other known genes, has not decreased; they still represent around 10-20% of all known genes [18-21].
The diversification of gene function after duplication and its role in the creation of lineage-specific phenotypic differences has been given substantial attention in gen-ome-wide studies [3,7,21-27]. Duplication can occur at dramatically different scales, from the duplication of a relatively short segment of the genome to whole-genome duplication (WGD). Recently, several studies have demonstrated the relevance of the scale of a duplication that copies a gene to its functional consequences [28-30]. For example, the Baker’s yeast,Saccharomyces cerevisiae, underwent an ancient genome duplication [31], and it has been proposed that the WGD was instrumental in enabling the highly fermentative lifestyle that charac-terizesS. cerevisiaeand its close relatives [32,33]. Para-logs inS. cerevisiaegenerated by the WGD are also more likely to share interaction partners and have similar bio-logical functions than duplicates created by small-scale events [34]. It has been argued that duplication of a sin-gle gene that takes part in a functional complex may cre-ate a stoichiometric imbalance [35]. This imbalance could increase the pressure for this duplicated gene to diverge in function and interactions, especially as com-pared to genes duplicated in a large-scale event such as a WGD that potentially maintains the balance within the complex [36].
Genes created by means other than duplication of a complete gene - which we refer to asnovelgenes - are likely to be under different evolutionary pressures than those created by either small-scale or large-scale duplica-tion. Novel genes’sequences may not initially be func-tional or structurally well-formed. In contrast, duplicate genes are typically born with the ability to fold into stable structures with established functions and the potential to interact with their ancestor’s interaction partners. The fate and function over time of novel and duplicate genes may reflect and reveal the effects of these differences. However, the functional evolution of novel genes soon after creation has not been broadly characterized.
To explore how these different evolutionary processes shape functional innovation in a lineage, we developed a computational approach that integrates various func-tional attributes of genes, including length, annotated functions, essentiality, and physical interactions, with a classification of genes into groups reflecting their mechanism of origin and time of creation. Because of the challenges associated with accurately inferring a gene’s mechanism of origin and age [37,38], we considered sev-eral complementary computational approaches for cate-gorizing the genes, and focused on broad statistical
trends. Applying our analysis pipeline toS. cerevisiae, we performed a systematic, genome-wide comparison of the dynamics of function acquisition and interaction network integration between novel and duplicate genes. We found evidence of a strong relationship between the context of a gene’s origin and its integration into the functional net-works of the cell. Both novel and duplicate genes, on average, appear to gain interactions and functions over time, but the rate of this gain is more rapid for novel genes. A dramatic gain in gene length was observed with age for novel genes; this suggests that the integration of additional sequence elements over time may contribute to this increase in function. Overall, our findings argue that both the time and mechanism of creation are rele-vant to understanding how genes’functions evolve, and that differences in gene creation mechanisms are reflected in the fate and function of the genes they create.
Results
The classification of genes by age and origin
We predicted the time of creation and mechanism of origin for each gene in S. cerevisiae (see Methods for details). Briefly, we classified all genes in S. cerevisiae
into one of three ‘age’categories: pre-WGD genes that were present before the WGD event approximately 100-150 million years ago; WGDgenes that were duplicated
by the WGD and maintained; and post-WGD genes
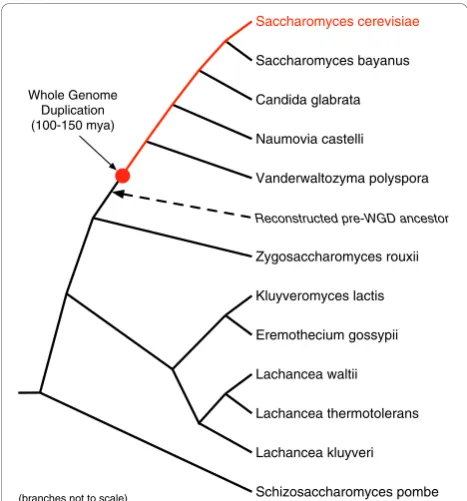
that have appeared since the WGD. Genes present before the WGD (pre-WGD) will also be referred to as ‘old’, while those created since the WGD (post-WGD) will, in comparison, be referred to as‘young’or ‘recently created’ (even though they may be 100 million years old). The classification of each gene was based on its presence or absence in a curated reconstruction of a pre-WGD yeast ancestor from Gordon et al. [39]. In that work, sequence similarity and synteny were used to trace by hand the evolutionary history of each gene in 11 fully sequenced yeast species (Figure 1) and recon-struct the gene content and order of the S. cerevisiae
ancestor immediately before the WGD.
Next, we assigned S. cerevisiae genes to origin
cate-gories, duplicate or novel. Since predicting the
mechanism of origin for a gene is a challenging task, we used several approaches. The first is a family-based approach that considers the presence or absence of paralogous genes in the genome. Genes with at least
one paralog in S. cerevisiae were assigned to the
duplicate category. Genes with no paralogs were
assigned to the novel category. The evolutionary
[42], a computational method that uses gene sequence similarity and synteny to reconstruct genome-wide evo-lutionary histories of gene families. While gene loss and rapid evolution can confound both methods of classifi-cation (see Discussion), in each case, the duplicate
category contains genes likely to have been created by a duplication of a complete gene, and thenovel group contains genes likely created by one of the non-dupli-cate mechanisms that yield genes of novel sequence and structure. For ease of exposition, we report results from the evolutionary family-based classification in the main text. In Additional file 1, we show that our main conclu-sions hold based on the Synergy-based origin classifica-tion scheme, and include several addiclassifica-tional controls, including the exclusion of harder to classify genes in the dynamic subtelomeric regions. A fuller description of the classification process is included in the Methods.
Considering the age and family-based origin categories
together, we predicted 1,434pre-WGD/duplicate,
2,696pre-WGD/novel, 1,087 WGD/duplicate, 314
post-WGD/duplicate and 239 post-WGD/novel
genes. No novel genes were created by the WGD, so the
empty WGD/novel group is ignored. Only non-dubious
genes, as annotated by the Saccharomyces Genome
Database (SGD) [43], were considered, so as to eliminate sequence regions that resemble genes, but that are not actually translated and transcribed (for example, pseudo-genes and spurious predictions from gene finding pro-grams). This classification of genes in provided in Additional file 2 [44].
Functional properties of young novel and duplicate genes
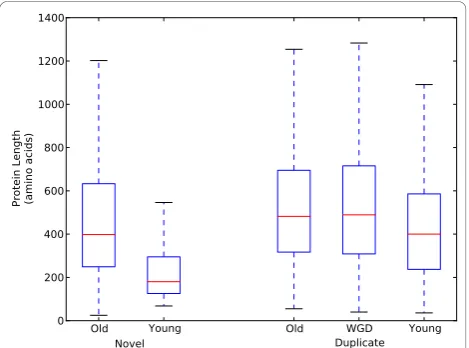
As a first step in the investigation of the influence of gene age and origin on function, we analyzed the age/ origin gene groups with respect to four attributes that reflect different aspects of gene function. First, we con-sidered the length of the protein encoded by a gene. Protein length imposes physical constraints on the num-ber of functional domains it can contain. Second, we measured the fraction of each protein’s amino acids that are predicted to take part in a Pfam domain. Protein domains are the fundamental units of protein structure and function, and protein domain families from Pfam [45] provide a view of the units that enable proteins to function. Third, we report the fraction of genes in each age/origin group that are known to be essential. Essenti-ality, as determined by the viability of a deletion mutant [46,47], gives an indication of the importance of the gene to the species. Fourth, we calculated the fraction of genes that have been annotated with terms from each of the Gene Ontology (GO) functional hierarchies [48]. GO annotations reflect what is currently known about a gene’s function.
Using these four functionally relevant gene properties, we compared genes across both time of creation and mechanism of origin (Table 1, Figure 2). The signifi-cance of differences in these functional attributes between the age/origin groups was assessed by a Mann-WhitneyUtest, and all differences discussed in this sec-tion are significant at the 0.05 level.
Genes in each age/origin group differ in their properties
Comparing the properties of proteins corresponding to the genes across age and origin groups revealed several general trends (Table 1, Figure 2). Young proteins are shorter, have fewer known functions, and are less essen-tial than their older counterparts. This difference between young and old proteins holds when considering both novel and duplicate genes separately. However, the differences between old and young duplicate genes in each of the functional properties, except for essentiality, are much less dramatic than among novel genes of dif-ferent ages. Within proteins of similar age, there are also marked differences. For nearly all properties consid-ered, the novel proteins have less evidence of function than duplicate proteins from the same age group; they have a lower fraction of coverage by Pfam domains, are
Naumovia castelli
Lachancea kluyveri Vanderwaltozyma polyspora Candida glabrata
Saccharomyces bayanus
Saccharomyces cerevisiae
Eremothecium gossypii Whole Genome Duplication Zygosaccharomyces rouxii
Lachancea thermotolerans Lachancea waltii
Schizosaccharomyces pombe Kluyveromyces lactis
Reconstructed pre-WGD ancestor
(branches not to scale)
[image:3.595.56.290.88.339.2]Whole Genome Duplication (100-150 mya)
less likely to have known annotations from GO, and have fewer proteins with known physical interactions. The one exception to this pattern is essentiality among the old genes; the old novel genes are as likely to be essential as the old duplicate genes. However, the young novel genes are less essential than the young duplicate genes. In general, the differences between the older genes of different origin are less dramatic than those between the young novel and duplicate genes.
Young novel genes are particularly short, non-essential, and minimally annotated
Young novel genes are by far the most distinct group with respect to the properties analyzed in the previous section (Table 1, Figure 2). They are significantly shorter than young duplicate proteins; the proteins in these groups have median length of 180 amino acids (aa) and 400 aa, respectively. Young novel proteins are also less covered by Pfam domains (12% vs. 53%); this suggests that many young novel proteins are not simply rearran-gements of pre-existing functional domains, but rather that they often consist of novel functional units. In
addition, young novel genes are essential less frequently than young duplicates (0% vs. 2%), and are much less likely to have GO Molecular Function annotations (22% vs. 60%). As suggested by these results, young novel genes are also significantly different from older novel genes. The median length of their corresponding pro-teins is less than half as long (180 aa vs. 398 aa); their amino acids are on average three times less likely to participate in known Pfam domains; they are not essen-tial (0% vs. 30%); and a smaller fraction have annota-tions as compared to old novel genes (22% vs. 67%). Thus, four largely independent lines of evidence suggest that novel and duplicate genes have distinct functional properties and that young novel genes have fewer func-tional abilities than old.
We note that differences in the number of annota-tions, according to GO, between the gene groups could be the result of a bias in the amount of study genes of different groups have received, rather than differences in the number and character of the functions actually per-formed by the genes in the group. The three additional functional attributes we considered are less subject this potential bias. Sequence-derived properties such as length and coverage by Pfam domains (we include Pfam sequence motifs corresponding to‘domains of unknown function’), as well as the fraction of tested genes found to be essential, do not depend on the number of experi-ments carried out on a gene.
The physical interactions of novel and duplicate proteins
Proteins function by interacting with one another and with other molecules in the cell. Thus, a protein’s physi-cal interactions and its integration into the topology of the interaction network provide additional evidence about its functions, how they are accomplished, and their overall importance to cellular functioning [49-56]. We explored whether the proteins corresponding to genes in each of the age/origin groups differ with respect to their frequency of physical interactions, their relative location within the yeast protein interaction net-work, and the identity of their interaction partners.
[image:4.595.56.540.100.175.2]We constructed a protein-protein physical interaction (PPI) network for S. cerevisiae using interaction data
Table 1 The coverage of gene groups by different sources of functional information
Origin Age Number of genes Pfam coveragea Fraction essentialb GO MF coveragec Fraction with interactionsd
Novel Old 2696 0.36 0.30 0.67 0.77
Young 239 0.12 0.00 0.22 0.25
Duplicate Old 1434 0.57 0.30 0.88 0.81
WGD 1087 0.45 0.08 0.76 0.72
Young 314 0.53 0.02 0.60 0.55
a
Pfam coverage: average fraction of protein length covered by Pfam domains;bfraction essential: fraction of genes in each group that are essential;cGO MF coverage: fraction of genes with Gene Ontology (GO) Molecular Function (MF) annotations;d
fraction with interactions: fraction of genes with interactions in the protein physical interaction network. Each statistic is calculated over those genes whose proteins have known physical interactions.
[image:4.595.57.292.488.662.2]from small-scale experiments and high-throughput stu-dies as defined by the Database of Interacting Proteins (DIP) [57]. For each protein with known interactions, we quantified its integration into the yeast protein-protein interaction network by two graph-theoretic mea-sures of the importance of a node within a network. The degree (or degree centrality) of a protein in the physical interaction network is the number of known interaction partners, and is a local measure of the topological cen-trality of the protein in the network. The betweenness centrality of a protein is the fraction of all shortest paths in the network that contain it, and is a global measure of the importance of a node within a network.
Young proteins are less integrated into the physical interaction network than older proteins
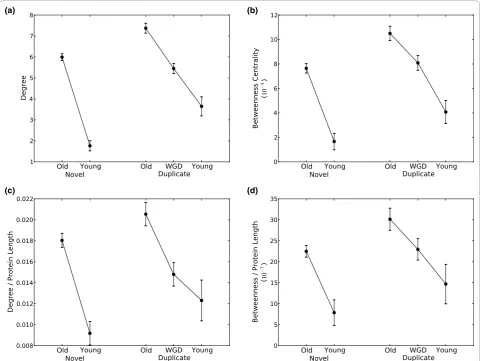
Both young novel and young duplicate proteins have fewer interactions than their older counterparts (Figure 3a). There is a clear increase in degree with age, and in general, proteins created by the WGD are found to have degree between the older and younger groups. A similar increase with age is observed among the groups when considering betweenness centrality (Figure 3b). Only proteins with known interactions are considered in this analysis, but we also note that a considerably smaller fraction of young proteins have known interactions than the old proteins (Table 1). The differences in the network integration of young and old proteins would be even more extreme if all proteins were included.
We considered three additional related tests that also support the finding that young proteins are less inte-grated within cellular networks. First, since a protein’s size places physical limits on the number of interactions it can simultaneously maintain with other proteins and molecules [58], we also normalized the degree and betweenness of each protein by its length (Figure 3c, d). The increase in interactions with protein age is still pre-sent after this normalization, though it is somewhat reduced. Second, since essential proteins have been found to participate in more interactions than non-essential proteins [59,60] and older proteins are more frequently essential (Table 1), we repeated the analysis excluding essential proteins and find the same relation-ship between the age of a protein and its network con-text (Section S1.1.3 in Additional file 1). Third, since the presence of interactions in the network derived from small-scale studies could introduce a bias toward inter-actions involving well-studied proteins, we repeated the analysis including only interactions determined by high-throughput studies, and found that young proteins are also less integrated than older proteins in the network resulting from only high-throughput experiments (Sec-tion S1.2 in Addi(Sec-tional file 1).
Novel proteins are less central in the network than duplicate proteins of the same age
Comparing the distributions of degree and betweenness centrality between groups of proteins based on origin reveals that duplicate proteins are more centrally located in the network than novel proteins of the same age (Figure 3). The novel proteins have on average both lower degree and lower betweenness centrality than their duplicate counterparts. Because young novel proteins are significantly shorter than all other types (Figure 2), the large difference in raw degree between the young novel proteins and young duplicate proteins is reduced when normalized by protein length (Figure 3c, d). Nonetheless, the young novel group is still more peripheral than any other group, even after length normalization.
Proteins preferentially interact with proteins of same age and origin
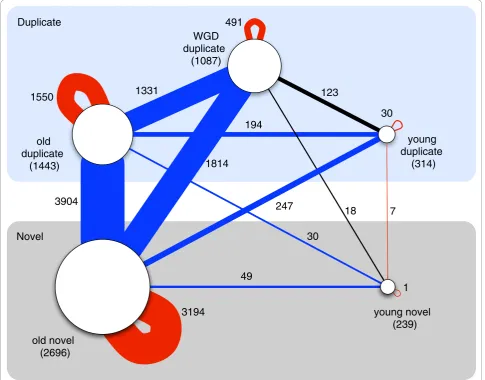
The analysis of the previous sections considered the number of interactions for proteins in the physical inter-action network. The identity of a protein’s interaction partners also gives information about how it functions. Each interaction in the network can be classified based on the group membership of the interacting proteins. Figure 4 shows a schematic view of the yeast protein-protein interaction network that gives the number of interactions between different age/origin groups.
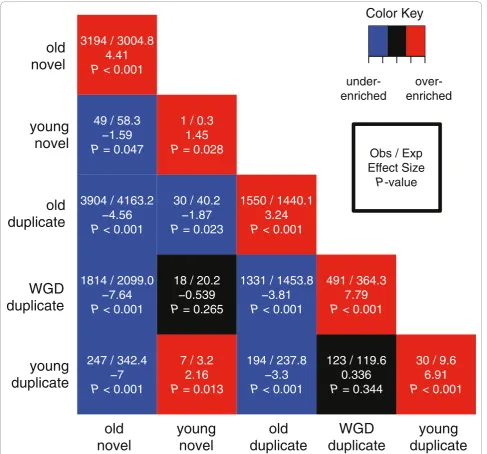
To investigate whether proteins demonstrate prefer-ences in their interaction partners, we compared the number of each type of interaction observed in the actual network to the number expected to occur by chance in a random network that preserves the degree distribution of each protein group (Methods). The heat map in Figure 5 summarizes these results across pairs of age/origin groups with interactions between proteins in the same group listed along the diagonal. Proteins from all age/origin groups are significantly more likely to interact with proteins from their own group than expected by chance (P < 0.05 for each group). That is, proteins created by similar mechanisms at similar times preferentially interact with one another.
that proteins interact only with their group members. For example, the majority of interactions for both groups of young proteins are with proteins from other age/origin groups (Figure 4); however, the number of interactions observed within the groups is significantly greater than expected.
The functions of young genes
We have shown that genes of different ages and origins differ with respect to their functional attributes and their context in the interaction networks of the cell. Since the creation of new genes may play a role in spe-ciation and the development of novel phenotypes, the functions of young genes are particularly interesting. In this section, we investigate whether the differences in how novel and duplicate young genes are integrated into functional networks are reflected in their specific
functions, and whether these gene gains can be tied to phenotypic differences in the corresponding species.
Young duplicate genes facilitate the processing and transport of sugars, while young novel genes do not exhibit enrichment for particular functions
Functional annotations from the GO hierarchies repre-sent the current state of our knowledge of the functions of genes. Comparing the GO annotations observed in a subset of genes to the genome wide distribution of annotations can identify enriched functions that occur in the subset more than expected by chance [61].
The young duplicate set is enriched for genes that interact with the environment and that are involved in the processing and transport of sugars (P < 0.01 for all enrichments mentioned, see Tables S12-S14 in Addi-tional file 1). For example, the enriched terms include carbohydrate transport, response to toxin, glucose
(d) (c)
[image:6.595.58.541.89.450.2](b) (a)
Figure 3The integration of proteins into the yeast protein-protein interaction network by age and origin. Each pane gives the average (with standard errors) of a statistic that reflects the integration of proteins in each age/origin group into the yeast physical interaction network:
transmembrane transporter activity, aryl-alcohol dehy-drogenase activity and cell wall. This enrichment is notable given the distinctive fermentative abilities of
S. cerevisiaeand its close relatives (see Discussion). The innovation in functions related to carbohydrate proces-sing appears to be focused in subtelomeric regions. When subtelomeric genes were removed from the enrichment analysis of young duplicate genes, these terms were no longer significantly enriched. However, the enrichment for many of the terms related to envir-onmental response was maintained. The full list of enriched terms when excluding subtelomeric genes is given in Table S6 in Additional file 1.
In contrast, no significant enrichment for these or any other functions was found among the young novel
genes with annotations. However, very few of these genes have GO functional annotations (Table 1). The terms observed among the young novel genes with annotations exhibit a wide variety of functions from transcription factor activity to flocculation.
Young novel proteins in their network context
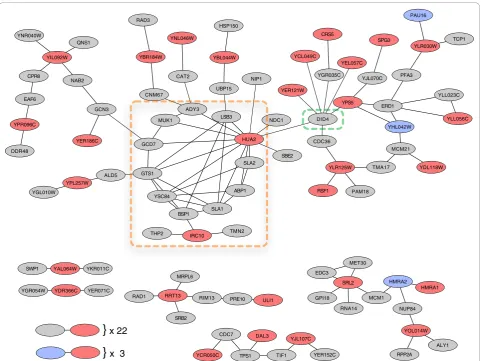
In order to better characterize the functions of young novel genes in the absence of direct experimental data, we took a detailed look at the context of the corre-sponding proteins in the yeast protein physical interac-tion network. Figure 6 shows the subgraph of the PPI network induced by the young novel proteins and their neighbors. Of the 239 young novel proteins only 59 have known physical interactions. These 59 proteins interact with a total of 89 proteins from other groups.
young novel (239) Duplicate
Novel
194 1331
30
7 123
1814
49
18 247
3904 1550
491
30
1 young duplicate
(314)
3194 old
duplicate (1443)
WGD duplicate
(1087)
[image:7.595.56.542.90.470.2]old novel (2696)
GO terms observed among the protein physical interac-tion network neighbors of each young novel gene revealed a range of general functions, but again we did not observe significant patterns of enrichment as seen for young duplicate genes.
Remarkably, more than 40% of all young novel proteins with interactions (25 out of 59) are found in a single, rela-tively small connected component of 81 proteins. Within
this connected component, there is a nearly complete sub-graph which includes the young novel protein Hua2p (Fig-ure 6). The proteins that make up this highly connected module are enriched for functions involved in aspects of actin assembly and regulation. These interactions led to the previous annotation of Hua2p with a possible role in actin patch assembly [62]. Hua2p has the most interac-tions of any young novel protein. In contrast, the young
247 / 342.4
7
P
< 0.001
7 / 3.2
2.16
P
= 0.013
194 / 237.8
3.3
P
< 0.001
123 / 119.6
0.336
P
= 0.344
30 / 9.6
6.91
P
< 0.001
1814 / 2099.0
7.64
P
< 0.001
18 / 20.2
0.539
P
= 0.265
1331 / 1453.8
3.81
P
< 0.001
491 / 364.3
7.79
P
< 0.001
3904 / 4163.2
4.56
P
< 0.001
30 / 40.2
1.87
P
= 0.023
1550 / 1440.1
3.24
P
< 0.001
49 / 58.3
1.59
P
= 0.047
1 / 0.3
1.45
P
= 0.028
3194 / 3004.8
4.41
P
< 0.001
old
novel
young
novel
old
duplicate
WGD
duplicate
young
duplicate
old
novel
young
novel
old
duplicate
WGD
duplicate
young
duplicate
Obs / Exp
Effect Size
P
-value
over-enriched
under-enriched
[image:8.595.56.544.88.542.2]Color Key
novel protein Irc10p has only three known interactions, and no known function. It is directly connected to the module that contains Hua2p, and two of its interaction partners have functions that suggest a potential connec-tion to actin: Bsp1p links proteins to the cortical actin cytoskeleton [63] and Tmn2p is a transmembrane protein involved in filamentous growth [64]. Both Hua2p and Irc10p are present in onlyS. cerevisiaeand its closest rela-tive considered,S. bayanus. This suggests recent changes to processes involving actin due to the creation and inte-gration of these young proteins.
Another notable feature in this‘young novel’subgraph is the old duplicate protein Did4p. It interacts with a large number of young novel proteins; seven of the young novel
proteins are either adjacent to or one protein removed from it. Did4p is involved in the sorting of integral mem-brane proteins into lumenal vesicles of multivesicular bodies, and the delivery of newly synthesized vacuolar enzymes to the vacuole. It also plays a role in endocytosis [65-67]. Several of the proteins near Did4p in the network also have functions related to membrane trafficking and the endoplasmic reticulum. For example, Erd1p is a pre-dicted membrane protein required for the retention of lumenal endoplasmic reticulum proteins [68], and the young duplicate protein YHL042Wp is a member of the DUP380 family thought to be involved in membrane traf-ficking [69]. This suggests that the nearby young novel proteins, such as Yps5p, which has similarity to cell
YIL092W QNS1
NAB2 CPR8
YNR040W
EAF6
YER186C
YGL010W YPR096C
GCN3
YPL257W ALD5 DDR48
TMN2 ABP1
THP2
BSP1 SLA1 YSC84
IRC10
YDR366C YKR011C YAL064W
YGR054W YER071C SWP1
MRPL6
RRT13
SRB2
YCR050C CDC7
PRE10 RAD1
TPS1 RIM13
LSB3
GCD7
SLA2 CAT2
CNM67
HUA2 MUK1
ADY3 UBP15
GTS1
HSP150 RAD3
YBL044W YNL046W
YBR184W
YPS5
CDC36 NDC1
MCM21 ERD1
YHL042W DID4
SBE2
DAL3
RPP2A YER152C
YOL014W
ALY1 YJL107C
TIF1
YEL057C SPG3 CRS5
YCL049C
YJL070C YGR035C
NIP1
YER121W
MET30 EDC3
RNA14 NUP84
ULI1
HMRA1 SRL2
GPI18
HMRA2
MCM1
TMA17 YDL118W
RSF1 YLR125W
PAM18
YLL056C TCP1 YLR030W
PFA3 PAU16
YLL023C
}
x 22 [image:9.595.58.540.87.448.2]}
x 3membrane GPI-anchored aspartic proteases [70], and YCL049Cp, which localizes to the membrane [71], are likely involved in similar processes.
Discussion
We introduced a computational approach for investigat-ing the origin, function, and evolution of new genes by considering a phylogenetic classification of each gene in an organism within the context of its cellular interaction network. Applying this approach toS. cerevisiae, we have shown that there are significant differences between the lengths, interactions, and functional properties of groups of genes classified according to their ages (pre-WGD, WGD, or post-WGD) and their origins (duplicateor
novel). Most notably, young novel genes are shorter, less annotated by a range of sources of functional infor-mation, and less integrated into experimentally deter-mined physical interaction networks than other genes.
Interpretations
Assuming that the early evolutionary history of older genes is reflected in modern young genes, our findings suggest that on average both novel and duplicate new genes tend to gain interactions over time. However, the dynamics of this gain appear to differ between genes based on their mechanisms of origin and context. In particular, novel genes start with far fewer annotated functions and interactions than duplicates. This is not surprising as duplicate genes often arise with the ability to interact with their ancestors’interaction partners, and their structures already have established functions in the cell. On the other hand, non-duplicate genes are likely created by evolutionary processes that generate novel sequences that initially may not be fully functional. The differences in length, interactions, and functions we identified between old and young novel genes are more pronounced than those uncovered between old and young duplicated genes. This suggests that novel genes may experience a more rapid gain in function over time. The increase in novel gene length with age provides one possible explanation for the gain in interactions and functional capabilities: the incorporation of additional sequence elements. The integration of mobile genetic ele-ments and surrounding sequence via mutation of start and stop codons could be responsible for this lengthen-ing. These phenomena have been documented in detailed analyses of the evolutionary histories of several recently created genes [8] and regulatory elements [72]. However, the increase in interactions with age is maintained when gene length is taken into account (Figure 3). This argues that the addition of new sequence is not entirely respon-sible for the gain of interactions.
The differences we have uncovered between genes grouped together by their predicted age and origin
strongly suggest that both the mechanism and time of creation influence how newly created genes gain func-tions. Several previous studies support aspects of this hypothesis. For example, proteins with similar phyloge-netic profiles - patterns of occurrence of homologous proteins in organisms across the evolutionary spectrum - have been shown to have similar functions [73], and the increasing relationship between age and degree has been observed previously [74]. A very recent sequence-based analysis found that young genes in eukaryotes experience more variable patterns of selection than older genes with homologs in bacteria [75]. Our integra-tion of predicintegra-tions of age, origin, funcintegra-tion, and interac-tions demonstrates that there are further distinct patterns in the functional evolution of newly created genes of different origin. The significant preference of proteins (both young and old) to interact physically with proteins in the same age/origin group (Figure 5) sug-gests that genes with similar evolutionary origins and histories are more likely to gain and participate in simi-lar functions, perhaps reflecting adaptations in those functions during particular phases of the organism’s evolution. The enrichment for a small number of speci-fic functions in young duplicates and the presence of many young novel proteins in a single, small, connected subgraph of the PPI network are consistent with this hypothesis of coordinated integration.
The relevance of the context and time of creation to gene function and interactions also suggests a potential driving force for the modularity observed in protein interaction networks (see, for example, [76,77]). While several theoretical network evolution models that incor-porate gene duplication and the subsequent gain and loss of interactions yield networks with similar proper-ties to observed networks [55,78,79], recent work has identified subtle attributes of protein-protein interaction networks that cannot be explained by gene duplication and divergence alone [54,56]. The distinct patterns we identified in the interactions of genes created by mechanisms other than duplication suggest that model-ing other types of gene creation will also be important in understanding the evolution of cellular networks.
New genes and novel phenotypes
involved in generating and refining this novel trait in
Saccharomycesyeasts. For example, ADH2 (YMR303C), an alcohol-dehydrogenase known to be central to this ability [81], was created by a duplication after the WGD. In stark contrast, the young novel genes are not found to be associated with these processes or with adapting to any other changes in the environment, further high-lighting the importance of origin to the acquisition of function.
A large number of young genes in S. cerevisiaelack any information about their function. In addition, there is evidence that many open reading frames (ORFs) cur-rently classified as dubious may actually encode func-tional proteins [82]. The recent discovery that MDF1is ade novoprotein-coding gene likely involved in mating type adaptation provides a striking example of this potential [12]. This gene was not included in our analy-sis, because it was classified as a dubious ORF at the start of our study. It will be exciting to continue explor-ing the existence and function of newly created genes and their involvement in lineage specific traits. Our ana-lysis of the protein interaction network context of young novel genes inS. cerevisiaeprovides a step in this direc-tion by suggesting roles in actin processing and mem-brane trafficking for several uncharacterized genes.
Controls and robustness
We have described a procedure for categorizing genes with respect to age and origin, and relating them to cel-lular function. Our overall conclusions in S. cerevisiae
are robust to a number of modifications in our analysis pipeline.
Inferring the evolutionary history and origin of a gene is an area of active research. Genes with fully traced evo-lutionary histories reveal complex series of events that can dramatically alter a gene’s sequence and context in the genome over time [8]. Current methods for ancestral reconstruction cannot always accurately perform the basic inferences involved in these analyses, such as cross-species ortholog prediction [37] and the determination of the original copy after a duplication [38], much less trace more complex evolutionary events that may fuse, rear-range, and remove parts of genes. To account for these challenges, we considered different methods for predict-ing the origin of a gene. Though they did not always agree on specific predictions (Figure S1 in Additional file 1), they produced categorizations that are enriched with genes of the appropriate origin and amenable to statisti-cal analysis. Indeed, our main conclusions hold across several different prediction methods (Section S1.1 in Additional file 1).
Bias toward the study of older, evolutionarily con-served genes could magnify the patterns of difference we observed between young genes and old genes. We
accounted for this possible bias by confirming our con-clusions on data from sources that are not based on small-scale experimental analyses. For example, as noted earlier, the significant increase in interactions with age also holds when considering interaction networks built from only high-throughput studies. Similarly, the small number of GO annotations for young and novel genes is supported by similar patterns in length, coverage by Pfam domains, and essentiality, each of which is less subject to bias. Pseudogenes and other spurious pre-dicted genes also have the potential to confound our analysis. To limit their effect on our conclusions, we left all dubious ORFs (as defined by SGD) out of the analy-sis, and confirmed our results on the set of genes for which the corresponding proteins are known to partici-pate in protein-protein interactions. This provides strong evidence that the genes considered are tran-scribed and translated.
Future work
In the future, it should be possible to apply our proce-dure, with appropriate modifications, to other lineages. The large number of genomes available for primates and placental mammals together with a large-scale human physical interaction network [83] make human a promising future target.
Another avenue for further research is to consider more detailed categorizations of gene age and mechan-ism of origin. In the near future, a more fine-grained temporal analysis will likely be possible as more gen-omes are sequenced and computational methods for reconstructing evolutionary histories improve. As a first step, we considered a more specific division of gene age in which we distinguished the old (pre-WGD) genes into those created prior to the divergence ofS. cerevisiae
andSchizosaccharomyces pombeand those created after this divergence, but before the WGD [84]. Results were similar on this partition of the genes, and genes in the temporally intermediate group exhibited patterns that fell between those of younger and older genes, support-ing our conclusion that genes, on average, gain func-tions and interacfunc-tions over time (Section S2.2 in Additional file 1).
The different rates of network integration and functional gain we observed suggest that a more detailed analysis of the patterns and functional impact of specific mechanisms of gene gain and evolution could be fruitful. Thenovel
gene groups contain genes created by a number of duplicate evolutionary mechanisms. Grouping these non-duplicate genes was necessary for our statistical analysis, because the absolute number of young genes is relatively small. However, the evolutionary forces acting on genes of
as the latter are more likely to be immediately associated with certain cellular functions and to have specific protein interactions. Depending on the lineages studied, we could divide this group of genes further. In prokaryotes, for example, it would be possible to investigate the integration of genes gained by lateral gene transfer into interaction networks.
Conclusions
We expect that further characterization of recently created genes in organisms across the evolutionary spectrum, as well as a deeper understanding of the evolutionary mechanisms that generate and shape them, will play a cen-tral role in our understanding of the genetic basis of line-age-specific traits and adaptation.
Materials and methods
Data
Raw sequence data and annotations for theS. cerevisiae
strain S228C genome were downloaded from the SGD on October 18, 2009 [85]. The reconstructed evolution-ary history betweenS. cerevisiaeand a pre-WGD ances-tor derived by Gordon et al. [39] was downloaded from the Yeast Gene Order Browser (YGOB) Version 3 [86,87]. Predicted gene families and the corresponding homologous proteins were downloaded from the Prince-ton Protein Orthology Database [40,41] on October 18, 2009. The PPOD database includes predictions from OrthoMCL [88], MultiParanoid [89], and a Jaccard clus-tering-based approach. For the classification of subtelo-meric genes not included in YGOB reconstruction, sequence alignments ofS. cerevisiaeproteins with pre-dicted orthologs from seven related fungi were down-loaded from SGD on November 24, 2009 [85].
Physical interaction data were extracted from the Jan-uary 26, 2009 release of interactions in the Database of Interacting Proteins (DIP) [57]. In exploring the robust-ness of our conclusions, we also considered the physical interaction networks of Kim and Marcotte [54], which were extracted from BioGRID [83]. For the DIP net-work, proteins with more than 50 physical interactions were iteratively filtered so as to remove experimental artifacts due to ‘sticky’proteins. The networks used by Kim and Marcotte [54] were filtered as described in Batada et al. [90]; this produced networks that were easily divided into a literature-curated interaction set and a set determined by high-throughput experimental methods. The reported conclusions hold on all of these networks (Section S1.2 in Additional file 1), suggesting that bias in the study of certain types of interaction is not responsible for the patterns observed.
We considered several sources of functional information about genes and proteins. First, the essentiality of a gene was taken from the viability data reported in SGD [47,85].
This includes data from a high-throughput screen of knockout mutants of nearly all ORFs inS. cerevisiae[46] and many small-scale studies. We considered a gene essential if it was found to be essential in any of the stu-dies. Knowledge of the function of a protein was taken from the Gene Ontology database [48] maintained at SGD. The enrichment for functions among sets of pro-teins was tested using the GO:TermFinder tool [61]. The known domains present in each protein were taken from release 24 of Pfam-A [45]. The significance of observed differences in these properties between groups of proteins was assessed by a Mann-WhitneyUtest. Performing a two-way ANOVA on the groups also yielded similar results.
Classification of genes by age and mechanism of origin
We assigned an age (pre-WGD, WGD, orpost-WGD)
and mechanism of origin (duplicate or novel) to
each non-dubious S. cerevisiae ORF in SGD. We first describe the family-based scheme used in the main body of the paper, and then briefly describe alternate approaches that produced similar conclusions.
For each gene, a mechanism of origin was assigned based on the presence or absence of a paralog inS. cere-visiae. Genes found in a homologous family with more than one member in S. cerevisiaeas defined by the Jac-card clustering method in PPOD [40] were classified as
duplicate, and those without other family members in S. cerevisiaewere classified as novel. Classification of genes into age groups was greatly facilitated by the recent reconstruction of the evolutionary history of
S. cerevisiae to just prior to the WGD [39]. This recon-struction was carried out by hand and considered the sequence similarity and synteny of all genes in the species listed in Figure 1. If a gene was present in the predicted pre-WGD ancestor, it was assigned to the pre-WGD group. Duplicate gene pairs created by
the WGD were assigned toWGD/duplicate. Though
determining the scale of gene duplication is challenging [91], gene duplicates maintained from the WGD have a distinct signature when their genomic contexts in the reconstruction are compared. Only one copy will be present in the pre-WGD ancestor, and this gene will map to two distinct regions inS. cerevisiae that both maintain synteny to the ancestor [31,39]. Homologous families containing known WGD paralogs were merged. A gene whose ancestor is not found in the pre-WGD ancestor was assigned topost-WGD.
extend our analysis to these genes, we considered the phylogenetic distribution of subtelomeric genes in the SGD’s alignments of orthologs from seven fully sequenced species (S. cerevisiae, Saccharomyces para-doxus, Saccharomyces mikatae, Saccharomyces bayanus, Saccharomyces kudriavzevii, Naumovia castellii, Lachan-cea kluyveri). These alignments are based on the data and analysis of Cliftenet al. [92] and Kellis et al. [93]; note that they include a different set of species than those used in the ancestral reconstruction. Genes with an ortholog in a species that diverged prior to the WGD were assigned topre-WGD. All others were assigned to
post-WGD. Since these predictions were obtained using a different strategy from those in the YGOB, we repeated our analysis excluding all subtelomeric genes. Our overall conclusions are maintained (Section S1.1.3 in Additional file 1).
Gordon et al. [39] analyzed 124 genes created since the WGD. The additionalpost-WGDgenes in our clas-sification come from two sources. As described above, we assigned nearly 200 subtelomeric genes that were left
out of their reconstruction to the post-WGD group.
The remaining additional genes were included in the data downloaded from the Yeast Gene Order Browser,
but not considered in Gordon et al. Many of these
genes were not classified as dubious by SGD and had physical interactions, so we included them in our analy-sis. Leaving out each of these groups of genes in turn and rerunning our analyses yielded similar results (Sec-tion S1.1.3 in Addi(Sec-tional file 1).
The classification of sets of genes into age and origin groups is a challenging problem. We tested the sensitivity of our conclusions to several different family and evolu-tionary history inference methods. In particular, taking families from MultiParanoid [89] or OrthoMCL [88] (see Section 1.1.2 in Additional file 1). We also considered an origin classification based on gene trees and orthologous groups defined by the Synergy algorithm [25,42,94] for each gene inS. cerevisiae. If a gene had a predicted dupli-cation at any point on the path to its ancestor in its gene tree or a homologous orthogroup, it was assigned to
duplicate; otherwise, it was assigned tonovel. This approach and the family-based method agreed on 76% of their predictions, and our main conclusions were main-tained with this definition of origin. This supports our interpretation that, though gene loss and rapid evolution may introduce errors in individual classifications, the mechanism of creation groups are enriched for genes of the relevant origin. These results are presented in Section S1.1.1 in Additional file 1.
The classification approaches described above desig-nate all genes in a homologous protein family as dupli-cateand do not attempt to distinguish a single gene as the progenitor of the family. We took this approach,
because selecting which gene among a set of duplicates is the ancestral copy is often very difficult - in particular in the case of tandem duplicates [38]. In fact, there is no guarantee that the initial member of the family is still present in the genome. To explore the effect of this choice on our results, we tested another strategy in which we selected the oldest gene from each homologous family (or randomly among the oldest if more than one existed) to serve as the progenitor of the family. The old-est gene was defined as the gene in the family with the most distant ortholog according to the YGOB. For subte-lomeric genes, we used the SGD alignments, which each contain a singleS. cerevisiaegene, to determine the most distant ortholog. This gene was thus assigned to a
novelgroup. Our conclusions held on this adapted clas-sification (Section S1.1.3 in Additional file 1).
Analysis of interaction network properties
The integration of a protein in the physical interaction network was quantified by its degree (that is, the number of interactions in which it participates) and its between-ness centrality (that is, the fraction of all shortest paths between pairs of other nodes in the network that go through it) [95,96]. Proteins with no interaction data were not considered in the calculation of network statistics.
The number of interactions between proteins in all pairs of age/origin groups was calculated. The signifi-cance of the observed number of interactions was quan-tified by comparing it to the number of interactions between the same groups in 1,000 randomized networks that maintain the degree distribution within groups, but randomize the interactions. An empiricalp-value for an observed number of interactions was estimated by the proportion of the random networks in which at least as many interactions were observed [97]. Degree-preserving randomizations were performed using a stub-rewiring algorithm [98]. The effect size of the observed difference was quantified using Glass’sΔ: the difference between the observed and average number of interactions in the random networks divided by the standard deviation of the number seen in the random networks.
Additional material
Additional file 1: Supplementary analysis. This file contains additional analysis and results in support of the main text.
Additional file 2: Classification ofS. cerevisiaegenes into age/origin groups. This tab-delimited text file contains the classification of allS. cerevisiaegenes into age/origin groups.
Abbreviations
protein orthology database; SGD:Saccharomycesgenome database; WGD: whole-genome duplication; YGOB: yeast gene order browser.
Acknowledgements
We thank Jonathan Gordon for help interpreting data from the Yeast Genome Order Browser and for sharing his analysis of the evolutionary histories of subtelomeric proteins. We also thank members of the Singh and Pollard groups for helpful comments and discussions. KSP thanks the National Institute of General Medical Sciences (grant GM82901) and is an Alfred P. Sloan Foundation Fellow. MS thanks the NIH for grant GM076275 and the NSF for grant ABI-0850063. JAC was supported by NIH grant GM076275, NIGMS grant GM82901, and the Quantitative and Computational Biology Program NIH grant T32 HG003284.
Author details 1
Gladstone Institutes, University of California, San Francisco, 1650 Owens St, San Francisco, CA 94158, USA.2Department of Computer Science and
Lewis-Sigler Institute for Integrative Genomics, Princeton University, 35 Olden St, Princeton, NJ 08544, USA.
Authors’contributions
JAC conceived the study and carried out the experiments. JAC, KSP, and MS designed the experiments, interpreted the results, and wrote the paper. All authors have read and approved the final manuscript.
Received: 8 July 2010 Revised: 18 November 2010 Accepted: 27 December 2010 Published: 27 December 2010
References
1. Jordan IK, Makarova KS, Spouge JL, Wolf YI, Koonin EV:Lineage-specific gene expansions in bacterial and archaeal genomes.Genome Res2001,
11:555-565.
2. Blomme T, Vandepoele K, Bodt SD, Simillion C, Maere S, de Peer Y:The gain and loss of genes during 600 million years of vertebrate evolution.
Genome Biol2006,7:R43.
3. Cornell MJ, Alam I, Soanes DM, Wong HM, Hedeler C, Paton NW, Rattray M, Hubbard SJ, Talbot NJ, Oliver SG:Comparative genome analysis across a kingdom of eukaryotic organisms: specialization and diversification in the Fungi.Genome Res2007,17:1809-1822.
4. Kasuga T, Mannhaupt G, Glass NL, Aramayo R:Relationship between phylogenetic distribution and genomic features inNeurospora crassa.
PLoS ONE2009,4:e5286.
5. van Passel M, Marri P, Ochman H:The emergence and fate of horizontally acquired genes inEscherichia coli.PLoS Comput Biol2008,4:e1000059. 6. Toll-Riera M, Bosch N, Bellora N, Castelo R, Armengol L, Estivill X, Alba MM:
Origin of primate orphan genes: a comparative genomics approach.Mol Biol Evol2009,26:603-612.
7. Han MV, Demuth JP, McGrath CL, Casola C, Hahn MW:Adaptive evolution of young gene duplicates in mammals.Genome Res2009,19:859-867. 8. Long M, Betran E, Thornton K, Wang W:The origin of new genes:
glimpses from the young and old.Nat Rev Genet2003,4:865-875. 9. Ohno S:Evolution by Gene DuplicationNew York: Springer-Verlag; 1970. 10. Giacomelli MG, Hancock AS, Masel J:The conversion of 3’UTRs into
coding regions.Mol Biol Evol2007,24:457-464.
11. Cai J, Zhao R, Jiang H, Wang W:De novoorigination of a new protein-coding gene inSaccharomyces cerevisiae.Genetics2008,179:487-496. 12. Li D, Dong Y, Jiang Y, Jiang H, Cai J, Wang W:A de novo originated gene
depresses budding yeast mating pathway and is repressed by the protein encoded by its antisense strand.Cell Research2010,20:408-420. 13. Levine M, Jones C, Kern A, Lindfors H, Begun D:Novel genes derived
from non-coding DNA inDrosophila melanogasterare frequently X-linked and show testis-biased expression.Proc Natl Acad Sci USA2006,
103:9935-9939.
14. Begun D, Lindfors H, Kern A, Jones C:Evidence for de novo evolution of testis-expressed genes in theDrosophila yakuba/Drosophila erectaclade.
Genetics2007,176:1131-1137.
15. Zhou Q, Zhang G, Zhang Y, Xu S, Zhao R, Zhan Z, Li X, Ding Y, Yang S, Wang W:On the origin of new genes inDrosophila.Genome Res2008,
18:1446-1455.
16. Knowles DG, McLysaght A:Recentde novoorigin of human protein-coding genes.Genome Res2009,19:1752-1759.
17. Li CY, Zhang Y, Wang Z, Zhang Y, Cao C, Zhang PW, Lu SJ, Li XM, Yu Q, Zheng X, Du Q, Uhl GR, Liu QR, Wei L:A human-specificde novo protein-coding gene associated with human brain functions.PLoS Comput Biol
2010,6:e1000734.
18. Fischer D, Eisenberg D:Finding families for genomic orfans.Bioinformatics
1999,15:759-762.
19. Siew N, Fischer D:Analysis of singleton ORFans in fully sequenced microbial genomes.Proteins2003,53:241-251.
20. Siew N, Fischer D:Unraveling the ORFan puzzle.Comp Funct Genom2003,
4:432-441.
21. Khalturin K, Hemmrich G, Fraune S, Augustin R, Bosch TC:More than just orphans: are taxonomically-restricted genes important in evolution?
Trends Genet2009,25:404-413.
22. Katju V, Lynch M:The structure and early evolution of recently arisen gene duplicates in theCaenorhabditis elegansgenome.Genetics2003,
165:1793-1803.
23. Zhang J:Evolution by gene duplication: an update.Trends Ecol Evol2003,
18:292-298.
24. Jordan IK, Wolf Y, Koonin E:Duplicated genes evolve slower than singletons despite the initial rate increase.BMC Evol Biol2004,4:22. 25. Wapinski I, Pfeffer A, Friedman N, Regev A:Natural history and
evolutionary principles of gene duplication in fungi.Nature2007,
449:54-61.
26. Conant GC, Wolfe KH:Turning a hobby into a job: how duplicated genes find new functions.Nat Rev Genet2008,9:938-950.
27. Katju V, Farslow J, Bergthorsson U:Variation in gene duplicates with low synonymous divergence inSaccharomyces cerevisiaerelative to
Caenorhabditis elegans.Genome Biol2009,10:R75.
28. Davis J, Petrov D:Do disparate mechanisms of duplication add similar genes to the genome?Trends Genet2005,21:548-551.
29. Scannell DR, Frank AC, Conant GC, Byrne KP, Woolfit M, Wolfe KH:
Independent sorting-out of thousands of duplicated gene pairs in two yeast species descended from a whole-genome duplication.Proc Natl Acad Sci USA2007,104:8397-8402.
30. Makino T, Hokamp K, McLysaght A:The complex relationship of gene duplication and essentiality.Trends Genet2009,25:152-155.
31. Kellis M, Birren BW, Lander ES:Proof and evolutionary analysis of ancient genome duplication in the yeastSaccharomyces cerevisiae.Nature2004,
428:617-624.
32. Piskur J:Origin of the duplicated regions in the yeast genomes.Trends Genet2001,17:302-303.
33. Piskur J, Rozpedowska E, Polakova S, Merico A, Compagno C:How did
Saccharomycesevolve to become a good brewer?Trends Genet2006,
22:183-186.
34. Guan Y, Dunham MJ, Troyanskaya OG:Functional analysis of gene duplications inSaccharomyces cerevisiae.Genetics2007,175:933-943. 35. Papp B, Pal C, Hurst LD:Dosage sensitivity and the evolution of gene
families in yeast.Nature2003,424:194-197.
36. Beltrao P, Serrano L:Specificity and evolvability in eukaryotic protein interaction networks.PLoS Comput Biol2007,3:e25.
37. Altenho AM, Dessimoz C:Phylogenetic and functional assessment of orthologs inference projects and methods.PLoS Comput Biol2009,5: e1000262.
38. Han M, Hahn M:Identifying parent-daughter relationships among duplicated genes.Pac Symp Biocomput2009,14:114-125.
39. Gordon JL, Byrne KP, Wolfe KH:Additions, losses, and rearrangements on the evolutionary route from a reconstructed ancestor to the modern
Saccharomyces cerevisiaegenome.PLoS Genetics2009,5:e1000485. 40. Heinicke S, Livstone MS, Lu C, Oughtred R, Kang F, Angiuoli SV, White O,
Botstein D, Dolinski K:The Princeton Protein Orthology Database (P-POD): a comparative genomics analysis tool for biologists.PLoS ONE2007,2: e766.
41. Princeton Protein Orthology Database.[http://ppod.princeton.edu/]. 42. Wapinski I, Pfeffer A, Friedman N, Regev A:Automatic genome-wide reconstruction of phylogenetic gene trees.Bioinformatics2007,23: i549-i558.
43. Cherry J, Adler C, Ball C, Chervitz SA, Dwight S, Hester E, Jia Y, Juvik G, Roe T, Schroeder M, Weng S, Botstein D:SGD: Saccharomyces Genome Database.Nucleic Acids Res1998,26:73-79.
45. Finn RD, Tate J, Mistry J, Coggill PC, Sammut SJ, Hotz HR, Ceric G, Forslund K, Eddy SR, Sonnhammer ELL, Bateman A:The Pfam protein families database.Nucleic Acids Res2008,36:D281-D288.
46. Giaever G, Chu AM, Ni L, Connelly C, Riles L, Veronneau S, Dow S, Lucau-Danila A, Anderson K, Andre B, Arkin AP, Astromoff A, El Bakkoury M, Bangham R, Benito R, Brachat S, Campanaro S, Curtiss M, Davis K, Deutschbauer A, Entian KD, Flaherty P, Foury F, Garfinkel DJ, Gerstein M, Gotte D, Guldener U, Hegemann JH, Hempel S, Herman Z,et al:Functional profiling of theSaccharomyces cerevisiaegenome.Nature2002,
418:387-391.
47. Engel SR, Balakrishnan R, Binkley G, Christie KR, Costanzo MC, Dwight SS, Fisk DG, Hirschman JE, Hitz BC, Hong EL, Krieger CJ, Livstone MS, Miyasato SR, Nash R, Oughtred R, Park J, Skrzypek MS, Weng S, Wong ED, Dolinski K, Botstein D, Cherry JM:SaccharomycesGenome Database provides mutant phenotype data.Nucleic Acids Res2010,38:D433-D436. 48. Ashburner M, Ball CA, Blake JA, Botstein D, Butler H, Cherry JM, Davis AP, Dolinski K, Dwight SS, Eppig JT, Harris MA, Hill DP, Issel-Tarver L, Kasarskis A, Lewis S, Matese JC, Richardson JE, Ringwald M, Rubin GM, Sherlock G:Gene ontology: tool for the unification of biology. The Gene Ontology Consortium.Nat Genet2000,25:25-29.
49. Wagner A:The yeast protein interaction network evolves rapidly and contains few redundant duplicate genes.Mol Biol Evol2001,
18:1283-1292.
50. Qin H, Lu HHS, Wu WB, Li W:Evolution of the yeast protein interaction network.Proc Natl Acad Sci USA2003,100:12820-12824.
51. Prachumwat A, Li W:Protein function, connectivity, and duplicability in yeast.Mol Biol Evol2006,23:30-39.
52. Kim PM, Korbel JO, Gerstein MB:Positive selection at the protein network periphery: evaluation in terms of structural constraints and cellular context.Proc Natl Acad Sci USA2007,104:20274-20279.
53. Kafri R, Dahan O, Levy J, Pilpel Y:Preferential protection of protein interaction network hubs in yeast: evolved functionality of genetic redundancy.Proc Natl Acad Sci USA2008,105:1243-1248.
54. Kim WK, Marcotte EM:Age-dependent evolution of the yeast protein interaction network suggests a limited role of gene duplication and divergence.PLoS Comput Biol2008,4:e1000232.
55. Presser A, Elowitz MB, Kellis M, Kishony R:The evolutionary dynamics of theSaccharomyces cerevisiaeprotein interaction network after duplication.Proc Natl Acad Sci USA2008,105:950-954.
56. Zhang Q, Zmasek C, Dishaw L, Mueller MG, Ye Y, Litman G, Godzik A:Novel genes dramatically alter regulatory network topology in amphioxus.
Genome Biol2008,9:R123.
57. Salwinski L, Miller CS, Smith AJ, Pettit FK, Bowie JU, Eisenberg D:The Database of Interacting Proteins: 2004 update.Nucleic Acids Res2004,32: D449-D451.
58. Kim PM, Lu LJ, Xia Y, Gerstein MB:Relating three-dimensional structures to protein networks provides evolutionary insights.Science2006,
314:1938-1941.
59. Jeong H, Mason S, Barabasi A, Oltvai N:Lethality and centrality in protein networks.Nature2001,411:41-42.
60. Fraser H, Hirsh A, Steinmetz L, Scharfe C, Feldman M:Evolutionary rate in the protein interaction network.Science2002,296:750-752.
61. Boyle E, Weng S, Gollub J, Jin H, Botstein D, Cherry J, Sherlock G:GO:: TermFinder - open source software for accessing Gene Ontology information and finding significantly enriched Gene Ontology terms associated with a list of genes.Bioinformatics2004,20:3710-3715. 62. Samanta M, Liang S:Predicting protein functions from redundancies in
large-scale protein interaction networks.Proc Natl Acad Sci USA2003,
100:12579-12583.
63. Wicky S, Frischmuth S, Singer-Kruger B:Bsp1p/Ypr171p is an adapter that directly links some synaptojanin family members to the cortical actin cytoskeleton in yeast.FEBS Letters2003,537:35-41.
64. Froquet R, Cherix N, Birke R, Benghezal M, Cameroni E, Letourneur F, Mosch H, De Virgilio C, Cosson P:Control of cellular physiology by TM9 proteins in yeast andDictyostelium.J Biol Chem2008,283:6764-6772. 65. Davis NG, Horecka J, Sprague G Jr:Cis- and trans-acting functions
required for endocytosis of the yeast pheromone receptors.J Cell Biol
1993,122:53-65.
66. Amerik A, Nowak J, Swaminathan S, Hochstrasser M:The Doa4 deubiquitinating enzyme is functionally linked to the vacuolar protein-sorting and endocytic pathways.Mol Biol Cell2000,11:3365-3380.
67. Babst M, Katzmann D, Estepa-Sabal E, Meerloo T, Emr S:Escrt-III: an endosome-associated heterooligomeric protein complex required for mvb sorting.Dev Cell2002,3:271-282.
68. Hardwick K, Lewis M, Semenza J, Dean N, Pelham H:ERD1, a yeast gene required for the retention of luminal endoplasmic reticulum proteins, affects glycoprotein processing in the Golgi apparatus.EMBO J1990,
9:623-630.
69. Despons L, Wirth B, Louis VL, Potier S, Souciet J:An evolutionary scenario for one of the largest yeast gene families.Trends Genet2006,22:10-15. 70. Olsen V, Cawley N, Brandt J, Egel-Mitani M, Loh Y:Identification and
characterization ofSaccharomyces cerevisiaeyapsin 3, a new member of the yapsin family of aspartic proteases encoded by the YPS3 gene.
Biochem J1999,339:407-411.
71. Terashima H, Fukuchi S, Nakai K, Arisawa M, Hamada K, Yabuki N, Kitada K:
Sequence-based approach for identification of cell wall proteins in
Saccharomyces cerevisiae.Curr Genet2002,40:311-316. 72. Kunarso G, Chia NY, Jeyakani J, Hwang C, Lu X, Chan YS, Ng HH,
Bourque G:Transposable elements have rewired the core regulatory network of human embryonic stem cells.Nat Genet2010,42:631-634. 73. Pellegrini M, Marcotte EM, Thompson MJ, Eisenberg D, Yeates T:Assigning
protein functions by comparative genome analysis: protein phylogenetic profiles.Proc Natl Acad Sci USA1999,96:4285-4288.
74. Eisenberg E, Levanon EY:Preferential attachment in the protein network evolution.Phys Rev Lett2003,91:138701.
75. Vishnoi A, Kryazhimskiy S, Bazykin GA, Hannenhalli S, Plotkin JB:Young proteins experience more variable selection pressures than old proteins.
Genome Res2010,20:1574-1581.
76. Rives AW, Galitski T:Modular organization of cellular networks.Proc Natl Acad Sci USA2003,100:1128-1133.
77. Spirin V, Mirny L:Protein complexes and functional modules in molecular networks.Proc Natl Acad Sci USA2003,100:12123-12128.
78. Solé RV, Pastor-Satorras R, Smith E, Kepler TB:A model of large-scale proteome evolution.Adv Complex Syst2002,5:43-54.
79. Vázquez A, Flammini A, Maritan A, Vespignani A:Modeling of protein interaction networks.Complexus2003,1:38-44.
80. Chen H, Xu L, Gu Z:Regulation dynamics of WGD genes during yeast metabolic oscillation.Mol Biol Evol2008,25:2513-2516.
81. Thomson JM, Gaucher EA, Burgan MF, DeKee DW, Li T, Aris JP, Benner SA:
Resurrecting ancestral alcohol dehydrogenases from yeast.Nat Genet
2005,37:630-635.
82. Li Q, Carvunis A, Yu H, Han JJ, Zhong Q, Simonis N, Tam S, Hao T, Klitgord NJ, Dupuy D, Mou D, Wapinski I, Regev A, Hill DE, Cusick ME, Vidal M:Revisiting theSaccharomyces cerevisiaepredicted ORFeome.
Genome Res2008,18:1294-1303.
83. Breitkreutz BJ, Stark C, Reguly T, Boucher L, Breitkreutz A, Livstone M, Oughtred R, Lackner DH, Bahler J, Wood V, Dolinski K, Tyers M:The BioGRID Interaction Database: 2008 update.Nucleic Acids Res2008,36: D637-D640.
84. Wood V:Schizosaccharomyces pombecomparative genomics: from sequence to systems.InComparative Genomics Using Fungi as Models.
Edited by: Sunnerhagen P, Piskur J. Berlin: Springer; 2006:233-285, [Topics in Current Genetics, vol 15.].
85. Saccharomyces Genome Database.[http://www.yeastgenome.org/]. 86. Byrne KP, Wolfe KH:The Yeast Gene Order Browser: combining curated
homology and syntenic context reveals gene fate in polyploid species.
Genome Res2005,15:1456-1461.
87. Yeast Gene Order Browser.[http://wolfe.gen.tcd.ie/ygob/]. 88. Chen F, Mackey A, Stoeckert CJ, Roos DS:OrthoMCL-DB: querying a
comprehensive multi-species collection of ortholog groups.Nucleic Acids Res2006,34:D363-D368.
89. Alexeyenko A, Tamas I, Liu G, Sonnhammer E:Automatic clustering of orthologs and inparalogs shared by multiple proteomes.Bioinformatics
2006,22:e9-e15.
90. Batada NN, Reguly T, Breitkreutz A, Boucher L, Breitkreutz BJ, Hurst LD, Tyers M:Stratus not altocumulus: a new view of the yeast protein interaction network.PLoS Biol2006,4:e317.
91. Durand D, Hoberman R:Diagnosing duplications - can it be done?Trends Genet2006,22:156-164.
Saccharomycesgenomes by phylogenetic footprinting.Science2003,
301:71-76.
93. Kellis M, Patterson N, Endrizzi M, Birren B, Lander ES:Sequencing and comparison of yeast species to identify genes and regulatory elements.
Nature2003,423:241-254.
94. Fungal Orthogroups.[http://www.broadinstitute.org/regev/orthogroups/]. 95. Brandes U:A faster algorithm for betweenness centrality.J Math Sociol
2001,25:163-177.
96. Hagberg AA, Schult DA, Swart PJ:Exploring network structure, dynamics, and function using NetworkX.InProceedings of the 7th Python in Science Conference (SciPy2008): Pasadena, CA, USAEdited by: Varoquaux G, Vaught T, Millman J 2008, 11-15.
97. Milo R, Shen-Orr S, Itzkovitz S, Kashtan N, Chklovskii D, Alon U:Network motifs: simple building blocks of complex networks.Science2002,
298:824-827.
98. Banks E, Nabieva E, Chazelle B, Singh M:Organization of physical interactomes as uncovered by network schemas.PLoS Comput Biol2008,
4:e1000203.
99. Shannon P, Markiel A, Ozier O, Baliga N, Wang J, Ramage D, Amin N, Schwikowski B, Ideker T:Cytoscape: a software environment for integrated models of biomolecular interaction networks.Genome Res
2003,13:2498-2504.
doi:10.1186/gb-2010-11-12-r127
Cite this article as:Capraet al.:Novel genes exhibit distinct patterns of function acquisition and network integration.Genome Biology201011: R127.
Submit your next manuscript to BioMed Central and take full advantage of:
• Convenient online submission
• Thorough peer review
• No space constraints or color figure charges
• Immediate publication on acceptance
• Inclusion in PubMed, CAS, Scopus and Google Scholar
• Research which is freely available for redistribution