a n a ly si s of vol a til e o r g a n i c
c o m p o u n d s (VOC s) a s p o t e n ti al
b i o m a r k e r s of c a n c e r
S c h m i d t , K a n d Po d m o r e , ID
h t t p :// dx. d oi.o r g / 1 0 . 4 1 7 2 / 2 1 5 5-9 9 2 9 . 1 0 0 0 2 5 3
T i t l e
S oli d p h a s e m i c r o e x t r a c tio n ( S P M E) m e t h o d d e v el o p m e n t
in a n a ly si s of vol a til e o r g a n i c c o m p o u n d s (VOC s) a s
p o t e n ti al b io m a r k e r s of c a n c e r
A u t h o r s
S c h m i d t , K a n d Po d m o r e , ID
Typ e
Ar ticl e
U RL
T hi s v e r si o n is a v ail a bl e a t :
h t t p :// u sir. s alfo r d . a c . u k /i d/ e p ri n t/ 3 5 5 0 6 /
P u b l i s h e d D a t e
2 0 1 5
U S IR is a d i gi t al c oll e c ti o n of t h e r e s e a r c h o u t p u t of t h e U n iv e r si ty of S alfo r d .
W h e r e c o p y ri g h t p e r m i t s , f ull t e x t m a t e r i al h el d i n t h e r e p o si t o r y is m a d e
f r e ely a v ail a bl e o nli n e a n d c a n b e r e a d , d o w nl o a d e d a n d c o pi e d fo r n o
n-c o m m e r n-ci al p r iv a t e s t u d y o r r e s e a r n-c h p u r p o s e s . Pl e a s e n-c h e n-c k t h e m a n u s n-c ri p t
fo r a n y f u r t h e r c o p y ri g h t r e s t r i c ti o n s .
*Corresponding authors: Kamila Schmidt, Biomedical Science Research Centre, School of Environment and Life Sciences, University of Salford, M5 4WT, UK, Tel: 0044 (0) 161 295 4649; E-mail: [email protected]
Received September 29, 2015; Accepted October 18, 2015; Published October
21, 2015
Citation: Schmidt K, Podmore I (2015) Solid Phase Microextraction (Spme)
Method Development in Analysis of Volatile Organic Compounds (Vocs) as Potential Biomarkers of Cancer. J Mol Biomark Diagn 6: 253. doi: 10.4172/2155-9929.1000253
Copyright: © 2015 Schmidt K, et al. This is an open-access article distributed under
the terms of the Creative Commons Attribution License, which permits unrestricted use, distribution, and reproduction in any medium, provided the original author and source are credited.
Keywords:
Cancer biomarker; Method development; Solid phase microextraction; Volatile organic compoundsIntroduction
To aid the early detection of cancer which may help in fighting the disease, the discovery of biomarkers is required. Analysis of volatile organic compounds (VOCs) as potential biomarkers of cancer appears to be a very promising approach as it is fast, non-invasive and the cost of sample collection and assay is potentially low. It is thought that the presence of a tumour generates new VOCs, normally not produced by the healthy body, and/or alters the levels of VOCs detected in the body during normal physiological processes. Canine scent detection can distinguish between the various biological samples coming from patients with and without cancer, often with high sensitivity and specificity [1]. Different VOC profiles have been associated with various diseases such as cancer, genetic and metabolic disorders, schizophrenia or infectious diseases [2]. Furthermore, different patterns of VOCs detected in the headspace [HS] of numerous cancerous and non-cancerous cells grown in vitro suggest that potential cancer-specific biomarkers exist [3-5]. The candidate volatile biomarkers, as well as the pros and cons of different biological matrices available for researchers in the quest for the VOC biomarkers of cancer, have been reviewed in ref. [5-10].
The concentrations of the majority of the VOCs occurring in biological samples are relatively low: in the ppm-ppt range in human breath, blood and urine [10-14]. What is more, VOCs are extracted from complex mixtures, therefore before the analysis there is a need for a pre-concentration step to enrich the analytes of interest to a detectable level, as required by the analytical technique to be used. However, pre-concentration itself requires multiple steps, so it is a significant source of errors, resulting in a decrease in the reliability and accuracy of the assay [15]. A decrease in the number of steps of the pre-concentration technique results in better reproducibility and the elimination of interfering compounds. The properties of an ideal device for a sample pre-concentration include simplicity of use, high extraction capacity, high selectivity, speed, efficiency, possible automation and miniaturisation, consideration of the safety of both the environment and the user, and finally compatibility with alternative techniques for separation and detection [16,17]. When compared to the traditional extraction techniques of liquid-liquid extraction and
solid-phase extraction, microextraction techniques exhibit some of these properties very well.
Solid phase microextraction (SPME), invented by Pawliszyn and Arthur in 1989 [18], in particular has become very popular in the field of VOC detection in various matrices and various industries due to the simplicity of the SPME device, automation of the process, the absence of a need for solvents, and its compatibility with both gas chromatography (GC) and liquid chromatography (LC) [19]. SPME, next to purge and trap [PT] employing sorbent tubes (followed by thermal desorption), is the main extraction technique used to date for the collection of VOCs in both in vivo and in vitro studies of potential biomarkers of cancer. SPME has been used in many studies as a technique of extraction of VOCs from such human specimens as breath, urine and blood but also from the HS of the cancer cells in vitro in lung, breast, colon, gastric, skin and renal cancers [20-28]. A review discussing the use of HS-SMPE with GC separation for the extraction of VOCs from bio-fluids and bio-materials has been published by Mills and Walker [29]. Reviews looking at the recent advances in SPME techniques for bioanalytical studies have been published [30,31]. Finally, the theory of SPME has been described previously in ref. [32-36].
This review firstly describes briefly the principles of SPME as an extraction technique. Next it gives a tutorial on the steps in SPME method development, whilst also discussing the particular parameters used by the researchers in studies of cancer-associated potential biomarkers. Finally, it briefly examines alternative extraction techniques.
Solid Phase Microextraction (SPME) Method Development in Analysis of
Volatile Organic Compounds (VOCS) as Potential Biomarkers of Cancer
Kamila Schmidt* and Ian PodmoreBiomedical Science Research Centre, School of Environment and Life Sciences, University of Salford, M5 4WT, Manchester, UK
Abstract
The analysis of volatile organic compounds [VOCs] is an attractive approach to the discovery of potential cancer biomarkers due to its non-invasive nature and potential low costs of sampling and analysis. Solid phase microextraction [SPME] is one of the main extraction techniques used to date for the collection of VOCs from
both in vivo and in vitro samples in studies of potential biomarkers of various types of cancer. It offers simplicity of
Principles of SPME Sampling
The SPME technique consists of three steps. Firstly, the sample is placed in the sampling vial (in the case of liquid or solid samples some gas volume is left above it) and the vial is tightly closed. Here the sample is incubated for a specific period of time at a certain temperature. During the second step, the analytes are adsorbed and/or absorbed onto the fiber. The vial is equilibrated at a constant temperature for the time of extraction. The third step is a desorption of VOCs from the SPME fiber in a hot injector port of a gas chromatograph (Figure 1). In the case of high performance liquid chromatography [HPLC] the SPME fiber is introduced into the desorption chamber of HPLC-SPME interface. The interface is a six port injector valve which has a desorption chamber instead of a sample loop. The VOCs are desorbed from the fiber into the mobile phase in a result of either dynamic or static desorption. In dynamic desorption the analytes are desorbed in the moving stream of mobile phase. In static desorption the fiber is soaked in mobile phase for a specific period of time before the compounds are injected onto the column [37].
SPME is a non-exhaustive equilibrium extraction technique, as only a small portion of the target compound is removed from the sample. During extraction, sample molecules preferentially partition between the matrix, headspace and the stationary phase (in the case of a liquid or solid sample), or between the sample and the stationary phase (gas samples) as a result of absorption and/or adsorption process (this depends on the coating type) [34] (Figure 2). With long enough extraction times, an equilibrium concentration of the analyte is established between the two or three phases. When equilibrium is reached, the exposure of the fiber for a longer period of time does not collect any more analyte [32]. The period after which equilibrium is reached depends on the type of the analytes and extraction conditions, and takes from a few minutes to few hours [29]. The partitioning between the three phases (or two in the case of gas samples) depends on the affinity of the analyte to each of them at equilibrium. After the defined period of extraction the fiber is moved to a GC injector or a HPLC chamber interface. SPME also may be used for pre-equilibrium analyte collection.
Because there are two types of SPME coatings [adorptive (solid) and absorptive (liquid)], the behaviour of the compounds analysed differs (Figure 3). In the process of adsorption, the extraction of the
compounds occurs only on the surface of the coating. The analytes are physically traped or retained by the stationary phase via chemical reactions. The total surface area which is available for adsorption is proportional to the volume of the coating if a constant porosity of the stationary phase is assumed. The amount of analyte adsorbed depends on the initial concentration of the analyte as well as on the concentration of the competitive analyte (competitive displacement reactions). During the absorption process the analytes partition preferentially at equilibrium in the porous material of the liquid polymeric phase. The absorption process also depends on the initial concentration of the analyte in the sample. Again, displacement processes may take place during the absorption, but some studies in water analysis indicate that this is a minor concern in these types of SPME coating [38].
SPME Method Development
Development of the SPME method includes several important considerations: selection of the sampling mode, type of fiber and holder, optimisation of incubation (equilibration), extraction and desorption conditions, and finally the employment of an appropriate calibration procedure [34]. Any given parameter of extraction and desorption must be established experimentally for a given sample and application. These experiments involve the analysis of a series of identical mixtures (samples or prepared mixtures with known amounts of added analytes). The conditions of the extraction and desorption are identical except for the one parameter that is varied. At the end of the series of analyses a plot of the analyte response versus a tested parameter is built and the point where there is no longer an improvement, or there is a lower response, is established. The analysis of the VOCs as potential biomarkers of cancer is usually a profiling of the whole sample and all the analytes present in the sample are of potential interest. Therefore, researchers also compare a tested parameter with the number of analytes detected. A compromise between the various responses for different analytes and the number of analytes detected is reached and this value is used for further studies.
[image:3.595.39.565.566.755.2]An interesting experimental approach towards SPME method development was applied by Monteiro et al. [22]. They used a central composite design (CCD), a multivariate statistical model, to optimise the extraction conditions of VOCs from the urine of the patients with renal cancer. Instead of performing the evaluation of each of the extraction variables (time of incubation, extraction temperature and
time, salt addition) independently, the combinations among them were defined and employed. CCD enabled for the evaluation of the significance of each of the factors as well as the relationships between them. The number of experiments, time and cost was reduced.
SPME Device
The SPME device is composed of the holder and in it, the fiber unit. There are two variants of the SPME holder: one for manual use and one for use with autosamplers or with an HPLC-SPME interface. The fiber assembly consists of a fiber core which is attached via a hub to a stainless steel guiding rod. The guiding rod is enclosed in a hollowed needle that pierces the septum of the vial. During extraction, the fiber is pushed out from this needle and when not in use retracted back. The fiber core is coated with stationary phase (1 or 2 cm long) and made of fused silica (which is relatively easy to break), StableFlex (consisting of 80 µm fused silica with 20 µm plastic polymer, which reduces the chances of breaking the needle but has a thermal limitation of 320 ºC), or metal alloy (no thermal limitations; only to use with MicrosealTM septumless systems) [34]. The fiber assemblies for manual use have
24-gauge needles with an outer diameter of 565 µm, which is the smallest possible size that will still retract the 100 µm thick stationary phase. The smallest possible diameters are required for minimal septa coring to prevent losing the sample. However, the 24-gauge needles are very easy to snap while using an autosampler. For these purposes there are more durable 23-gauge needles available with an outside diameter of 646 µm [34]. On the other hand, 23-gauge needles are recommended for use only with septumless systems. Fiber assemblies are used with sample vials with caps containing thin silicone septa, which seal tightly around the needle during piercing.
The profiling of VOCs in the investigation of cancer biomarkers is dominated by the use of manual SPME. In breath analysis, the reasons for the use of manual SPME are the sample size (e.g. 5L or 1L Tedlar bag) and the need for samples of room air to be taken as a control reference. However, there does not seem to be any obvious explanation for its use while working on other matrices, other than the higher cost of an autosampler. Seven studies to date employing an autosampler were conducted on breath and urine matrices (Table 1). The use of an autosampler enables the testing of a larger number of samples (ninety eight 2 mL vials per tray or thirty two 10/20 mL vials per tray), controlled heating and agitation of a sample during incubation and extraction, pre-conditioning of the SPME fiber before each run after desorption, control of the sampling and injection depth of the fiber and finally the opportunity to build the method by employing sequential methods. All of them aid better accuracy and precision [34].
SPME Sampling Mode
There are three SPME extraction modes: DI (direct immersion) and HS, in which the fiber is introduced directly into the sample and into the air above the sample, respectively; and a membrane protected mode for dirty samples. The analysis of VOCs is performed either by DI for the gaseous matrix, or HS, which is the most efficient mode for the extraction of analytes from complex liquids and solid samples (with high molecular weight interferences such as proteins) and for the collection of volatile compounds in general [34].
SPME Fiber Type
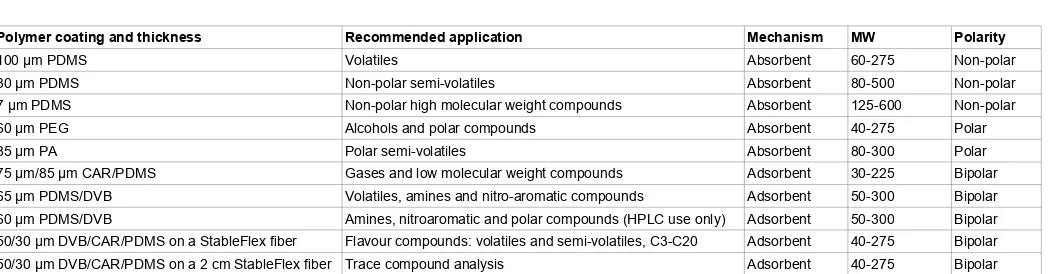
There are four polymers commercially used as SPME stationary phases: divinylbenzene (DVB), polydimethylsiloxane (PDMS), polyacrylate (PA) and carbowax-polyethylene glycol (PEG). They are used on their own (and are available in different thicknesses of a coating) or in combination mixed with carboxen (CAR). The stationary phases differ by polarity (polar, bipolar, non-polar) and extraction mechanism (absorbent or adsorbent). The polarity of the compounds of interest and their molecular weight are factors for choosing of the fiber coating (Table 2).
Absorbent-type Coatings
[image:4.595.41.297.109.480.2]The absorbent is a polymer with liquid properties bonded in various thicknesses to the fiber core. In this type of coating, analytes travel in and out of the stationary phase, which they are attracted to on the basis of their polarity (Figure 3). Retention depends mainly on the thickness of the stationary phase. Larger analyte molecules are retained longer by the coating as they travel through it less quickly than smaller molecules. Coating with thicker phase causes a longer retention of smaller molecules, therefore the choice of the thickness depends on the size of the molecules analysed [34]. There are three commercially available absorbent-type stationary phases: non-polar PDMS, moderately polar PA and polar PEG.
Figure 2: Principles of extraction by headspace-solid phase microextraction
[HS-SPME].
Figure 3: Extraction mechanisms for absorptive (liquid) and adsorptive (solid)
Reference Analysed matrix Fiber, type of holder,fibers tested Extraction procedure details Analytical technique LOD (and scan mode) RSD[%] R2 Scan range [m/z]
Abaffy et al. [39]1
[40]2 tissue
F: PDMS/DVB H: manual
R1: unknown complex matrix: non-polar fiber with broad
selectivity
T1: 75 μm PDMS/CAR
S: 3 mm punch skin biopsy in 1.5 ml vial with 0.3 ml inner tube
E: RT (60 min) D1: ns
D2: 220 ºC (1 min)
GC-QMS/EI
DB-5MS column (25 m x 0.2
mm x 0.33 μm) ns
ns1
8.62 ns 30-300
Barash et al. [41]1
[42]2
cell culture
medium F: DVB/CAR/PDMSH: manual
S: ultra II SKC badge (with the collected HS emitted from the cells in vitro) placed in a thermal desorption device (volume 350 ml or 750 ml) E: 270 ºC (time ns1, 30 min2)
D: 270 ºC (time ns)
GC-QMS/EI
H5-5MS column (30 m x
0.25 mm x 0.25 μm) ns ns ns ns
Buszewski et al.
[43] tissue
F: 75 μm CAR/PDMS
H: manual
S: approx. 2 g of tissue in 20 ml vial
I: 40 ºC (10 min) E: 40 ºC (15 min) D: 200 ºC (1 min)
GC-QMS/EI
CPQ column (25 m x 0.25
mm x 3 μm)
0.6-2.8 ppb
FS 6-10 0.996-0.999 15-220
Buszewski et al. [44]
breath,
tissue F: 75 μm CAR/PDMS H: manual
S: 500 ml [breath] S: size ns [tissue] E: 25 ºC (10 min) [breath] E: 25 ºC (30 min) [tissue] D: 200 ºC (time ns)
GC-QMS/EI
CPQ column (25 m x 0.25
mm x 3 μm) ns ns ns 15-220
Chen et al. [45]
breath, cell culture medium
F: 100 μm PDMS
H: manual
R: VOCs in human breath are non-polar
S: 5L (Tedlar bag) [breath] S: 30 mL in 100 mL glass bottle [cell culture medium] E: 40 ºC (time ns) [breath] E: 37 ºC (40 min, 1100 rpm) [cell culture medium] D: 260 ºC (10 min)
GC-FID
DB-1 column (30 m x 0.25
mm x 0.25 μm) ns ns ns n/a
D’Amico et al. [46] gauze pads that wiped the skin surface F: DVB/CAR/PDMS H: ns
S: gauze pad in 20 ml glass vial
E: RT (15 h) D: 250 ºC (3 min)
GC-QMS/EI
EQUITY-5 column (30 m x
0.25 mm x 0.25 μm) ns ns ns 50 - 550
Deng et al.
[47] blood
F: 75 μm CAR/PDMS
H: manual
T: 100 μm PDMS, PDMS/ DVB, 65 μm CW/DVB, PA
S: 5 ml in 15 ml glass vial E: 60 ºC (15 min, 1100 rpm) D: 250 ºC (30 s)
GC-QMS/EI
HP-5MS column (30 m x
0.25 mm x 0.25 μm
0.026 nM (hexanal) 0.032 nM (heptanal) SIM 4.2 hexanal) 3.6 (heptanal) 0.99 ns Deng and Zhang [48]1
Deng et al. [49]2
blood
F: PDMS/DVB H: manual
R: the best reproducibility for extraction of PFBHA in aqueous solution than other
fibers; aldehydes targeted
OFD: 1 ml of PFBHA (17 mg/ mL), 25 ºC (10 min) S: 1 ml in 8 ml vial E: 60 ºC (8 min, 1100 rpm) D: 270 ºC (2 min)
GC-QMS/EI
HP-5MS column (30 m x
0.25 mm x 0.25 μm)
0.001-0.006 nM1
SIM 0.0006 nM2
(hexanal) 0.005 nM2
(heptanal) SIM
< 61
< 8.52
0.991 0.9942 (hexanal) 0.9962 (heptanal) 41-450 SIM
Fuchs et al. 2010
[50] breath
F: PDMS/DVB H: manual
R: aldehydes targeted
OFD: 50 mg of dry PFBHA, 40 ºC (10 min)
S: 10 ml in 20 ml vial E: 60 ºC (8 min) D: 270 ºC (1 min)
GC-QMS/EI
MDN-5S column (15 m x 0.25 mm x 0.25 μm)
0.0013-0.056 nmol/L (29 ppt – 1.3 ppb) SIM
ns ns SIM
García et al.
[51] breath
F: PDMS/DVB H: manual, automatic
T: 75 μm PDMS/CAR, PDMS
(thickness ns), DVB/CAR/ PDMS
S: 5 L (Tedlar bag) E: 25 ºC (60 min) D: 175 ºC (5 min)
GC-ITMS/EI
VF-5MS column (60 m x 0.25 mm x 0.25 μm)
40 ng mL−1,
(n-hexane)
FS ns ns 35-280
Gaspar et al.
[52] breath
F: 100 μm PDMS
H: manual
R: targeted non-polar hydrocarbons T: DVB/CAR/PDMS
S: 5 L (Tedlar bag) E: 25 ºC (30 min) D: 250 ºC (5 min)
GC-QMS/EI
GC-TOFMS/EI
BPX5 column (30 m × 0.25
mm x 1 μm)
0.04 - 8.0 ppb(TOFMS)
FS
9-26 (TOFMS)
> 0.95 (TOFMS)
40-450 (QMS)
15-220 (TOFMS)
Guadagni et al.
[12] urine
F: PDMS/DVB H: manual
R: aldehydes targeted
S: 3 ml in 10 ml vial (1 g of NaCl, 1 ng µL-1 IS solution)
E: 60 ºC (20 min, ultrasonic bath)
D: 200 ºC (time ns)
GC-QMS/EI
CP-PoraBOND Q column
(25 m x 0.25 mm x 3 μm)
1.1
pg/μlHanai et al. [53]1 [54]2 urine, cell culture medium
F: 2 cm DVB/CAR/PDMS H: automatic
T: CAR/PDMS (thickness ns), PDMS/DVB, PA
S: 200 µl in 2 ml vial I: 45 ºC (10 min) E: 45 ºC (50 min) D: 240 ºC (10 min)
GC-TOFMS/EI Inert-Cap
Pure-WAX T.L. column (60 m + 2 m transfer line x 0.25
mm x 0.5 μm)
ns1
0.004-0.058 µM2
SIM
ns ns> 0.991 2 40-500SIM
Kischkel et
al. [55] breath F: 75 μm CAR/PDMS H: automatic
S: 10 ml in 20 ml glass vial I: 40 ºC (3 min, stirring) E: 40 ºC (7 min) D: 290 ºC (1 min)
GC-ITMS/EI
CP PoraBond Q column (25
m x 0.32 mm x 5 μm)
0.023-1.305
nmol/L SIM ns > 0.91 35-300SIM
Kwak et al.
[25] cell culture medium F: 2 cm DVB/CAR/PDMS
S: 1 ml in 4 ml vial (750 mg of NaCl, pH 2, 3 or 10) E: 37 ºC (30 min, stirring) D: 230 ºC (time ns)
GC-QMS/EI
Stabilwax column
(30 m x 0.32 mm x 1 μm) ns ns ns 41-400
Ligor et al.
[56] breath,tissue F: 75 μm CAR/PDMS H: manual
S: 10 ml [breath] S: 2.5 g in 20 ml glass vial [tissue]
I: 30 ºC (10 min) E: 30 ºC (15 min) D: 200 ºC (1 min)
GC-QMS/EI
CP-PoraBOND Q column
(25 m x 0.25 mm x 3 μm)
1.4-5.0 ppb FS 0.6-0.9 ppb SIM
7-10 0.994-0.999 15-220 SIM
Ligor et al. [26]1
Bajtarevic et al. [57]2
breath F: 75 μm CAR/PDMSH: automatic S: 18 ml in 20 ml vialE: 37 ºC (10 min) D: 290 ºC (1 min)
GC-QMS/EI
CP-PoraBOND Q column
(25 m x 0.32 mm x 5 μm)
0.05 - 15.00 ppb1
FS
0.7 - 17.2 ppb2
FS
ns ns 35-200
Matsumura
et al. [58] urine F: 2 cm DVB/CAR/PDMSH: manual
S: 100 μl in 4 ml glass vial
E: 40 ºC (30 min) D: 230 ºC (5 min)
GC-QMS/EI
Stabilwax column (30 m x
0.32 mm x 1 μm) ns ns ns 41-400
Monteiro et al.
[22] urine
F: PDMS/DVB H: automatic
T: DVB/CAR/PDMS, 100 μm PDMS, 7 μm PDMS, PA
S: 2 ml in 10 ml vial (0.59 g of NaCl, pH 2)
I: 68 ºC (9 min)
E: 68 ºC (24 min, 250 rpm) D: 250 ºC (4 min)
GC-ITMS/EI
VF-5 MS column (30 m x
0.25 mm x 0.25 μm) ns ns ns 40-400
Poli et al.
[59] breath F: 75 μm CAR/PDMS H: manual
S: 150 ml (using Bio-VOC® breath sampler)
E: 22 ºC (30 min) D: 280 ºC (5 min)
GC-QMS/EI
Equity™-1 column
(30 m x 0.25 mm x 1 μm)
10 -12 M
FS 3.1–13.7 > 0.98 40-350
Poli et al.
[60] breath F: PDMS/DVB H: manual
OFD: 1 ml of PFBHA (17 mg/ mL), RT (10 min, stirring) S: 150 ml (using Bio-VOC® breath sampler)
E: RT (45 min) D: 280 ºC (time ns)
GC-QMS/EI
HP-5MS column (30 m ×
0.25 mm x 0.50 μm)
0
x 10-12M
SIM 7.2-15.1 0.97-0.99 SIM
Pyo et al.
[61] cell culture medium F: PDMS/DVB H: manual
S: cell culture medium (volume ns) in cell culture
flask (size ns)
E: 40 min (250 ºC) D: 200 ºC (5 min)
GC-QMS/EI
HP-5 column (30 m x 0.32
mm x 0.25 μm)
0.04-0.4 ppb
SIM 1.02-8.23 > 0.99 SIM
Rudnicka et al. [62]1
[63]2
breath F: 75 μm CAR/PDMSH: manual
S1: 10 ml in glass vial
S2: 1 L (Tedlar bag)
E1: 25 ºC (15 min)
E2: 25 ºC (10 min)
D: 200 ºC (2 min)
GC-TOFMS/EI1
GC-QMS/EI 2
CP-PoraBOND Q column
(25 m × 0.25 mm x 3 μm)
0.31-0.75 ppb1 FS 0.02-9.46 ppb2 FS 3.36-9.541 3-102
> 0.981
>0.9942
30-300
Silva et al. [27]
[28] urine
F: 75 μm CAR/PDMS
H: manual
T: 100 μm PDMS, PDMS/
DVB, DVB/CAR/PDMS, 70
μm CW/DVB, PA
S: 4 ml in 8 ml glass vial (0.8 g of NaCl, pH 1-2)
E: 50 ºC (60 min) D: 250 ºC (6 min)
GC-QMS/EI
BP-20 column (30 m × 0.25
mm × 0.25 μm) ns ns ns 30-300
Song et al.
[64] breath F: 75 μm CAR/PDMSH: manual
S: 4 L (Tedlar bag or glass bottle)
E: RT (30 min) D: 250 ºC (time ns)
GC-QMS/EI
RxiTM–5MS column (30 m
× 0.25 mm × 0.25 μm) ns < 6
0.996,
0.988 35-350
Ulanowska et al
[65] breath
F: 75 μm CAR/PDMS
H: manual
T: 85 μm CAR/PDMS, 100 μm
PDMS, PDMS/DVB, PDMS/
DVB (StableFlex), 70 μm CW/
DVB, DVB/CAR/PDMS, PA
S: 500 ml (transferred into 1L Tedlar bag)
E: 25 ºC (10 min) D: 200 ºC (time ns)
GC-QMS/EI
CPQ column (25m×
Adsorbent-type Coatings
In adsorbent-type coatings, solid porous polymer, porous carbon or silica is bonded to a liquid material coated on a fiber core. Sample molecules travel into pores of the adsorbent and may interact with its particles via hydrogen bonding, – bonding or van der Waals interactions (Figure 3). Retention here is based on the size of the sample molecules and then the diameter of the pores and the amount of porosity. Pores are categorised into three types: macro (openings with > 500 Å), meso (openings 20-500 Å) and micro (2-20 Å). A pore retains a sample molecule which is half the size of the pore diameter [34]. There are three commercially available adsorbent-type stationary phases, which were used for the extraction of VOCs: CAR-PDMS, PDMS-DVB and DVB-CAR-PDMS (Table 1).
CAR-PDMS fibers were developed for the extraction of volatile and small analytical molecules. This is because CAR can be produced as a sieve with pores of variable sizes, with the micropores able to retain C3 analytes. DVB polymer has a high amount of micropores and some macropores, so it is mainly used for the extraction of large volatile compounds and semi-volatile analytes. DVB-CAR-PDMS fiber coating was developed because CAR-PDMS fiber is not very efficient for the extraction of higher molecular weight compounds and PDMS-DVB is not very efficient for the desorption of lower molecular weight analytes. The ratio of the two solid materials (CAR and DVB) in the DVB-CAR-PDMS fiber was determined by evaluating what thickness of each coating optimised the extraction of different sized hydrocarbons. The amounts of each compound detected with this fiber was between the
amounts determined with the CAR-PDMS and the PDMS-DVB fibers, so it can be used for the analysis of a wide range of molecular weight compounds [34].
The analysis of volatiles as biomarkers of cancer was performed in most cases with the use of the 75 µm CAR-PDMS fiber regardless of the type of sample tested (Table 1). This fiber was initially developed for the extraction of volatile and small compounds so its use is justified [34]. Tests for the selection of the fiber with the best efficiency for collecting volatile analytes were conducted in some of the studies in Table 1. Such tests involved the introduction of the fiber into a mixture of known concentrations of VOCs commonly detected in human breath and representing different chemical groups [65]. In these tests 75 µm CAR-PDMS was found most often to be the most efficient in terms of total peak area, number of detected compounds and reproducibility (Table 1). PDMS and PA were the fibers with the least efficiency in these tests. The PA coating has a polar affinity and most VOCs in human breath are non-polar. The PDMS fiber is efficient for the collection of hydrocarbons, but perhaps not other VOCs. Interestingly, only Ulanowska et al. [65] compared two thicknesses of the CAR-PDMS type of coating (the 75 µm being slightly more efficient than 85 µm), which perhaps should be considered as a standard test that should be employed, as CAR-PDMS appears to be the most suitable fiber type for VOCs analysis.
DVB-CAR-PDMS was the second most efficient fiber for VOC extraction from different types of matrix [22,27,28,51,65]. This fiber showed a very wide spectrum of detected compounds in the study of Barash et al. [41], where HS-SPME-GC-MS analysis identified 350-400
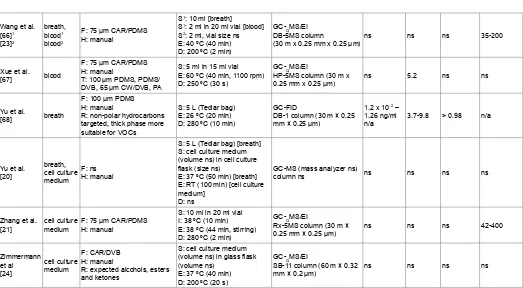
CAR: Carboxen; D: Desorption; DVB: Divinylbenzene; E: Extraction; EI: Electron Ionization, F: SPME Fiber type Used; FID: Flame Ionization Detector, FS: Full Scan; GC: Gas - Chromatography; H: Holder type used; I: Incubation, IT: Ion Trap, LOD: Limit of Detection; M: Matrix; MS: Mass - Spectrometry; n/a: not applicable; ns: not
specified; OFD: on-Fiber Derivatization; PA: Polyacrylate; PDMS: Polydimethylsiloxane; PEG: Carbowax-Polyethylene Glycol; PFBHA: O-(2,3,4,5,6-Pentafluorophenyl)
[image:7.595.44.567.101.389.2]Methylhydroxylamine Hydrochloride; RSD: Relative Standard Deviation; RT: Room Temperature; Q: Quadupole, R2: Coefficient of Determination; R: Reason for the SPME Fiber Selection; S: Sample; SIM: Selected Ion Monitoring; T: SPME fibers that were tested, TOF: Time-Of-Flight; 1 = parameter or result used/obtained in the study or with the use of the matrix with the superscript 1; 2 = Parameter or result used/obtained in the study or with the use of the matrix with the superscript 2.
Table 1: Demonstrates the analysed matrix, the type of fiber and holder used, the extraction conditions, the applied separation and the detection system, and the achieved
methodvalidation parameters in the studies investigating potential biomarkers of cancer performed to date. Wang et al.
[66]1
[23]2
breath, blood1
blood2
F: 75 μm CAR/PDMS
H: manual
S1: 10 ml [breath]
S1: 2 ml in 20 ml vial [blood]
S2: 2 ml, vial size ns
E: 40 ºC (40 min) D: 200 ºC (2 min)
GC-QMS/EI
DB-5MS column
(30 m x 0.25 mm x 0.25 μm)ns ns ns 35-200
Xue et al.
[67] blood
F: 75 μm CAR/PDMS
H: manual
T: 100 μm PDMS, PDMS/ DVB, 65 μm CW/DVB, PA
S: 5 ml in 15 ml vial E: 60 ºC (40 min, 1100 rpm) D: 250 ºC (30 s)
GC-QMS/EI
HP-5MS column (30 m x
0.25 mm x 0.25 μm) ns 5.2 ns ns
Yu et al.
[68] breath
F: 100 μm PDMS
H: manual
R: non-polar hydrocarbons targeted, thick phase more suitable for VOCs
S: 5 L (Tedlar bag) E: 26 ºC (20 min) D: 280 ºC (10 min)
GC-FID
DB-1 column (30 m × 0.25
mm × 0.25 μm)
1.2 x 10⁻² –
1.26 ng/ml
n/a 3.7-9.8 > 0.98 n/a
Yu et al. [20]
breath, cell culture medium
F: ns H: manual
S: 5 L (Tedlar bag) [breath] S: cell culture medium (volume ns) in cell culture
flask (size ns)
E: 37 ºC (50 min) [breath] E: RT (100 min) [cell culture medium]
D: ns
GC-MS (mass analyzer ns)
column ns ns ns ns ns
Zhang et al.
[21] cell culture medium F: 75 μm CAR/PDMSH: manual
S: 10 ml in 20 ml vial I: 38 ºC (10 min) E: 38 ºC (44 min, stirring) D: 280 ºC (2 min)
GC-QMS/EI
Rx-5MS column (30 m ×
0.25 mm × 0.25 μm) ns ns ns 42-400
Zimmermann et al [24]
cell culture medium
F: CAR/DVB H: manual
R: expected alcohols, esters and ketones
S: cell culture medium
(volume ns) in glass flask
(volume ns) E: 37 ºC (40 min) D: 200 ºC (20 s)
GC-QMS/EI
SB-11 column (60 m × 0.32
different VOCs either produced or consumed by at least one of the investigated seven lung cancer cell lines. However, this group did not try any other fiber coating. Interestingly, in the only test comparing 75 µm CAR/PDMS with 2 cm DVB/CAR/PDMS fiber, the latter had better efficiency [53,54].
The PDMS-DVB fiber was selected in studies targeting aldehydes with on-fiber derivatization with O-(2,3,4,5,6-pentafluorophenyl) methylhydroxylamine hydrochloride (PFBHA) [48-50,60]. This fiber was proven to be the most efficient in loading PFBHA, when different fibers (CAR-PDMS among them) were tested in terms of selectivity (mass loading of PFBHA and peak tailing), reproducibility, and ability to retain the largest amounts of PFBHA [69]. PDMS-DVB fiber has also shown very good sensitivity in a study targeting aldehydes without derivatization [12,22]. The fiber also showed better efficiency than CAR-PDMS for the collection of VOCs in tests where skin tissue was studied [39]. In the study of García et al. [51], both PDMS-DVB and DVB/CAR/PDMS showed a higher number of detected VOCs than 75 µm CAR/PDMS. They had very similar performance with 25 VOCs detected with the use of the former and 24 with the use of the latter. Interestingly, this study shows that the different fiber types can be used complementarily as they detect different compounds (eg. ethyl acetate and estirene being detected solely by PDMS-DVB, and bromodichloromethane and isooctane only by DVB/CAR/PDMS).
100 µm PDMS was the fiber of choice in studies where non-polar hydrocarbons only were targeted and has shown relatively low limits of detection (LODs) (Table 1). In addition, it was more efficient for these analytes when tested along with 1 cm DVB-CAR-PDMS [52].
Extraction Time and Temperature
Extraction time is usually the most time-limiting factor in SPME, and is therefore one of the main parameters to optimise. It might be shortened by efficient agitation of aqueous solutions and/or elevation of temperature. However, although higher temperatures result in the more efficient release of compounds from the matrix, an increase in temperature simultaneously causes loss of sensitivity as distribution constants decrease i.e. equilibrium is reached faster but the amount of analyte extracted is smaller at this equilibrium [34]. Therefore, the selection of the time of extraction is a compromise between the sensitivity, length and repeatability of the method. Agitation reduces the time it takes for equilibrium to be reached, and improves sensitivity in pre-equilibrium extraction, as it enhances the mass transport between the sample and the stationary phase of a fiber.
For the in vitro and in vivo studies of potential cancer biomarkers
various sample times were employed ranging from 15 hr to 10 min (Table 1). They depend on the temperature, sample volume and matrix conditions employed during extraction.
Matrix Conditions
Better sensitivity of the SPME method may be achieved by optimisation of the matrix conditions which include sample volume (in the case of HS extraction), temperature, pH, ionic strength, sample agitation and the addition of an organic modifier. Salt addition (increase of ionic strength) and pH adjustment are common techniques for the enhancement of the extraction efficiency of organic analytes from aqueous solutions [34].
Sample volume
Phase ratio is the proportion of gaseous volume to the sample volume in the vial. The lower the values of phase ratio, the better the sensitivity of the HS method. Therefore, the HS volume should be as small as possible in order to achieve higher sensitivity, as equilibration time is reduced and the mass of compound extracted by fiber increases thereby improving detection limits [70]. The larger the HS volume, the more of the analysed compound goes into the HS, and the less goes onto the SPME fiber and remains in the liquid phase [71].
Salt addition
The ionic strength of the sample is modified by the addition of salt and it may influence the extraction in two ways: modifying the properties of the phase boundary or a “salting-out” effect. The latter refers to the process of decreasing the solubility of hydrophobic analytes in the aqueous phase, and is more often observed. The sensitivity of HS analytical methods is widely enhanced by the “salting-out” effect [71]. The process improves sensitivity through the formation of hydration spheres by water molecules with salt ions. This effect drives the additional sample molecules into the HS due to a reduction in the concentration of water molecules available for dissolving analysed compounds. However with a higher concentration of salts an opposite process may occur. Electrostatic interactions of analyte molecules with the ionic salt molecules in the solution may reduce their movement into the HS [32]. In general, salt addition increases the extraction of polar compounds. However, it has no significant effect on non-polar compounds.
Salt was added to the urine samples in the studies of Silva et al. [27,28], however they did not test the efficiency of extraction with higher or lower amounts of salt. The optimum amount of salt found with the use of CCD was 0.59 g per 2 ml of urine [22]. The “salting
Polymer coating and thickness Recommended application Mechanism MW Polarity
100 µm PDMS Volatiles Absorbent 60-275 Non-polar
30 µm PDMS Non-polar semi-volatiles Absorbent 80-500 Non-polar
7 µm PDMS Non-polar high molecular weight compounds Absorbent 125-600 Non-polar
60 µm PEG Alcohols and polar compounds Absorbent 40-275 Polar
85 µm PA Polar semi-volatiles Absorbent 80-300 Polar
75 µm/85 µm CAR/PDMS Gases and low molecular weight compounds Adsorbent 30-225 Bipolar
65 µm PDMS/DVB Volatiles, amines and nitro-aromatic compounds Adsorbent 50-300 Bipolar
60 µm PDMS/DVB Amines, nitroaromatic and polar compounds (HPLC use only) Adsorbent 50-300 Bipolar
50/30 µm DVB/CAR/PDMS on a StableFlex fiber Flavour compounds: volatiles and semi-volatiles, C3-C20 Adsorbent 40-275 Bipolar
[image:8.595.46.574.101.238.2]50/30 µm DVB/CAR/PDMS on a 2 cm StableFlex fiber Trace compound analysis Adsorbent 40-275 Bipolar CAR: Carboxen; PDMS: Polydimethylsiloxane; DVB: Divinylbenzene; HPLC: High Performance Liquid Chromatography; PA: Polyacrylate; PEG: Carbowax-Polyethylene Glycol [19].
out” effect was tested in another study, where different amounts of sodium chloride were added to urine samples and then signal to noise ratio values of all the analytes were examined. Salt addition improved the extraction recovery and sensitivity of the method [12]. The blood matrix has not been treated with salts as this could result in clot formation unless the blood sample is deproteinisated [34].
pH adjustment
pH adjustment may improve method sensitivity through conversion of the ion species into neutral forms. Only the neutral/ undissocated species of compounds are adsorbed/absorbed from the HS by the SPME fiber. Low pH values will benefit the extraction of acidic analytes, and high values will increase the extraction efficiency of basic compounds. Kwak et al. [25] reported that some organic acids were major VOCs detected at low pH value and were barely visible in chromatogram obtained in neutral conditions. On the other hand, the intensities of many other compounds decreased with a reduction of pH. Acidic pH (pH 2) was found to be the optimum, both in terms of the total number of the detected compounds and the total chromatographic peak area obtained, for the extraction of VOCs from the urine samples by Monteiro et al. [22]. Silva et al. [27,28] also adjusted urine samples to 1-2 pH. The group did not test, however, neutral or high pH values to establish the optimum pH of extraction.
Desorption
Desorption times used in VOC studies of cancer vary greatly from 20 s (at 200°C) to 10 min (at 240°C). In general, an increase of the injector temperature reduces desorption time. Maximum fiber coating durability may be achieved by minimizing the temperature and time of desorpton. On the other hand both parameters must be compromised to prevent an analyte carry-over. In general, when the temperature of the injector port is 200°C, desorption time is approximately 1 second for a 100 µm coating for low molecular mass compounds such as VOCs. Desorption is successfully carried out by the generation of a high linear flow rate, which ensures that the desorpted compound is removed immediately from the stationary phase of a fiber [34]. As there is no solvent use with SPME, the desorption is usually performed in splitess mode aiding sensitivity [19].
The desorption time has been optimised in one study in Table 2 by determination of the sum of peak areas yielded under different desorption times (10, 20, 30, 40, 60, 90 and 120 s at 250ºC) [67]. Holding the SPME fiber in the injector port for longer than 30 s did not result in further improvement of the detector’s response. Therefore 30 s has been chosen for all subsequent experiments.
Calibration
SPME as a non-exhaustive method needs careful selection of calibration for quantitative analysis. Quantification of analytes in SPME is based on the principle that the amount of compound extracted onto the stationary phase is linearly proportional to the compound concentration in the sample. There are several calibration methods available for SPME [72]. Studies of VOCs as cancer biomarkers where quantification has been performed used mainly the external standards method of calibration (Table 1). This is acceptable as long as blank sample matrices are available. These blank samples are breath, blood and urine from healthy patients and pure culture medium for in vitro studies (medium incubated for the same amount of time as the in vitro grown cells). Alternatively a method of internal standard addition may be used. Here, however, one must be sure that a chosen internal standard is affected by matrix in the same way as compounds of interest [73].
In some sample types, such as urine or cell culture medium, matrix effects are expected as the composition of the matrix is not entirely known. Here a standard addition method of calibration should be used. For example Pyo et al. [61] investigated VOCs present in the HS of the lung cancer cells grown in vitro. For method validation the researchers prepared the mixture of standard solution in methanol (external standards method of calibration). Here the slope of the calibration graph could potentially differ from the one obtained with the use of the standard addition method (performed in the cell culture medium as a matrix). This is because the partition coefficients of analytes depend on the composition of the matrix and polarity of the compounds [73]. They are different for methanol and cell culture medium. In addition, methanol could potentially compete with the analytes for the places of absorption and/ or adsorption on the SPME fiber.
Method validation
Once the SPME parameters are optimised, the method should be tested for a particular application. The tests using optimal extraction conditions should include evaluation of the limits of detection (LOD) and quantitation (LOQ), precision and accuracy of the method, method selectivity and linear dynamic range.
There are different definitions of the LOD in literature [12,74,75]. In the studies, where the LOD level was specified, it was calculated on the basis of ion signal to noise ratio = 3 (Table 1). The SPME methods used by researchers in the studies summarised in Table 1 differ in their sensitivity, accuracy and precision. These variations are probably the results of differences in the fiber used, the analytical instrument used for detection and separation of VOCs, and the choice of equilibrium or pre-equilibrium times of extraction.
According to the Food and Drug Administration [75], for the bioanalytical methods the determined precision should not exceed 15% of the coefficient of variation (also known as relative standard deviation, RSD). The coefficient of determination (denoted as R2) indicates how well the data fits a linearity curve. The R2 value for a calibration curve should be ≥0.997 for the linearity of the analytical method to be achieved [76]. The RSD values in most of the studies presented in Table 1 were < 10% indicating a very good level of precision for these SPME methods. SPME experiments that included derivatization were shown to have higher RSD values, probably due to the additional preparation step. The R2 values were > 0.997 for most of the VOCs in these studies showing very good accuracy of the data models.
SPME versus other extraction techniques
Other drawbacks of SPME include: ease of the breakage of the fiber, stripping of the coatings, and relatively expensive cost of a fiber assembly. Nevertheless, SPME is an attractive alternative to PT due to its lower cost in hardware (no need for a special desorption unit to be installed, nor is there any requirement for the pump or vacuum devices that are required for PT). Sorbent tubes are also relatively expensive. In addition, some sorbents have high affinity to water which may cause column degradation [79].
Other extraction techniques used in the analysis of VOCs in cancer studies include the needle trap device (NTD) and single drop microextraction (SDME) [80,81]. The NTD contains a sorbent trap inside a needle. The analytes present in a liquid or a gas sample can be actively drawn into and out of the needle using a syringe or a pump, or passively be introduced via the diffusion process. This technique (as in the case of PT) is exhaustive and can achieve similar limits of detection to SPME (high-medium ppt range in SIM mode) [56,80]. SDME, in which a small drop of solvent (around 2 µl) is suspended from the tip of the needle where the compounds are extracted from the headspace, offers relatively low costs, simplicity and elimination of carry over. With the use of in-drop derivatization, SDME offers limits of detection in low ppb range (in SIM mode) [82].
Other commercially available microextraction techniques that could be potentially used in the analysis of VOCs in cancer studies include Stir bar sorptive extraction (SBSE) and Monolithic material sorptive extraction (MMSE, also called MonoTraps). Both techniques, as in the case of SPME, rely on partitioning of analytes between a stationary phase and a sample matrix. In SBSE the analytes are extracted by a stir bar, coated with a stationary phase, in the aqueous solution. However, a stir bar has been previously used also for the HS extraction of volatiles [83]. SBSE technology requires relatively expensive instrumentation (a special thermal desorption unit) and the bars are available with three types of coatings: PDMS, PA and ethylene glycol (EG)-silicone. The extraction of VOCs with the use of MMSE can be performed either in a HS or a floating mode. MonoTraps are available in two variants: traps for thermal desorption (which requires a thermal desorption unit) or traps for liquid extraction (which makes this variant of MonoTraps relatively cheap). MMSE is also limited in the types of the sorptive material, as there are two types available: one made of silica and the other made of silica with activated carbon. In environmental analysis the use of SBSE for the collection of VOCs from water has yielded LOD in the low ppb range (in full scan mode) [84]. MMSE has shown similar limits of detection to HS-SPME in the study analysing VOCs in wine (low ppm in full scan mode) [85]. But both SBSE and MMSE could show different LODs when applied for the analysis of VOCs in biological specimens.
Conclusions
The VOCs profile of a biological sample potentially can provide useful information about human health. The composition of the compounds will vary depending on the disease. VOCs may therefore serve as potential biomarkers in cancer detection and screening contributing to its early detection and treatment monitoring of various diseases, cancer among them. SPME is one of the main extraction techniques used in the studies analysing volatiles as potential cancer biomarkers. When the extraction of VOCs as potential biomarkers of cancer is an untargeted analysis and, therefore, all the volatile compounds in the sample are of potential interest, fiber selection tests should be routine for a given type of cancer, cell line, matrix used etc. The optimised parameters of extraction and desorption vary
greatly between the studies analysing VOCs-associated with cancer. These parameters depend on the type of the sample, sample size, and analytical technique used. Researchers who performed the tests for the most efficient SPME coating for VOC extraction from different types of matrix in cancer studies, most frequently selected 75 µm CAR-PDMS as the fiber used for further analysis. Use of an autosampler aids reproducibility and quality of analysis. On the other hand, the use of a manual device does not restrict a sample size. SPME is an attractive extraction technique for collection of VOCs from different samples in the studies of cancer as it eliminates the use of solvents, is relatively cheap and simple in use and its sensitivity may be further improved by the development of the new fiber coatings. However, there are competitive extraction techniques available, some of them offering similar limits of detection at a lower price.
References
1. Boedeker E, Friedel G, Walles T (2012) Sniffer dogs as art of bimodal bionic research approach to develop a lung cancer screening. CardioVascular and Thoracic Surgery: 14: 511-515.
2. Buljubasic F, Buchbauer G (2015) The scent of human diseases: a review on
specific volatile organic compounds as diagnostic biomarkers. Flavour and
Fragrance Journal, 30: 5-25.
3. Kalluri U, Naiker M, Myers MA (2014) Cell culture metabolomics in the
diagnosis of lung cancer-the influence of cell culture conditions. Journal of
Breath Research 8: 1-10.
4. Calenic B, Filipiak W, Greabu M, Amann A (2013) Volatile organic compounds expression in different cell types: An in vitro approach. International Journal of Clinical Toxicology, 1: 43-51.
5. Schmidt K, Podmore I (2015) Current challenges in volatile organic compounds (VOCs) analysis as potential biomarkers of cancer. Journal of Biomarkers 2015: 1-16.
6. Queralto N, Berliner AN, Goldsmith B, Martino R, Rhodes P, et al. (2014) Detecting cancer by breath volatile organic compound analysis: a review of array-based sensors. Journal of Breath Biomarkers 8: 1-13.
7. Kataoka H, Saito K, Kato H, Masuda K. (2013) Noninvasive analysis of volatile biomarkers in human emanations for health and early disease diagnosis. Bioanalysis 5: 1443-1459.
8. Shirasu M, Touhara K. (2011) The scent of disease: volatile organic compounds of the human body related to disease and disorder. Journal of Biochemistry 150: 257-266, 2011.
9. Kouremenos KA, Johansson M, Marriott PJ (2012) Advances in gas
chromatographic methods for the identification of biomarkers in cancer. Journal
of Cancer 3: 404-420, 2012.
10. Hakim M, Broza YY, Barash O, Peled N, Phillips, M et al. (2012) Volatile organic compounds of lung cancer and possible biochemical pathways. Chemical Reviews 112: 5949-5966.
11. Mochalski P, King J, Haas M, Unterkofler K, Amann A. et al. (2014) Blood and breath profiles of volatile organic compounds in patients with end-stage renal
disease. BMC Nephrology 15: 1-1.
12. Guadagni R, Miraglia N, Simonelli A, Silvester A., Lamberti M et al. (2011) Solid-phase microextraction-gas chromatography-mass spectrometry method validation for the determination of endogenous substances: urinary hexanal and heptanal as lung tumor biomarkers. Analytica Chimica Acta 701: 29-36. 13. Abbott SM, Elder JB, Španel P, Smith D. (2003) Quantification of acetonitrile
in exhaled breath and urinary headspace using selected ion flow tube mass
spectrometry. International Journal of Mass Spectrometry 228: 655-665. 14. Pandey SK, Kim KH, Choi SO, Sa IY, Oh SY (2013) Major Odorants Released as
Urinary Volatiles by Urinary Incontinent Patients. Sensors 13: 8523-8533, 2013. 15. Kataoka H, Saito K (2011) Recent advances in SPME techniques in biomedical
analysis. Journal of Pharmaceutical and Biomedical Analysis 54: 926-950 16. Kataoka H (2011) Current developments and future trends in Solid-phase
17. Zhang Z, Ma Y, Li G (2013) Progress on the analytical methodology for biological volatile organic compounds. Analytical Methods 5: 20-29.
18. Arthur CL, Pawliszyn J (1990) Solid phase microextraction with thermal
desorption using fused silica optical fibers. Analytical Chemistry 62: 2145-2148.
19. Vas G, Vékey K (2004) Solid phase microextraction: a powerful sample preparation tool prior to mass spectrometric analysis. Journal of Mass Spectrometry 39: 233-254.
20. Yu J, Wang D, Wang L, Wang P, Hu Y (2009) Detection of lung cancer with volatile organic biomarkers in exhaled breath and lung cancer cells. Olfaction and Electronic Nose: Proceedings of the 13 International Symposium on Olfaction and Electronic Nose. AIP Conference Proceedings: 198-201. 21. Zhang Y, Gao G, Liu H, Fu H., Fan J et al. (2014) Identification of Volatile
Biomarkers of Gastric Cancer Cells and Ultrasensitive Electrochemical Detection based on Sensing Interface of Au-Ag Alloy coated MWCNTs. Theranostics 4: 154-162.
22. Monteiro M, Carvalho M, Henrique R, Jeronimo C, Moreira M et al. (2014) Analysis of volatile human urinary metabolome by solid-phase microextraction in combination with gas chromatography-mass spectrometry for biomarker discovery: Application in a pilot study to discriminate patients with renal cell carcinoma. European Journal of Cancer 50: 1993-2002.
23. Wang C, Li P, Kian A, Sun B, Wang X et al. (2014) Blood volatile compounds as biomarkers for colorectal cancer”, Cancer Biology and Therapy 15: 200-206. 24. Zimmermann D, Hartmann M, Moyer MP, Nolte J, Baumbach JI (2007)
Determination of volatile products of human colon cell line metabolism by GC/ MS analysis. Metabolomics 3: 13-17.
25. Kwak J, Gallagher M, Ozdener MH, Wysocki CJ, Goldsmith BR et al (2013) Volatile biomarkers from human melanoma cells. Journal of Chromatography B. Analytical technologies in the biomedical and life sciences 931: 90-96. 26. Ligor T, Ligor M, Amann A, Ager C, Bachler M et al (2008) The analysis of
healthy volunteers' exhaled breath by the use of solid-phase microextraction and GC-MS. Journal of Breath Research 2: 1-8.
27. Silva CL, Passos M, Cȃmara JS (2012) Solid phase microextraction, mass spectrometry and metabolic approaches for detection of potential urinary cancer biomarkers - A powerful strategy for breast cancer diagnosis. Talanta 89: 360-368.
28. Silva CL, Passos M, Cȃmara JS (2011) Investigation of urinary volatile organic metabolites as potential cancer biomarkers by solid-phase microextraction in combination with gas chromatography-mass spectrometry. British Journal of Cancer 105: 1894 - 1904.
29. Mills GA and V. Walker V (2000) Headspace solid-phase microextraction
procedures for gas chromatographic analysis of biological fluids and materials.
Journal of Chromatography A 902: 267-87.
30. Bojko B, Cudjoe E, Gomez-Rios GA, Gorynski K, Jiang R (2012) SPME - Quo vadis?. Analytica Chimica Acta 750: 132- 151.
31. Musteata FM, Pawliszyn J (2007) Bioanalytical applications of solid-phase microextraction. Trends in Analytical Chemistry 26: 36-45.
32. Lord H, Pawliszyn J (2000) Microextraction of drugs. Journal of Chromatography A 902: 17-63.
33. Wang Y, O’Reilly J, Chen Y, Pawliszyn J, (2005) Equilibrium in-fiber
standardisation technique for solid-phase microextraction. Journal of Chromatography A, 1072: 13-17.
34. Pawliszyn J (2009) Handbook of Solid Phase Microextraction. Chemical Industry Press, Waterloo.
35. Tena MT, Carillo D (2007) Multiple solid-phase microextraction: Theory and applications. Trends in Analytical Chemistry 26: 206-214.
36. Wercinski SAS, Pawliszyn J (1999) Solid Phase Microextraction. A Practical guide. Mercel Dekker, Inc, New York.
37. Zambonin CG (2003) coupling solid-phase microextraction to liquid chromatography. A review”, Analytical and Bioanalytical Chemistry 375: 73-80. 38. Pawliszyn J (1999) Applications of Solid Phase Microextraction. Royal Society
of Chemistry, Cambridge.
39. Abaffy T, Duncan R, Riemer DD, Tietje O, Elgart G et al (2010) Differential volatile signatures from skin, naevi and melanoma: A novel approach to detect a pathological process. PlosOne 5: e13813, 2010.
40. Abaffy T, Moller MG, Riemer DD, Milikowski C, DeFazio RA (2013) Comparative analysis of volatile metabolomics signals from melanoma and benign skin: a pilot study. Metabolomics 9: 998-1008.
41. Barash O, Peled N, Hirsch FR, Haick H (2009) Sniffing the unique ‘Odor Print’
of non-small-cell lung cancer with gold nanoparticles. Small, 5: 2618-2624. 42. Barash O, Peled N, Tisch U, Bunn PA, Hirsch FR et al (2012) Classification
of lung cancer histology by gold nanoparticle sensors. Nanomedicine: Nanotechnology, Biology, and Medicine 8: 580-589.
43. Buszewski B, Ulanowska A, Ligor T, Jackowski M, Kłodzinska E et al. (2008) Identification of volatile organic compounds secreted from cancer tissues and
bacterial cultures. Journal of Chromatography B 868: 88-94.
44. Buszewski B, Ulanowska A, Kowalkowski T, Cieliski K (2012) Investigation of lung cancer biomarkers by hyphenated separation techniques and chemometrics. Clinical Chemistry and Laboratory Medicine 50: 573-581. 45. Chen X, Xu F, Wang Y, Pan Y, Lu D et al. (2007) A study of the volatile organic
compounds exhaled by lung cancer cells in vitro for breath diagnosis. Cancer 110: 835-844.
46. D’Amico A, Bono R, Pennazza G, Santonico M, Mantini G et al. (2007)
Identification of melanoma with a gas sensor array. Skin Research and
Technology 14: 226-236.
47. Deng C, Zhang X, Li N (2004) Investigation of volatile biomarkers in lung cancer blood using solid-phase microextraction and capillary gas chromatography-mass spectrometry. Journal of Chromatography B 808: 269-277.
48. Deng C, Zhang X (2004) A simple, rapid and sensitive method for determination of aldehydes in human blood by gas chromatography/ mass spectrometry and
solid-phase microextraction with on-fiber derivatization. Rapid Communications
in Mass Spectrometry 18: 1715-1720.
49. Deng C, Zhang X, and Li N (2004) Development of headspace solid-phase
microextraction with on-fiber derivatization for determination of hexanal
and heptanal in human blood. Journal of Chromatography B: Analytical Technologies in the Biomedical and Life Sciences 813: 47-52.
50. Fuchs P, Loeseken C, Schubert JK, Miekisch M (2010) Breath gas aldehydes as biomarkers of lung cancer. International Journal of Cancer 126: 2663-2670. 51. García RA, Morales V, Martín S, Vilches E, Toledano A (2014) Volatile organic compounds analysis in breath air in healthy volunteers and patients suffering epidermoid laryngeal carcinomas. Chromatographia 77: 501-509.
52. Gaspar EM, Lucena AF, da Costa JD, das Neves HC (2009) Organic metabolites
in exhaled human breath—a multivariate approach for identification of biomarkers in lung disorders. Journal of Chromatography A 1216: 2749-2756.
53. Hanai Y, Shimono K, Oka H, Baba Y, Yamazaki K et al (2012) Analysis of volatile organic compounds released from human lung cancer cells and from the urine of tumorbearing mice. Cancer Cell International 12: 1-12.
54. Hanai Y, Shimono K, Matsumura K, Vachani A, Albelda S et al. (2012b) Urinary volatile compounds as biomarkers for lung cancer. Bioscience, Biotechnology and Biochemistry 76: 679-684.
55. Kischkel S,Miekisch W, Sawacki A, Straker EM, Trefz P et al. (2010) Breath biomarkers for lung cancer detection and assessment of smoking related
effects—confounding variables, influence of normalization and statistical
algorithms. Clinica Chimica Acta 411: 1637-1644.
56. Ligor T, Szeliga J, Jackowski M, Buszewski B (2007) Preliminary study of volatile organic compounds from breath and stomach tissue by means of solid phase microextraction and gas chromatography-mass spectrometry. Journal of Breath Research 1: 016001.
57. Bajtarevic A, Ager C, Pienz M, Klieber M, Schwarz K et al. (2009) Noninvasive detection of lung cancer by analysis of exhaled breath. BMC Cancer 9: 348. 58. Matsumura K, Opiekun M, Oka H, Vachani A, Albelda SM et al. (2010) Urinary
volatile compounds as biomarkers for lung cancer: a proof of principle study using odor signatures in mouse models of lung cancer. PLoS ONE 5: e8819. 59. Poli D, Carbognani P, Corradi M, Goldoni M, Acampa O et al. (2005) Exhaled
volatile organic compounds in patients with non-small cell lung cancer: cross sectional and nested short-term follow-up study. Respiratory Research 6: 71. 60. Poli D, Goldoni M, Corradi M, Acampa O, Carboqnani P et al. (2010)
Determination of aldehydes in exhaled breath of patients with lung cancer by
means of on-fiber-derivatisation SPME-GC/MS,” Journal of Chromatography B:
61. Pyo JS, Ju HK, Park JH, Kwon SW (2008) Determination of volatile biomarkers for apoptosis and necrosis by solid-phase microextraction-gas chromatography/ mass spectrometry: a pharmacometabolomic approach to cisplatin’s cytotoxicity to human lung cancer cell lines. Journal of Chromatography B 876: 170-174. 62. Rudnicka J, Kowalkowski T, Ligor T, Buszewski B (2011) Determination of
volatile organic compounds as biomarkers of lung cancer by SPME-GC-TOF/ MS and chemometrics. Journal of Chromatography B 879: 3360- 3366. 63. Rudnicka J, Walczak M, Kowalkowski T, Jezierski T, Buszewski B (2014)
Determination of volatile organic compounds as potential markers of lung cancer by gas chromatography-mass spectrometry versus trained dogs. Sensors and Actuators B: Chemical 202: 615-621.
64. Song G, Qin T, Liu H, Xu GB, Pan YY et al. (2010) Quantitative breath analysis of volatile organic compounds of lung cancer patients. Lung Cancer 67: 227-231. 65. Ulanowska A, Trawińska E, Sawrycki P, Buszewski, B (2010)
Chemotherapy control by breath profile with application of SPME-GC/
MS method. Journal of Separation Science 35: 2908-13.
66. Wang C, Dong R, Wang X, Lian A, Chi C et al. (2014) Exhaled volatile organic
compounds as lung cancer biomarkers during one-lung ventilation. Scientific
Reports 4: 7312.
67. Xue R, Dong L, Zhang S, Deng C, Liu T et al. (2008) Investigation of volatile biomarkers in liver cancer blood using solid-phase microextraction and gas chromatography/mass spectrometry. Rapid Communications in Mass Spectrometry 22: 1181-1186.
68. Yu H, Xu L, Wang P (2005) Solid phase microextraction for analysis of alkanes and aromatic hydrocarbons in human breath. Journal of Chromatography B: Analytical Technologies in the Biomedical and Life Sciences 826: 69-74. 69. Martos PA, Pawliszyn J (1998) Sampling and determination of formaldehyde
using Solid-phase microextraction with on-fiber derivatization. Analytical
Chemistry 70: 2311-2320.
70. Zhang Z, Pawliszyn J (1993) Headspace solid-phase microextraction. Analytical Chemistry 65: 1843-1852.
71. Yang X, Peppard T (1994) Solid phase microextraction for flavour analysis.
Journal of Agriciculture and Food Chemistry 42: 1925-1930.
72. Ouyang G, Chen Y, Setkova L, Pawliszyn J (2005) Calibration of solid phase microextraction for quantitative analysis by gas chromatography. Journal of Chromatography A 1097: 9-16.
73. Prosen H, Zupancíicí-Kralj L (1999) Solid-phase microextraction. Trends in Analytical Chemistry 18: 272-282.
74. Catalan LJ, Liang V, Jia CQ (2006) Comparison of various detection limit estimates for volatile sulphur compounds by gas chromatography with pulsed
flame photometric detection. Journal of Chromatography A 1136: 89-98.
75. FDA (2001) Guidance for Industry. Bioanalytical Method Validation. U.S. Department of Health and Human Services Food and Drug Administration, Center for Drug Evaluation and Research (CDER), Center for Veterinary Medicine (CVM).
76. Chan CC, Lee YC, Lam H, Zhang XM (2004) Analytical Method Validation and
Instrument Performance Verification, John Wiley & Sons: New Jersey.
77. Di Francesco F, Fuoco R, Trivella MG, Ceccarini A (2005) Breath analysis: trends in techniques and clinical applications. Microchemical Journal 79: 405- 410. 78. Filipiak W, Sponring A, Filipiak A, Ager C, Schubert J et al. (2010) TD-GC-MS
analysis of volatile metabolites of human lung cancer and normal cells in vitro. Cancer Epidemiology Biomarkers and Prevention 19: 182-195.
79. Nollet LML, Toldar, F (2007) Advances in Food Diagnostics. Blackwell, Oxford. 80. Mochalski P, Sponring A, King J, Unterkofler K, Troppmair J, Amann A (2013)
Release and uptake of volatile organic compounds by human hepatocellular carcinoma cells (HepG2) in vitro. Cancer Cell International 13: 72.
81. Li N, Deng C, Yin X, Yao N, Shen X et al. (2005) Gas chromatography-mass spectrometric analysis of hexanal and heptanal in human blood by headspace single-drop microextraction with droplet derivatization. Analytical Biochemistry 342: 318-326.
82. Deng C, Yao N, Li N, Zhang X (2005) Headspace single-drop microextraction with in-drop derivatization for aldehyde analysis. Journal of Separation Science 28: 2301-2305.
83. Bicchi CC, Cordero C, Iori C, Rubiolo P (2000) Headspace Sorptive Extraction (HSSE) in the Headspace Analysis of Aromatic and Medicinal Plants. Journal of High Resolution Chromatography 23: 539-546.
84. David F, Sandra P (2007) Stir bar sorptive extraction for trace analysis. Journal of Chromatography A 1152: 54-69.
85. Gamero A, Wesselink W, deJong C (2013) Comparison of the sensitivity of different aroma extraction techniques in combination with gas chromatography-mass spectrometry to detect minor aroma compounds in wine. Journal of Chromatography A 1272: 1- 7.
Submit your next manuscript and get advantages of OMICS Group submissions
Unique features:
• Increased global visibility of articles through worldwide distribution and indexing • Showcasing recent research output in a timely and updated manner • Special issues on the current trends of scientific research Special features:
• 700 Open Access Journals • 50,000 editorial team • Rapid review process
• Quality and quick editorial, review and publication processing
• Indexing at PubMed (partial), Scopus, DOAJ, EBSCO, Index Copernicus and Google Scholar etc • Sharing Option: Social Networking Enabled
• Authors, Reviewers and Editors rewarded with online Scientific Credits • Better discount for your subsequent articles
Submit your manuscript at: www.editorialmanager.com/pharma
Citation: Schmidt K, Podmore I (2015) Solid Phase Microextraction (Spme)
![Figure 1: Diagram of analysis with solid phase microextaction-gas chromatography-mass spectrometry [SPME-GC-MS] [5].](https://thumb-us.123doks.com/thumbv2/123dok_us/8707220.881000/3.595.39.565.566.755/figure-diagram-analysis-solid-phase-microextaction-chromatography-spectrometry.webp)