comm
en
t
re
v
ie
w
s
re
ports
de
p
o
si
te
d r
e
se
a
rch
refer
e
e
d
re
sear
ch
interacti
o
ns
inf
o
rmation
Optimization of oligonucleotide arrays and RNA amplification
protocols for analysis of transcript structure and alternative splicing
John Castle
¤
, Phil Garrett-Engele
¤
, Christopher D Armour,
Sven J Duenwald, Patrick M Loerch, Michael R Meyer, Eric E Schadt,
Roland Stoughton, Mark L Parrish, Daniel D Shoemaker and
Jason M Johnson
Address: Rosetta Inpharmatics, Merck & Co. Inc., 12040 115th Ave NE, Kirkland, Washington 98034, USA.
¤ These authors contributed equally to this work.
Correspondence: Jason M Johnson. E-mail: [email protected]
© 2003 Castle et al., licensee BioMed Central Ltd. This is an Open Access article: verbatim copying and redistribution of this article are permitted in all media for any purpose, provided this notice is preserved along with the article's original URL.
Optimization of oligonucleotide arrays and RNA amplification protocols for analysis of transcript structure and alternative splicing Microarrays offer a high-resolution means for monitoring pre-mRNA splicing on a genomic scale. We have developed a novel, unbiased amplification protocol that permits labeling of entire transcripts. Also, hybridization conditions, probe characteristics, and analysis algo-rithms were optimized for detection of exons, exon-intron edges, and exon junctions. These optimized protocols can be used to detect small variations and isoform mixtures, map the tissue specificity of known human alternative isoforms, and provide a robust, scalable platform for high-throughput discovery of alternative splicing.
Abstract
Microarrays offer a high-resolution means for monitoring pre-mRNA splicing on a genomic scale. We have developed a novel, unbiased amplification protocol that permits labeling of entire transcripts. Also, hybridization conditions, probe characteristics, and analysis algorithms were optimized for detection of exons, exon-intron edges, and exon junctions. These optimized protocols can be used to detect small variations and isoform mixtures, map the tissue specificity of known human alternative isoforms, and provide a robust, scalable platform for high-throughput discovery of alternative splicing.
Background
As the sequencing of the human and mouse genomes nears completion, the apparently similar number of genes in spe-cies of different complexities suggests that other sources of genomic richness are important, such as gene regulation, post-translational modification, and alternative splicing [1]. Recent estimates from expressed sequence tag (EST) studies indicate that 40-60% of human genes are alternatively spliced [2,3], and in many cases alternative isoforms result in proteins of distinct function [4]. Biologically relevant isoform differences range from subtle, such as a few nucleotides at an alternative 5' or 3' splice site, to skipping several consecutive exons. Variant isoforms can be specific to tissue types or developmental stages and are involved in a large number of normal cellular functions. Defects in splicing also account for a substantial fraction of human genetic disease [5,6].
The most common ways to identify alternative splicing events involve aligning and comparing EST and cDNA sequences from the same gene [2,3,7-16]. These methods are effective, but have significant limitations as a result of biases in tran-script coverage and non-uniformity of tissue libraries or sam-pling [15]. Reverse transcriptase polymerase chain reaction (RT-PCR) experiments followed by sequencing may also be used to discover novel isoforms. This approach can be power-ful for analyzing a few genes in a small number of tissues, but it only provides a limited view of a gene's structure and is labor-intensive and challenging to scale up to thousands of genes and hundreds of tissues.
The highly parallel and sensitive nature of microarrays makes them ideal for monitoring gene expression on a tissue-specific, genome-wide level [17,18]. Initial efforts have Published: 19 September 2003
Genome Biology 2003, 4:R66
Received: 30 May 2003 Revised: 25 July 2003 Accepted: 15 August 2003 The electronic version of this article is the complete one and can be
demonstrated that microarrays can be used to detect pre-mRNA splicing [19-21]. However, these early efforts have sig-nificant limitations. For instance, a typical experiment using oligonucleotide microarrays involves a 3'-biased labeling pro-tocol and by necessity a probe or probes placed near the 3' end of the mRNA transcript [19]. This experimental set-up limits discovery and monitoring of alternatively spliced isoforms to regions near the 3' end of the transcript. Probe placements within the 3' UTR [19], or not including probes spanning exon-exon junctions [17], also limit the types of isoforms that can potentially be monitored and detected. Methods using fiber-optic arrays [20] require pre-selection of known iso-forms of interest and were not designed for novel isoform dis-covery. The utility of probes to exon junctions for measuring intron retention in yeast has been demonstrated [21], but the use of array probes was not experimentally optimized to mon-itor and discover alternatively spliced isoforms in complex human samples. In addition, the RNA labeling approach used in the yeast system would not be appropriate for samples that require an amplification step because of limited tissue or RNA availability.
One contribution of this work is a full-length RNA amplifica-tion protocol that samples complete transcripts. This pro-vides an alternative to standard amplification methods that prime from the 3' poly(A) tail and do not accurately reproduce sequences distant from the 3' end. This new protocol gener-ates sufficient material for several hybridizations from as lit-tle as 5 µg total RNA or 50 ng mRNA as starting material. We also provide the results of array experiments used to define experimental parameters and analysis strategies for mapping intron-exon structure and alternative splicing at high resolu-tion. Together these methods facilitate high-throughput dis-covery of alternative splicing events on a genomic scale.
Results and discussion
Our optimization efforts focused on two well characterized genes, retinoblastoma (RB1) and synexin (ANXA7). We selected RB1 because it has a well characterized genomic region [22] and a relatively large number (27) of exons, whereas ANXA7 has two known isoforms that are differen-tially expressed in smooth and skeletal muscle [23].
We sought to develop and optimize microarray-based meth-ods of determining the structure of transcripts that scale eas-ily to many genes and many tissues. The methods we describe extend expression profiling to sub-exon resolution sufficient for detecting and discriminating between alternative splice forms. As alternative splicing might occur anywhere in a tran-script, it is essential to use a protocol that labels the entire length of a transcript. One solution is simply to random-prime large amounts of mRNA using a one-step reverse tran-scription reaction [17,21]. Although effective, this approach requires more than approximately 1 µg mRNA for every one
to two hybridizations, which is unacceptably high for small or rare tissue samples.
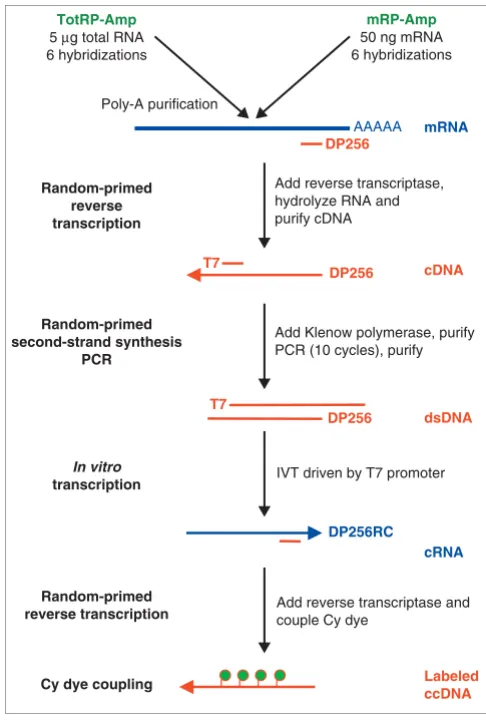
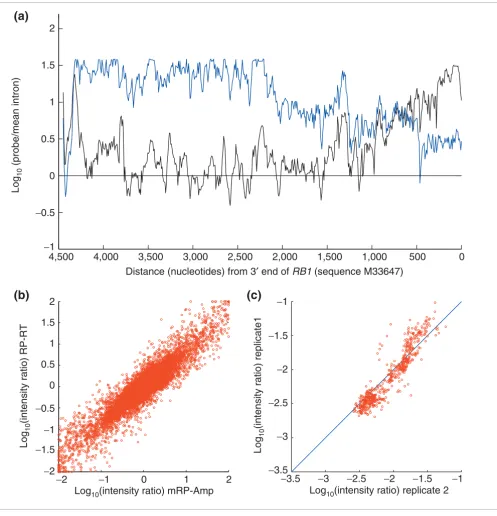
To address the sample-requirement issue, we developed a full-length amplification protocol that combines random-primed first- and second-strand synthesis steps with an amplification strategy that uses both PCR and in vitro tran-scription (IVT) (Figure 1). To verify that this protocol can ade-quately represent entire transcripts, we amplified and labeled Jurkat and K562 samples, and then hybridized both to an array containing overlapping probes that step through the mRNA of RB1. Figure 2 shows the probe intensities across the mRNA transcript for this full-length protocol and for a poly(A) 3'-labeling protocol. Only the full-length protocol amplifies sequences more than 1,000 nucleotides from the 3' transcript end. The reproducibility of the protocol was veri-fied by independently amplifying replicate samples and hybridizing them in opposing dye channels.
[image:2.612.314.557.306.667.2]Flow chart of the full-length amplification and labeling protocol Figure 1
Flow chart of the full-length amplification and labeling protocol. The TotRP-Amp protocol (upper left) starts with total RNA whereas mRP-Amp starts with mRNA. Both methods result in labeled complementary cDNA (ccDNA) sufficient for six hybridizations. dsDNA, double-stranded DNA. See Materials and methods for details.
Random-primed reverse transcription
Cy dye coupling
mRNA
AAAAA
cRNA
IVT driven by T7 promoter
DP256RC
In vitro transcription
Labeled ccDNA
Add reverse transcriptase and couple Cy dye
dsDNA
Add Klenow polymerase, purify PCR (10 cycles), purify
T7
DP256 T7
Random-primed second-strand synthesis
PCR
cDNA
Add reverse transcriptase, hydrolyze RNA and purify cDNA
DP256
DP256
Random-primed reverse transcription
TotRP-Amp 5 µg total RNA 6 hybridizations
mRP-Amp 50 ng mRNA 6 hybridizations
comm
en
t
re
v
ie
w
s
re
ports
refer
e
e
d
re
sear
ch
de
p
o
si
te
d r
e
se
a
rch
interacti
o
ns
inf
o
rmation
Exon definition
Distinguishing exonic regions from intron and intragenic regions is a prerequisite for monitoring transcript structure.
To determine optimal probe length and hybridization condi-tions for detecting and defining exons, we designed tiling arrays with probes placed in one-nucleotide intervals across
[image:3.612.56.553.85.600.2]Comparison of amplification protocols Figure 2
Comparison of amplification protocols. (a) Comparison of the full-length amplification protocol (mRP-Amp, blue) and a 3'-biased amplification protocol (black) of the RB1 gene in the Jurkat cell line. As expected, the 3' protocol amplifies the 3' end well but probe intensities greater than 1,000 nucleotides from the 3' end are near background levels. Background is defined by the mean intensity of 10,700 probes spaced throughout RB1 introns. (b) Comparison of the mRP-Amp protocol to random-primed reverse transcription (RP-RT) alone. The plot shows the log10 intensity ratios between Jurkat and K562 cell lines from 17,000 probes hybridized, where the Jurkat and K562 samples were amplified with either the mRP-Amp protocol (horizontal axis) or a 'gold standard' RP-RT protocol. (c) Two independent mRP-Amp amplifications of Jurkat and K562 cell lines demonstrate protocol reproducibility. Points show log10 intensity ratios of K562 to Jurkat from the probes complementary to the RB1 mRNA sequence.
0 500
1,000 1,500
2,000
−3.5 −3 −2.5 −2 −1.5 −1 2,500
3,000 3,500
4,000 2
1.5
1
0.5
0
−0.5
−1 4,500
Log
10
(probe/mean intron)
Distance (nucleotides) from 3′ end of RB1 (sequence M33647)
Log
10
(intensity ratio) replicate1
Log10(intensity ratio) replicate 2
−2 −1 0 1 2
−1 2
1.5
1
0.5
−0.5
−1
−1.5
−2 0
−1.5
−2
−2.5
−3
−3.5
Log
10
(intensity ratio) RP-RT
Log10(intensity ratio) mRP-Amp
(a)
the entire 180-kilobase (kb) genomic region encoding the RB1
gene. Separate tiling arrays for probe lengths 20, 25, 30, 35, 40, 45, 50, and 60 nucleotides were hybridized with labeled cDNA from two cell lines, Jurkat and K562, over a range of stringencies controlled by adjusting the amount of forma-mide in the hybridization buffer (20, 25, 30, 35, 40, and 45% formamide). We found that detection sensitivity for finding exons within genomic sequence, measured as the ratio between the intensity of probes in exons and probes in introns, peaks near 35% formamide and probe lengths of 50-60 nucleotides. These results are consistent with prior studies with ink-jet arrays [17,24].
Exon-edge detection
Although longer 60-nucleotide 'exon probes' are better for detecting exons, shorter probes or higher formamide concen-trations could be more accurate for pinpointing splice sites between exons and adjacent introns. To optimize detection of exon boundaries, we placed overlapping probes across all exon-intron boundaries at one-nucleotide intervals from 100
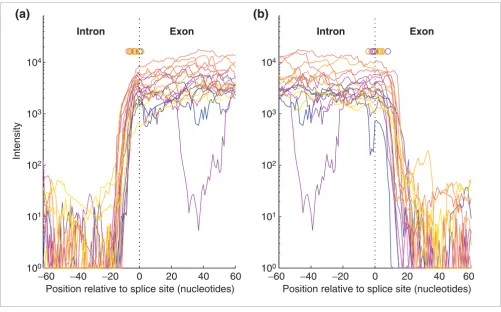
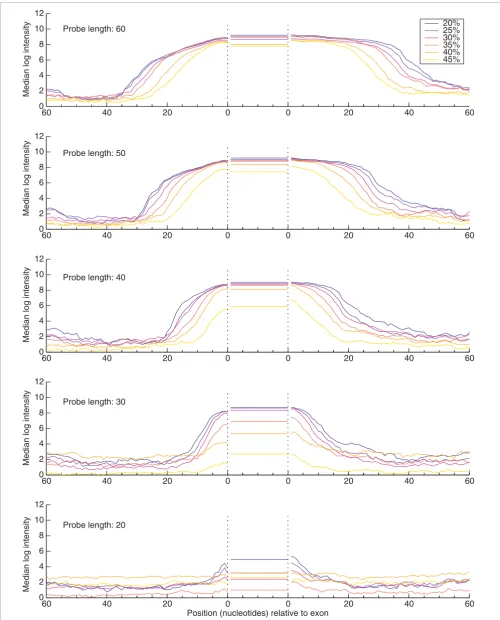
nucleotides within the intron to entirely within the exon, using the 27 exons of RB1 as a test case. We again varied probe length, testing 20-, 25-, 30-, 35-, 40-, 45-, 50-, and 60-nucleotide probes, as well as formamide concentrations, probe-step intervals, and analysis methods. Figure 3 shows the tiling intensity profiles for these 5' and 3' edge probes, using 35-nucleotide probes in 30% formamide. Figure 4 shows the averaged exon-intron edge profile at a range of for-mamide concentrations and probe lengths.
Several conclusions can be drawn from these data. First, exon edges can be clearly identified by tiling at high resolution. Second, the intensities of shorter probes fall off sharply at exon boundaries, which may allow more precise estimates of splice sites (see below). One can also observe in Figure 4 a slight asymmetry in the probe intensity profiles extending from the 5' and 3' sides of the exon. This effect, due to polarity in probe sensitivity with respect to distance from the glass surface, necessitates slightly different edge-detection param-eters for each side of the exon.
Probe-intensity profiles for intron-exon boundaries (edges) of the 27 RB1 exons using 35-nucleotide probes and 30% formamide, where each color
[image:4.612.57.558.85.397.2]represents a single exon Figure 3
Probe-intensity profiles for intron-exon boundaries (edges) of the 27 RB1 exons using 35-nucleotide probes and 30% formamide, where each color represents a single exon. (a) 3' splice sites (5' exon edge); (b) 5' splice sites (3' exon edge). These conditions allow accurate prediction of splice sites. The dashed line marks actual splice sites, by which the exons were aligned, and the small circles mark the predicted splice-site locations for each exon after convolution with the Haar wavelet (see Materials and methods for details). Although the short exon-10 sequence contains several AT-rich regions within the exon which hybridize poorly and create a dip in the intensity profile (lower magenta curve), the splice-site predictions for exon 10 are consistent with the others.
−60 −40 −20 0 20 40 60
−60 −40 −20 0 20 40 60
100
101
102
103
104
100
101
102
103
104
Intensity
Position relative to splice site (nucleotides) Position relative to splice site (nucleotides)
Intron Exon Intron Exon
comm
en
t
re
v
ie
w
s
re
ports
refer
e
e
d
re
sear
ch
de
p
o
si
te
d r
e
se
a
rch
interacti
o
ns
inf
o
rmation
To detect splice sites from tiling data, we tested several edge-detection algorithms, including Gaussian, Haar, and b-spline wavelets; Green's function deconvolution; and simple slope estimates. The Haar wavelet was selected for its performance and simplicity (see Materials and methods). Figure 5 shows the predicted splice site locations for all 27 exons of RB1 rela-tive to the correct location. The predicted locations have a range of only 10-15 nucleotides (SD approximately 5 nucleo-tides). At this resolution, splice-site sequence motifs [25,26] could be used to identify the exact splice site location. The accuracy of array-based predictions is also probe-length dependent, such that 'mid-sized' 35-40-nucleotide probes showed the most consistency over all 5' and 3' splice sites for this microarray platform (Figure 5). Similar optimal parame-ters were found for RB1 in Jurkat cells, where RB1 expression is very high; for RB1 in K562 cells, where its expression is very low; and for ANXA7 in both smooth and skeletal muscle (data not shown).
The accuracy of splice-site detection was also measured for different tiling step intervals. By computationally removing data from the original one-nucleotide step dataset (with 30% formamide and 35-nucleotide probes), we simulated data col-lected from probes at step intervals of 2-10 nucleotides. In Jurkat cells, where RB1 is highly expressed, edge-detection accuracy remains high even as the step interval increased to eight nucleotides between probes. However, in K562, the con-sistency of the predicted location decreased significantly for tiling step intervals greater than five nucleotides, suggesting that this parameter is sensitive to the expression level of the gene. In summary, splice sites can be detected by tiled micro-array 'edge' probes to an accuracy of approximately 10 nucleotides, and step sizes equal to or less than five nucleo-tides are sufficient for this accuracy.
Junction detection
The idea of using probes complimentary to exon-exon junc-tions to monitor splicing was published as early as 2000 [4]. These probes span two exons and should be at maximum intensity only when both exons are present and connected [15,20,21]. Here we show the results of experiments aimed at optimizing the use of junction probes (length, placement, and hybridization stringency) for monitoring alternative splicing.
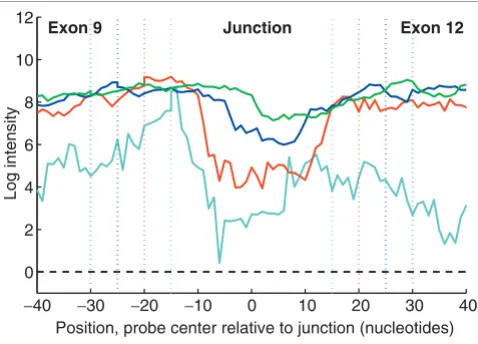
Using the RB1 transcript sequence, we generated arrays with probes of eight different lengths (20-60 nucleotides) placed in one-nucleotide steps across potential exon-exon junctions and hybridized with Jurkat and K562 samples at several for-mamide concentrations. As an example of the results, Figure 6 shows the intensities of the probes tiling across the junc-tions between exon 9 and each of exons 10, 11, 12, and 13. The naturally occurring exon 9 to exon 10 connection has the highest-intensity signal, and centrally positioned probes offer the greatest separation from the non-natural connections. Similar results were found for the other 25 junctions of RB1
(data not shown).
The ability of junction probes to discriminate between true exon-exon connections and false connections varied with probe length (Figure 7). Interestingly, the longest probes tended to show only a small intensity decrease across false junctions - and thus have low specificity - because they have substantial matching segments to each flanking exon. As seen in Figure 7, for example, probes with lengths of 30-40 nucleotides placed near the center of the junction best detect the non-connection of exon 9 and exon 12. We continued this study over all combinations of stringency, probe length, and probe position, and measured the percentage of junction probes that correctly predicted the known exon junction. We found optimal performance between 30 and 40% formamide, 35 to 40 nucleotides in length, and at positions centered over the junction or less than five nucleotides off-center (data not shown). The probe length range agrees with the choice of Clark et al. [21] who used 40-mer probes to study splicing in yeast on a different array platform.
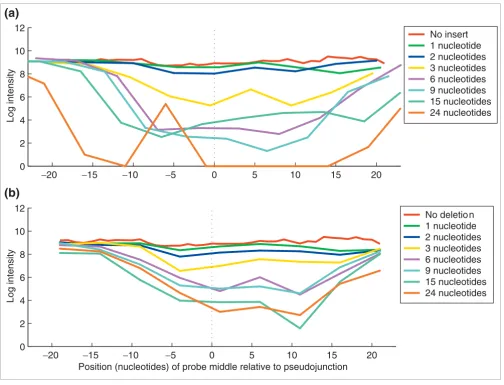
To measure the sensitivity of junction probes to slight changes in splice junction sequence, such as might be produced by an alternative 5' or 3' splice site, we designed probes across com-putationally 'mutated' junctions and tested their detection sen-sitivity to naturally occurring mRNAs. For each of the 26 exon-exon junctions of RB1, we created computational insertions of 1, 2, 3, 6, 9, 15, and 24 random nucleotides and deletions of 1, 2, 3, 6, 9, 15, and 24 nucleotides from each exon to simulate mRNA nucleotide deletions and insertions, respectively. Tiling probes were designed across each of these 'pseudo-junctions' and hybridized with Jurkat mRNA. For most of the junctions, there is a significant intensity reduction from even a single nucleotide insertion or deletion (see Additional data file 1). For others, like the exon 9 to exon 10 junction (Figure 8), differ-ences were detectable for all mutations, but significant inten-sity decreases were observed only when the difference was three nucleotides or larger. Examination of all RB1 junctions indicates that the most sensitive probe location is between the junction center and five nucleotides towards the 3' end (data not shown). We conclude that junction probes of 35 or 40 nucleotides placed near the junction center consistently detect changes of three nucleotides or greater and frequently detect changes of even one or two nucleotides.
Figure 4 (see legend on next page)
60 40 20 0 0 20 40 60
0 2 4 6 8 10 12
Median log intensity
Median log intensity
Median log intensity
Median log intensity
Median log intensity
Position (nucleotides) relative to exon
60 40 20 0 0 20 40 60
0 2 4 6 8 10 12
60 40 20 0 0 20 40 60
0 2 4 6 8 10 12
60 40 20 0 0 20 40 60
0 2 4 6 8 10 12
60 40 20 0 0 20 40 60
0 2 4 6 8 10 12
20% 25% 30% 35% 40% 45% Probe length: 60
Probe length: 50
Probe length: 40
Probe length: 30
comm
en
t
re
v
ie
w
s
re
ports
refer
e
e
d
re
sear
ch
de
p
o
si
te
d r
e
se
a
rch
interacti
o
ns
inf
o
rmation
Alternative splicing of the ANXA7 transcript
The methods described above were then applied to the alter-natively spliced isoforms of ANXA7. Genomic mapping of the
ANXA7 transcript shows 14 exons, and previous studies [23] have shown that a 66-nucleotide exon (exon 6) is absent in smooth muscle but present in skeletal muscle. Tiling arrays were designed with probes placed at one-nucleotide intervals through the 39-kb genomic region of ANXA7. Exon-6 probes had much higher intensities when hybridized with skeletal muscle RNA than with smooth muscle RNA, as expected (data not shown).
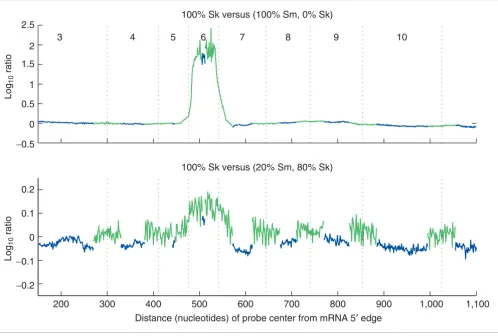
The ability of the exon probes to detect mixtures of two splice forms in a single sample was tested quantitatively by combin-ing fixed ratios of purified ANXA7 mRNA isoforms cloned from smooth and skeletal muscle tissues (see Materials and methods). Hybridization intensities from these samples were compared to those from ANXA7 long form (from skeletal muscle) alone. Figure 9 shows the difference between the two channels: probe intensities outside of exon 6 have similar magnitude, but probes in exon 6 have low intensity in smooth muscle, indicating the absence of this exon. When compared to 100% skeletal muscle (long form), the exon-skipping event can be detected in mixtures as low as 20% short form, 80% long form.
To test if junction probes alone can detect these two isoforms, we generated probes for all combinations of exon junctions in
ANXA7 (exon 1 to exon 2, exon 1 to exon 3,..., exon 1 to exon 14, exon 2 to exon 3, and so on). Figure 10 shows microarray results for both smooth and skeletal muscle. The highest nor-malized probe intensities lie along the diagonal, showing that each exon connects to adjacent exons. For example, in skele-tal muscle, exon 5 connects to exon 6, which connects to exon 7. However, in smooth muscle, the off-diagonal probe repre-senting the exon 5 to exon 7 connection hybridizes strongly while the 5-6 and 6-7 probes do not, confirming that exon 6 is skipped in smooth muscle. The first junction probe (1-2) does not show measurable normalized intensity in either tissue, which could be explained by incorrect sequence for exon 1, poor amplification of that sequence region, unusual sequence composition, or an alternative start site.
Extension to many tissues
The array-based methods described here offer ways to moni-tor transcript structure that scale well to large numbers of tis-sues. Junction probes provide a particularly simple and
Intensity profile of RB1 exon edges in Jurkat cells
Figure 4
Intensity profile of RB1 exon edges in Jurkat cells. Median log intensities from 27 aligned exons show the edge profile for varying probe lengths (from 20 to 60 nucleotides) and formamide concentrations (see key). As the exons have different sizes, the average probe intensity within each exon is reported by a horizontal line between the two '0' points. The horizontal axis indicates the distance between the 5' end of the probe and the splicing acceptor site on the left side of the figure, and the distance between the 3' end of the probe and the splicing donor site on the right side of the figure. RB1 is expressed at low levels in the cell line K562; nevertheless, these edge profiles (data not shown) are similar but with lower intensities.
[image:7.612.312.554.417.589.2]Consistency of predicted splice site locations for the 27 exons of RB1
Figure 5
Consistency of predicted splice site locations for the 27 exons of RB1. (a) Standard deviation of the predicted locations in nucleotides relative to the correct site versus probe length, at 30% formamide using a 50-point Haar wavelet (b). Blue, exon 5' edge (3' splice site); red, exon 3' edge (5' splice site). No knowledge of splice-site sequence motifs (for example, GT-AG) was incorporated into the prediction process.
30 40 50 60
0 5 10 15 20
Standard deviation
(nucleotides)
Probe length (nucleotides)
0 20 40
Haar wavelet
(a)
(b)
Discrimination between present and absent exon-exon junctions in RB1
[image:7.612.55.297.521.659.2]mRNA Figure 6
Discrimination between present and absent exon-exon junctions in RB1 mRNA. Each line shows the intensities of a series of 40-nucleotide probes starting entirely within exon 9 and, at one-nucleotide steps, tiling through the junction between exon 9 and each of exons 10, 11, 12, and 13. Probes on the left side of the plot should hybridize completely within exon 9 and have similar intensities, whereas probes on the far right side (entirely within exons 10, 11, 12, or 13) have intensities that differ because of variations in exon sequence composition. Probes in the central section of the figure are chimeric sequences complementary to portions of two different exons. Probes between non-connected exons (for example, exon 9 and 13) have lower intensities whereas the probes between connected exons (exon 9 and 10) remain at high intensities. Background level is shown by the black dashed line at the bottom of the figure.
−40 −30 −20 −10 0 10 20 30 40
0 2 4 6 8 10 12
Exon 10 Exon 11 Exon 12 Exon 13
Exon 9
Junction
Log intensity
efficient means of detecting alternative splicing events in a high-throughput fashion. To demonstrate this, the splicing of
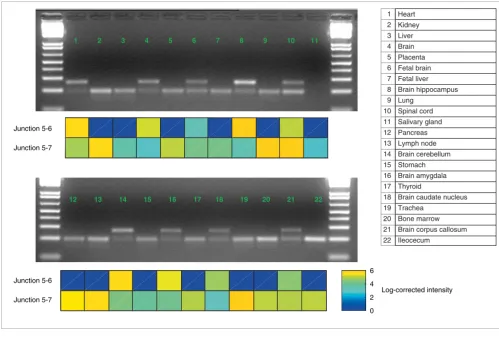
ANXA7 was monitored with junction probes in many differ-ent human mRNA samples, and RT-PCR was used to validate the array-based predictions. Figure 11 shows the RT-PCR and microarray results from 22 tissues. Heart, spinal cord, and many subregions of the brain show evidence of the long iso-form in the array data, whereas other tissues do not. RT-PCR reactions using primers complementary to ANXA7 exons 5 and 7 give product bands that correctly correspond to the two expected isoforms (Figure 11). The correlation between the microarray probe intensities and the products demonstrates that junction probes can effectively discern the tissue distri-butions of alternative isoforms, even in mixtures.
It is straightforward to extend the methods described here to parallel measurements of larger numbers of genes and tis-sues. As exon-exon junction probes can map transcript struc-ture with a small number of probes, the alternative splicing events of thousands of genes can be monitored simultane-ously on the same array. By further modifying the amplifica-tion protocol, we were able to use as little as 50 ng of mRNA or 5 µg of total RNA as input, and we have automated the pro-tocol to amplify and label 96 tissues simultaneously.
In summary, we have developed a protocol for effective full-length RNA labeling and have optimized experimental and computational microarray-based methods for determining
transcript structures at high resolution. With a combination of finely spaced 'exon' and 'intron' probes, 'edge' probes, and 'junction' probes, these methods can: discriminate exons from introns; detect splice sites at less than 10 nucleotides resolution using array data alone; assemble and order exons in a transcript using junction probe intensities; identify changes in exon-exon junctions as small as one to three nucleotides; and detect alternatively spliced isoforms which are tissue-specific or present in mixtures. The experimental and computational methods described here are currently being used to carry out high-throughput detection of alterna-tive splicing events on a genomic scale.
Materials and methods
Genomic mapping and array design
RB1 and ANXA7 mRNA sequences were mapped to genome sequence based on the assembly available though the National Center for Biotechnology Information (NCBI) [11] using sim4 [27]. Repeat sequences were masked using the Scylla repeat-masking program from Paracel (Pasadena, CA) that uses the HASTE algorithm to identify repeat sequences, including both simple and interspersed repeats [28]. Over-lapping probes of lengths 20, 30, 40, 50, and 60 nucleotides were designed at one-nucleotide steps: (1) throughout each exon, (2) across each intron-exon edge, starting approxi-mately 100 nucleotides into the intron, (3) across each exon-exon junction as described in the preceding text, and (4) at 10-nucleotide steps through each intron. For 20-nucleotide probes in ANXA7, for example, this resulted in 1,810 exon probes, 3,156 edge probes, 4,387 junction probes (including modified junctions), and 11,944 intron probes. For 20-nucleotide probes in RB1, this resulted in 4,179 exon probes, 5,852 edge probes, 5,550 junction probes, and 7,529 intron probes. All probes of lengths less than 60 nucleotides were placed on stilts of 10 thymidines. Probe intensities were back-ground corrected and log values were used. Oligonucleotide arrays were synthesized on 1 × 3-inch glass slides with ink-jet technology [24] using mRNA samples obtained from Clon-tech (Palo Alto, CA) and the cell lines Jurkat (T lymphocyte, ATCC no. TIB-152) and K562 (chronic myelogenous leuke-mia, ATCC no. CCL-243).
Preparation of labeled cDNA
Hybridization material was generated through a random-priming amplification procedure (RP-Amp) using primers with a random sequence at the 3' end and a fixed motif at the 5' end. The following amplification protocol generated enough labeled material for approximately 400 hybridiza-tions starting from 1.5 µg of mRNA. shDNP256 (first-strand synthesis): 5'-TAGATGCTGTTGNNNNNNNNN-3', and shT7N9 (second-strand synthesis): 5'-ACTATAGGGA-GANNNNNNNNN-3'. mRNA (1.5 µg) was reverse-tran-scribed with Superscript II and the DP256 random primer for 20 min at 42°C (10 mM DTT, 50 mM Tris-HCl pH 8.3, 75 mM KCl, 8 mM MgCl2, 0.5 mM dNTPs, 5 U/µl Superscript II). The
[image:8.612.58.297.87.259.2]Dependence of negative discrimination on junction probe length Figure 7
Dependence of negative discrimination on junction probe length. Intensity of probes of different length tiled across the junction between exon 9 and exon 12, which are not connected in the RB1 transcript. Light blue, length 30 nucleotides; red, 40; dark blue 50; green, 60. Vertical colored dotted lines mark where probes make a transition from completely within an exon to chimeric junction probes spanning both exons. At 35% formamide, the intensities of the 20-nucleotide probes are largely at background levels and are not shown, while 60-mers (green) show little decrease in signal while spanning a 'false' junction. Background level is shown by the black dashed line at the bottom of the figure.
−40 −30 −20 −10 0 10 20 30 40
Exon 9 Junction Exon 12
Log intensity
Position, probe center relative to junction (nucleotides) 0
comm
en
t
re
v
ie
w
s
re
ports
refer
e
e
d
re
sear
ch
de
p
o
si
te
d r
e
se
a
rch
interacti
o
ns
inf
o
rmation
RNA was degraded with the addition of 20 µl volume of 0.5 N sodium hydroxide and 0.25 M EDTA for 20 min at 65°C. The single-stranded cDNA was purified using a commercial kit (Qiagen Qiaquick). The resulting single-stranded cDNA prod-uct was placed in its entirety in a second-strand reaction. Sec-ond-strand synthesis reactions utilized shT7N9 random primer and the Klenow fragment of DNA polymerase utilizing standard reaction conditions (37°C for 60 min, 0.2 mM DTT, 2.1 mM Tris-HCl pH 7.9, 2.1 mM MgCl2, 10.7 mM NaCl, 1.07 mM dNTPs, 0.1 U/µl Klenow), followed by another Qiaquick purification. Multiple PCRs were run using 0.15 µg double-stranded (ds) DNA and standard reaction conditions. Ampli-fication was achieved using 10 cycles of PCR with the DP256 and T7 primers (20 mM Tris-HCl pH 8.4, 50 mM KCl, 0.01 mM dNTPs, 1.5 mM MgCl2, 0.01 U/µl Taq Polymerase), where DP256: 5'-GTTCGAGACCTCTAGATGCTGTTG-3', and T7: 5'-AATTAATACGACTCACTATAGGGAGA-3', followed by
Qiaquick purification. Further amplification was achieved using in vitro transcription reactions with 0.5 µg dsDNA and T7 RNA polymerase (7.5 mM DTT, 40 mM Tris-HCl pH 7.5, 14.25 mM MgCl2, 10 mM NaCl, 2 mM spermidine, 125 U/ml RNAguard, 2.5 mM dNTPs, 15 U/ml IPPase, 25 kU/ml T7 polymerase) for 16 h at 42°C. The cRNA was purified (RNe-asy) and reverse transcribed using Superscript II, random 9-mers, and amino-allyl dUTP (42°C for 20 min, 10 mM DTT, 50 mM Tris-HCl pH 8.3, 75 mM KCl, 8 mM MgCl2, 0.5 mM dNTPs, 0.5 mM amino-acyl-dUTP, 5 U/µl Superscript II). The final product was coupled to Cy3 or Cy5 dye in 1 M bicar-bonate buffer for 1 h. Reactions were finished with the addi-tion of 4 M hydroxylamine followed by purificaaddi-tion. The percentage dye incorporation and total cDNA yield were determined spectrophotometrically. Formamide concentra-tions in the hybridization solution were adjusted while keep-ing the overall volume at 2 ml. Pairs of Cy3/Cy5-labeled
[image:9.612.54.558.84.469.2]Sensitivity of junction probes to small sequence variations Figure 8
Sensitivity of junction probes to small sequence variations. Tiling probes were stepped across RB1 exon-exon junctions incorporating artificial (a) insertions or (b) deletions simulating mRNA nucleotide deletions and insertions, respectively. Nucleotides were deleted separately from each exon of a junction, resulting in two intensity profiles for each deletion size, averaged together in the lower panel. Data are from 40-mers spanning exon 9 to exon 10 pseudojunctions, hybridized with Jurkat mRNA in 35% formamide.
−20 −15 −10 −5 0 5 10 15 20
0 2 4 6 8 10 12
Log intensity
No insert 1 nucleotide 2 nucleotides 3 nucleotides 6 nucleotides 9 nucleotides 15 nucleotides 24 nucleotides
−20 −15 −10 −5 0 5 10 15 20
0 2 4 6 8 10 12
Position (nucleotides) of probe middle relative to pseudojunction
Log intensity
No deletio n 1 nucleotide 2 nucleotides 3 nucleotides 6 nucleotides 9 nucleotides 15 nucleotides 24 nucleotides
(a)
cDNA samples were combined and hybridized as described previously [29]. Arrays were hybridized for 48 h then washed and scanned on Agilent Microarray Scanners.
A higher-throughput version of the above protocol was designed for use with automation and a lower requirement for total RNA. This was accomplished by modifying a
[image:10.612.54.556.127.197.2]magnetic bead-based mRNA extraction (Ambion, Poly(A) Purist) for use with a Biomek FX and 96-well plates. Starting with as little as 5 µg total RNA (totRP-Amp) or 50 ng mRNA (mRP-Amp) will yield enough material for six dye-coupled hybridizations. The entire mRNA yield was used for first-strand synthesis. Subsequent steps were performed as above, except that reaction purifications were done using 96-well Table 1
Optimal probe lengths, probe positions, and formamide concentrations for purposes of exon monitoring, exon edge detection, and exon-exon junction monitoring
Exon monitoring Exon-edge detection Junction monitoring
Probe size 50 to 60 nucleotides 35 nucleotides 35 to 40 nucleotides
Probe position Exon interior = 5-nucleotide steps Centered ± 5 nucleotides
Formamide concentration 35% 30% 30 to 40%
Detection of isoform mixtures in a single sample, using purified ANXA7 RT-PCR products from skeletal (Sk) and smooth (Sm) muscle and 60-nucleotide
probes Figure 9
Detection of isoform mixtures in a single sample, using purified ANXA7 RT-PCR products from skeletal (Sk) and smooth (Sm) muscle and 60-nucleotide probes. Both isoforms can be detected when the shorter isoform, without exon 6, makes up 20% or more of the mixture. Plotted are log-ratios between intensities after normalizing on the basis of intensities of probes within unaffected exons. Blue and green lines trace exon and junction probe intensities, respectively; numbers are exon numbers. This experiment was performed for mixtures of 0, 20, 40, 60, 80, and 100% smooth muscle (see Additional data file 3).
100% Sk versus (100% Sm, 0% Sk)
3 4 5 6 7 8 9 10
200 300 400 500 600 700 800 900 1,000 1,100
100% Sk versus (20% Sm, 80% Sk)
Distance (nucleotides) of probe center from mRNA 5′ edge
Log
10
ratio
Log
10
ratio
0.2
0.1
0
−0.1
−0.2 2.5
2
1.5
0.5 1
0
[image:10.612.59.557.338.673.2]comm
en
t
re
v
ie
w
s
re
ports
refer
e
e
d
re
sear
ch
de
p
o
si
te
d r
e
se
a
rch
interacti
o
ns
inf
o
rmation
Qiaquick and RNeasy products. All material from the first-strand synthesis, second-first-strand synthesis, and PCR was con-centrated by means of evaporation and used in its entirety without quantitation.
RT-PCR of ANXA7
We designed primers to exons flanking the cassette exon, used the Qiagen OneStep PCR kit, and resolved the RT-PCR products on 2% agarose gels. Forward primer: 5'-TTCACAGTCTTATGGAGGTGGT-3'; reverse: 5'-CTTACGAA-GAATTTCTGCATCTC-3'.
ANXA7 mixture experiments
A cDNA representing exon 2 to exon 10 of ANXA7
(NM_004034) was generated with the T7 motif at the 5' end in a two-step reaction. Skeletal muscle mRNA was used to generate the long form (1,026 base-pairs (bp)) and smooth muscle mRNA to generate the short form (940 bp). RT-PCR was performed with the ANXA7-specific primers followed by additional rounds of PCR to incorporate the T7. In vitro tran-scription of this cDNA generated cRNA that was subsequently reverse transcribed using Superscript and random 9-mers and amino-allyl dUTP. The percentage dye incorporation and total cDNA yield were determined spectrophotometrically and the long and short forms were combined in the following ratios (5:0, 4:1, 3:2, 1:4, 0:5) with a final mass of 500 ng for each hybridization. ANXA121:
5'-GTCAGGAGTCATCTTTTC-CCCCTTC-3'; ANXA1147: AGATTCATCGGTC-CCTAGTCTCCCC-3'; T7ANXA121: 5'-ACTATAGGGAGAGTCAGGAGTCATC-3'
Calculation of exon edges
To estimate splice-site positions from tiling data, we tested Green's function deconvolution, derivative estimates, and wavelets. For the Green's function deconvolution method, we averaged probes placed across all 27 RB1 intron-exon bound-aries to generate 5' and 3' intensity profiles of intron-exon edges. For each intron-exon boundary, this averaged profile was deconvolved from probe intensities; ideally, this should result in a spike marking the intron-exon boundary, but this method was sensitive to noise. We also tested using the deriv-ative of each smoothed intron-exon profile. Finally, we also tested convolving each intron-exon intensity profile with wavelets, including Haar wavelets (step functions), b-spline wavelets, and Gaussian wavelets. For each of the wavelets, we varied the size of the wavelet and, for the Gaussian wavelets, the number of zero-crossings. Of the Green's function, deriv-ative, and wavelet methods, we chose a 50-point Haar wavelet on the basis of its performance and simplicity. Thus, to esti-mate intron-exon boundary, we convolved this 50-point Haar wavelet with each intron-exon probe intensity profile, start-ing 100 nucleotides into the intron through the exon, and identified the maximum value. The location of the maximum does not coincide with the splice site, but is a constant offset ANXA7 junction probe intensities for all possible pairwise combinations of exons hybridized with (a) smooth muscle and (b) skeletal muscle samples Figure 10
ANXA7 junction probe intensities for all possible pairwise combinations of exons hybridized with (a) smooth muscle and (b) skeletal muscle samples. Probes are 40 nucleotides, centrally positioned, and the hybridization used 35% formamide. Intensities have been normalized by the corresponding 'edge probe' intensities (see text) and the maximum in each plot is scaled to one. The 5' exon of each pair is numbered on the vertical axis, and the 3' exon on the horizontal axis.
2 4 6 8 10 12 14
2
4
6
8
10
12
Smooth muscle
5
′
Exon
3′ Exon
2 4 6 8 10 12 14
2
4
6
8
10
12
Skeletal muscle
3′ Exon
Normalized intensity
0.2 0.4 0.6 0.8 1
from the splice site. This constant depends on probe length, can be found by profiling through known intron-exon edges (for example in RB1) and subsequently applied to new data.
Note added in proof
While this article was under review, a related article was pub-lished by Wang et al. [30] who describe an algorithm for determining the relative abundance of known alternative iso-forms from microarray data. This article makes an important contribution to analysis methods for monitoring mRNA iso-form levels using multiple oligonucleotide probes and is a useful complement to the work presented here.
Additional data files
Additional data, available with this article online, include a figure showing the optimization of formamide concentration and probe length for detecting insertions and deletions in exon-exon junctions (Additional data file 1), a figure showing the ANXA7 junction probe intensities for all pairwise combinations of exons (with 40-nucleotide probes, centrally
positioned, in 35% formamide, without 'edge probe' normali-zation) (Additional data file 2), and a figure illustrating the detection of isoform mixtures in a single sample (using puri-fied ANXA7 RT-PCR products from skeletal and smooth mus-cle over a series of isoform ratios) (Additional data file 3). Additional data file 1
A figure showing the optimization of formamide concentration and probe length for detecting insertions and deletions in exon-exon junctions
A figure showing the optimization of formamide concentration and probe length for detecting insertions and deletions in exon-exon junctions
Click here for additional data file Additional data file 2
A figure showing the ANXA7 junction probe intensities for all pair-wise combinations of exons
A figure showing the ANXA7 junction probe intensities for all pair-wise combinations of exons
Click here for additional data file Additional data file 3
A figure illustrating the detection of isoform mixtures in a single sample
A figure showing the ANXA7 junction probe intensities for all pair-wise combinations of exons
Click here for additional data file
Acknowledgements
G. Cavet, S. Carlson, and J. Burchard provided assistance and helpful discus-sions. J. Schelter helped develop the precursor to the protocols presented here and provided useful insight.
References
1. Maniatis T, Tasic B: Alternative pre-mRNA splicing and pro-teome expansion in metazoans.Nature 2002, 418:236-243. 2. Modrek B, Resch A, Grasso C, Lee C: Genome-wide detection of
alternative splicing in expressed sequences of human genes. Nucleic Acids Res 2001, 29:2850-2859.
3. Kan Z, Rouchka EC, Gish WR, States DJ: Gene structure predic-tion and alternative splicing analysis using genomically aligned ESTs.Genome Res 2001, 11:889-900.
4. Black DL: Protein diversity from alternative splicing: a chal-lenge for bioinformatics and post-genome biology.Cell 2000, 103:367-370.
[image:12.612.56.555.86.423.2]Annexin A7 RT-PCR experiments Figure 11
Annexin A7 RT-PCR experiments. The long isoform (present in heart and brain) has an additional 66-nucleotide exon compared to the short form. Each panel shows microarray intensities from junction probes, normalized by edge probes, for junctions between exons 5 and 6 (long form) and between 5 and 7 (short form). RT-PCR results show the shorter form (lower band in each lane) and longer form. The RT-PCR reaction failed to produce a band for salivary gland and no microarray data were available for ileocecum.
12 13 14 15 16 17 18 19 20 21 22
1 2 3 4 5 6 7 8 9 10 11
Junction 5-6
Junction 5-7
Log-corrected intensity
0 2 4 6
Heart
Liver Brain Placenta Fetal brain Fetal liver Brain hippocampus 9
8 7 6 5 4 3 2 1
Lung 10
11 Salivary gland 12 Pancreas 13 Lymph node 14 Brain cerebellum 15 Stomach 16 Brain amygdala 17 Thyroid
18 Brain caudate nucleus 19 Trachea
20 Bone marrow 21 Brain corpus callosum 22 Ileocecum
Kidney
Spinal cord
Junction 5-6
comm
en
t
re
v
ie
w
s
re
ports
refer
e
e
d
re
sear
ch
de
p
o
si
te
d r
e
se
a
rch
interacti
o
ns
inf
o
rmation
5. Cooper TA, Mattox W: The regulation of splice-site selection, and its role in human disease.Am J Hum Genet 1997, 61:259-266. 6. Blencowe BJ: Exonic splicing enhancers: mechanism of action, diversity and role in human genetic diseases.Trends Biochem Sci 2000, 25:106-110.
7. Mironov AA, Fickett JW, Gelfand MS: Frequent alternative splic-ing of human genes.Genome Res 1999, 9:1288-1293.
8. Croft L, Schandorff S, Clark F, Burrage K, Arctander P, Mattick JS: ISIS, the intron information system, reveals the high fre-quency of alternative splicing in the human genome. Nat Genet 2000, 24:340-341.
9. Brett D, Hanke J, Lehmann G, Haase S, Delbruck S, Krueger S, Reich J, Bork P: EST comparison indicates 38% of human mRNAs contain possible alternative splice forms. FEBS Lett 2000, 474:83-86.
10. Hide WA, Babenko VN, van Heusden PA, Seoighe C, Kelso JF: The contribution of exon-skipping events on chromosome 22 to protein coding diversity.Genome Res 2001, 11:1848-1853. 11. Lander ES, Linton LM, Birren B, Nusbaum C, Zody MC, Baldwin J,
Devon K, Dewar K, Doyle M, FitzHugh W, et al.: Initial sequencing and analysis of the human genome.Nature 2001, 409:860-921. 12. Burge CB: Chipping away at the transcriptome.Nat Genet 2001,
27:232-234.
13. Xu Q, Modrek B, Lee C: Genome-wide detection of tissue-spe-cific alternative splicing in the human transcriptome.Nucleic Acids Res 2002, 30:3754-3766.
14. Zavolan M, Van Nimwegen E, Gaasterland T: Splice variation in mouse full-length cDNAs identified by mapping to the mouse genome.Genome Res 2002, 12:1377-1385.
15. Modrek B, Lee C: A genomic view of alternative splicing.Nat Genet 2002, 30:13-19.
16. Kochiwa H, Suzuki R, Washio T, Saito R, Bono H, Carninci P, Okazaki Y, Miki R, Hayashizaki Y, Tomita M: Inferring alternative splicing patterns in mouse from a full-length cDNA library and microarray data.Genome Res 2002, 12:1286-1293.
17. Shoemaker DD, Schadt EE, Armour CD, He YD, Garrett-Engele P, McDonagh PD, Loerch PM, Leonardson A, Lum PY, Cavet G, et al.: Experimental annotation of the human genome using micro-array technology.Nature 2001, 409:922-927.
18. Kapranov P, Cawley SE, Drenkow J, Bekiranov S, Strausberg RL, Fodor SP, Gingeras TR: Large-scale transcriptional activity in chromosomes 21 and 22.Science 2002, 296:916-919.
19. Hu GK, Madore SJ, Moldover B, Jatkoe T, Balaban D, Thomas J, Wang Y: Predicting splice variant from DNA chip expression data. Genome Res 2001, 11:1237-1245.
20. Yeakley JM, Fan JB, Doucet D, Luo L, Wickham E, Ye Z, Chee MS, Fu XD: Profiling alternative splicing on fiber-optic arrays. Nat Biotechnol 2002, 20:353-358.
21. Clark TA, Sugnet CW, Ares M Jr: Genomewide analysis of mRNA processing in yeast using splicing-specific microarrays.Science 2002, 296:907-910.
22. Friend SH, Bernards R, Rogelj S, Weinberg RA, Rapaport JM, Albert DM, Dryja TP: A human DNA segment with properties of the gene that predisposes to retinoblastoma and osteosarcoma. Nature 1986, 323:643-646.
23. Magendzo K, Shirvan A, Cultraro C, Srivastava M, Pollard HB, Burns AL: Alternative splicing of human synexin mRNA in brain, cardiac, and skeletal muscle alters the unique N-terminal domain.J Biol Chem 1991, 266:3228-3232.
24. Hughes TR, Mao M, Jones AR, Burchard J, Marton MJ, Shannon KW, Lefkowitz SM, Ziman M, Schelter JM, Meyer MR, et al.: Expression profiling using microarrays fabricated by an ink-jet oligonu-cleotide synthesizer.Nat Biotechnol 2001, 19:342-347.
25. Thanaraj TA: A clean data set of EST-confirmed splice sites from Homo sapiens and standards for clean-up procedures. Nucleic Acids Res 1999, 27:2627-2637.
26. Burset M, Seledtsov IA, Solovyev VV: Analysis of canonical and non-canonical splice sites in mammalian genomes. Nucleic Acids Res 2000, 28:4364-4375.
27. Florea L, Hartzell G, Zhang Z, Rubin GM, Miller W: A computer program for aligning a cDNA sequence with a genomic DNA sequence.Genome Res 1998, 8:967-974.
28. Boysen C, Smith CP, Pao S, Paul C, Borkowski JA: The Paracel fil-tering package (PFP): a novel approach to filfil-tering and masking of DNA and protein sequences.ISMB Proc 2001:36. 29. Roberts CJ, Nelson B, Marton MJ, Stoughton R, Meyer MR, Bennett
HA, He YD, Dai H, Walker WL, Hughes TR, et al.: Signaling and circuitry of multiple MAPK pathways revealed by a matrix of
global gene expression profiles.Science 2000, 287:873-880. 30. Wang H, Hubbell E, Hu JS, Mei G, Cline M, Lu G, Clark T, Siani-Rose