Intrinsic Inflation Persistence in a
Developing Country
Hanif, M. Nadim and Malik, Muhammad Jahanzeb and
Iqbal, Javed
State Bank of Pakistan, Karachi, Pakistan
21 June 2012
Online at
https://mpra.ub.uni-muenchen.de/39583/
1
Intrinsic Inflation Persistence in a Developing Country
Muhammad Nadim Hanif
Additional Director, Research Department
nadeem.hanif@sbp.org.pk
Muhammad Jahanzeb Malik
Joint Director, Research Department
jahanzeb.malik@sbp.org.pk
Javed Iqbal
Joint Director, Research Department
javed.iqbal6@sbp.org.pk
Abstract
This study estimates degree of intrinsic inflation persistence in Pakistan using aggregate price index, group level price indices, and individual commodity prices. We find no evidence of a unit root in (MoM) inflation at any level, except for house rent. Using monthly data from 1959 to 2011 we find that the estimate of (overall) inflation persistence is 0.16, which is low but significant. During 2001-2011 (overall) inflation persistence is insignificant. Food inflation does not exhibit any persistence during the last decade. However, the degree of persistence is very high (0.80) and significant for core inflation (NFNE), which weakens slightly (to 0.69) when we account for commodities price shock of 2008. At micro level, the estimated degree of inflation persistence for various groups is found to be relatively higher, in almost 60 percent of the cases, compared to corresponding degree of persistence at aggregate level. This may be because in micro analysis we consider only those commodities for which the estimated degree of inflation persistence is significant.
Key Words: Persistence, Inflation, Food Inflation, Core Inflation
Acknowledgement
Authors are thankful to M. Ali Choudhary, Umer Siddique, Imran Naveed Khan, Sajawal Khan, Syed Ozair Ali, Waseem Fazal ur Rehman and Amjad Ali for their comments on earlier version of this paper. The results in this study need not necessarily be attributed to State Bank of Pakistan where authors are employed.
For Correspondence
Muhammad Nadim Hanif Additional Director Research Department State Bank of Pakistan Karachi 74000
2
1. Introduction
The effectiveness of monetary policy in stabilizing prices depends largely upon inflation dynamics - in addition to the credibility of the central bank, the level of coordination between monetary and fiscal policies, the exchange rate regime and the degree of proactiveness of monetary policy. One of the determinants of inflation dynamics is the price setting behaviour of firms in the country. If a significant number of firms adjust their prices based on past information, the country will face inflation persistence (Gali and Gertler (1999)) – the tendency of inflation to converge slowly to its long-run level following a shock.
Choudhary et al (2011), based on a survey of a large number of firms in Pakistan, found that 71 percent of manufacturers in the country use backward looking information while setting prices. This gives rise to inflation inertia because when a large number of firms use backward looking information while setting prices, inflation cannot easily transition to a (new) lower steady state as a result of any unexpected announcement of a permanent and credible lowering of growth of the nominal anchor (Fuhrer, 2009).
In this paper we explore inflation persistence in Pakistan using month on month time series data of consumer price index (CPI), various group level consumer price indices, and 374 individual prices, released by the Pakistan Bureau of Statistics (PBS) – the country‟s statistical agency. This study, to the best of our knowledge, is the first comprehensive study on inflation persistence in Pakistan. We investigate inflation persistence starting from the aggregate inflation, down to its micro level exploration based upon month on month (MoM) changes in the prices of commodities in the CPI basket of Pakistan. The dataset comprises of two periods: January 1959 to June 2011 (longer span) for aggregate level; and July 2001 to June 2011 (recent decade) for aggregate, group-wise, and micro level investigation. The shorter period for group-wise and micro level study is due to non-availability of data before 2001.
According to literature, for example Altissimo et al (2006), there are three types of persistence: (i) extrinsic, which is due to persistence in marginal costs changes, (ii) intrinsic, that is dependence of inflation on its own past and (iii) expectation based inflation persistence (which means if inflation is hit by a shock and firms and households do not have information about the nature of the shock, they start expecting inflation to follow historical trends). In this study, we focus on intrinsic inflation persistence. The reason for this focus is that we do not have the required data on inflation expectations and firm level costs.
3
The paper proceeds as follows. Section 2 presents the methodological framework. Section 3 provides findings on inflation persistence in Pakistan. Section 3 has various subsections. First, we present results related to extreme form of inflation persistence based on unit root tests. Then, we discuss results on the non-extreme form of the inflation persistence based on AR(1) and SARCs approaches. In the next subsection we provide evidence for fall in the degree inflation persistence after considering structural breaks observed in the data. We also provide an international comparison of aggregate level inflation persistence with the findings of this study on Pakistan in a separate subsection. In the last subsection we present evidence of inflation persistence in Pakistan based on individual commodity prices. Section 4 concludes.
2. Methodological framework
Inflation persistence means dependence of current inflation on its past values. In this section we present the methodological steps to study inflation persistence1. First, we diagnose if the inflation series has infinite persistence2 using Phillips-Perron unit root test3. A unit root implies that the inflation series have infinite memory and any current shock will influence all future outcomes (see Fuhrer, 2009). This is an extreme form of persistence. For non-extreme forms of persistence where inflation series is found to be stationary, we would like to investigate its degree. The higher the degree of inflation persistence, the longer time the inflation takes to return to its previous levels, in case of a shock4. For the degree of inflation persistence we run a first order autoregressive model AR(1) model, and check for the significance of a positive coefficient on the AR term which implies a positive serial correlation, and thus inertia, in the inflation series. This is the standard method in the literature to measure inflation persistence (see Cutler (2001), Batini (2002), Batini and Nelson (2002), Cecchetti and Debelle (2005), and Osborn and Sensier (2009), and Gupta and Saxegaard (2009)). A few authors, however, consider inflation to be persistent even if it is negatively autocorrelated (for details see Fuhrer (2009). Based on our own simulation study, we consider positive serial correlation in inflation series as a measure of inflation persistence5using the equation
(1)
where denotes the inflation at time t, is the mean inflation rate, and is the AR(1)
coefficient.
Following Levin and Piger (2003), Williams (2006), Kota (2011), Tillmann (2011), and Zhang (2011), we also use SARCs as a separate measure of the degree of inflation persistence since the SARCs approximates the long run impulse response to a unit shock. The model we estimate is the p order autoregressive model. Lag length is selected using Akaike (1969) information criterion.
4
(O‟Reilly and Whelan, 2005). However, there is no conclusive evidence on whether or not inflation persistence has changed in different countries of the world (see Taylor (2000), Stock (2001), Cogley and Sargent (2001), Willis (2003), Pivetta and Reis (2007), Kim et al (2004), and O‟Reilly and Whelan (2005)). With the mixed evidence from different countries on the presence of break(s) in the inflation persistence, it is important to see if there are changes in the mean inflation rate and/or in the inflation persistence over time in Pakistan. This becomes even more important to see it at those points where inflation fluctuates substantially in Pakistan (see figure 3.1). The degree of its persistence is expected to be higher, when inflation moves in a relatively larger range (see footnote 7). In order to capture possible structural break(s) we employ the rolling Chow break point test (see Chow (1960)). While applying the Chow break point test if we are unable to reject the null hypothesis (at 5 percent confidence level) throughout the sample range, it is evidence of lack of any structural break. If there is only one point where the p-value for rejecting the null hypothesis is smaller than 0.05, this may be an outlier. However, when there are more than one but consecutive points with p-value less than 0.05, the one with the lowest p-value is considered as a break point. If there are two or more sequences with p-values less than 0.05, at different periods, then this is evidence of multiple structural breaks. As a robustness check of a structural break test, we re-estimate our autoregressive model by using a dummy variable both for intercept and slope. In case we find the evidence of structural break, the dummy variable approach helps us in distinguishing whether the break is in the mean inflation rate or in the inflation persistence or both.
5
3. Findings on Inflation Persistence in Pakistan
3.1 Results of Unit Root Tests
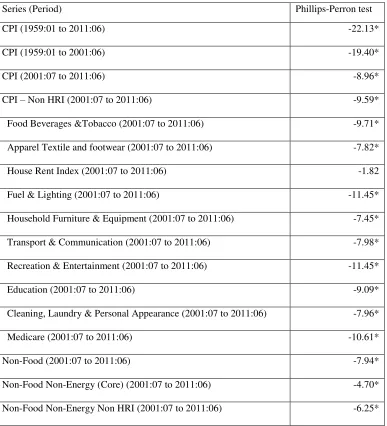
In Table 3.1 (Appendix A), we present the results of Phillips-Perron unit root test. We could not find any evidence of unit root for the aggregate (MoM) inflation series, both for the longer period of 1959-2011 as well as for 2001-2011. For later, we have luxury of group level price indices. Groups are classified (by PBS) as: „food, beverages & tobacco‟, „apparel, textile & footwear‟, „house rent index‟, „fuel & lighting‟, household furniture & equipment‟, „transport & communication‟, „recreation & entertainment‟, „education‟, „cleaning, laundry & personal appearance‟, and „medicare‟. Furthermore, some other groups of interest like „excluding HRI or CPI-NHRI‟, „non-food or NF‟, „non-food non-energy or NFNE or core‟, and „NFNE-non HRI‟ are also analysed to see the drivers of inflation persistence in various categories. We also explore the unit root in MoM changes in these group level indices and could not find the evidence of non-stationarity except in the case of HRI. Evidence of a unit root in MoM changes in HRI is not surprising. It is evident in the construction of HRI6.
3.2 Estimated Degree of Inflation Persistence Based upon AR(1) and SARCs
Thus far we have established that there is (infinite) persistence in the inflation series for HRI while all the other series explored above are stationary. For these stationary series, we consider non-extreme form of persistence using equation (1) in aggregate and group level inflation. For the aggregate and for the group level inflation series we estimated the first order autoregressive model (with drift). The results are presented in Table 3.3(column 3) of Appendix A.
The estimate of inflation persistence in Pakistan for aggregate MoM inflation for 1959-2011 is 0.19 which is (statistically) significant. Interestingly, we find this number to be higher by 0.09 for the recent decade (2001-2011). However, once we exclude HRI from the overall basket, the estimated AR(1) coefficient turns to be much lower (from 0.28 to 0.18) and insignificant. Thus, inflation for non-HRI basket is not persistent for 2001-2011.
6
and entertainment‟, and „medicare‟ groups. Most of the commodities in these groups belong to the services sector.
Other groups – except HRI - in the non-food category which show inflation persistence are „apparel, textile & footwear‟, „household furniture & equipment‟, „transport & communication‟, „cleaning, laundry & personal appearance‟, and „education‟. Inflation persistence in these groups drives persistence in non-food (NF), non-food non-energy (NFNE) and NFNE-non-HRI categories. The highest inflation persistence coefficient is found for the core or NFNE group which is 0.80, and is significant. Thus core inflation follows a persistence stationary process in Pakistan. Majority of commodities in non-food non-energy categories are manufactured goods.
We also present the results (in Table 3.4 (column 3), Appendix A) of an alternate measure of persistence “the sum of autoregressive coefficients (SARCs)” following Levin and Piger (2003), Williams (2006), Kota (2011), Tillmann (2011), and Zhang (2011). Lag length is selected using Akaike (1969) information criterion7. Overall, the degree of persistence is higher than what we found based on AR(1) approach and we can see the core inflation is found to be highly persistent.
3.3 Estimated Degree of Inflation Persistence and Structural Breaks
We now consider the impact of structural break(s) on the estimated coefficient(s) of the autoregressive model employed above to investigate the inflation persistence. We apply rolling Chow break point test on the aggregate inflation series for 1959-2011 and on aggregate as well as group level inflation series for 2001-2011. There is evidence for a structural break in the intercept of the autoregressive model, in 1973 and 2008 (see column 4 of Table 3.3 in Appendix A) for longer aggregate inflation series and in 2008 for short span aggregate/group level inflation series (except for „transport & communication‟ group). We are not surprised over the detection of these structural breaks as we have pointed out in the Figure 3.1 (Appendix A). We also confirmed the break points by introducing an intercept dummy after the break point (in the autoregressive model used for investigating the inflation persistence) in respective series, which was found to be significant (except for „transport & communication‟ group). However, the slope dummies introduced (for the autoregressive coefficients) were found to be insignificant. Thus, there is a break in only the (mean) inflation of Pakistan for aggregate as well as group level series (except for „transport & communication‟ group) and not in the corresponding series‟ inflation persistence. Ignoring the structural break results in (an upward) biased estimate of the degree of inflation persistence (Altissimo et al. (2006)).
7
degree of inflation persistence becomes insignificant (see column 5 of Table 3.3 in Appendix A). Thus, ignoring the structural break could have been misleading at least for these two cases.
While it weakens after considering the structural break, we find that core inflation shows a high degree of persistence which is 0.69. However, it is important to mention that NFNE basket includes HRI. The degree of inflation persistence in NFNE non-HRI basket is 0.43 and is significant. Thus, it is not just HRI which makes core inflation to be persistent; rather most of the groups in core inflation drive persistence.
Since the evidence of break pertained to the mean inflation rate, we also estimated and reported the degree of inflation persistence using SARCs approach by considering break point [Table 3.4 (column 3)]9. As in the case of AR(1), the degree of persistence declined when the break point was considered (see figure 3.4 in Appendix A). Again, the degree of persistence is higher than what we found based on AR(1) approach while considering the structural break. Core inflation is found to be highly persistent as well.
This degree of persistence for core inflation around 0.69 is very close to one of the findings of Choudhary et al (2011) based on individual companies‟ price setting survey results that 71 percent of manufacturing firms in Pakistan use backward looking information while setting prices. Another finding of Choudhary et al (2011) is that the frequency of price change is considerably high in Pakistan: the median frequency of price change is 4 (times a year) in Pakistan‟s manufacturing sector compared to 1 in Euro Zone. 32 percent of firms in Pakistan change price within a month compared to 16 percent such firms in Euro Zone. As far as the evidence of core inflation persistence in the presence of frequent price changes is concerned, it is possible that firms change their prices frequently but follow the backward looking price setting behaviour. Furthermore, the survey of price setting behaviour in Pakistan by Choudhary et al (2011) was conducted around the period of global commodity prices shock when international prices were changing more frequently (than historically) and our firms at that time might simply be following international prices‟ behaviour as a quarter of inputs used in Pakistan‟s manufacturing industries are imported (Pakistan, 2006). Another possible explanation for core inflation persistence in the presence of frequent price changes is the higher frequency of price changes itself: when firms change price frequently they need not to pass on all the impact of changes in cost of production to consumers in one go due to 1) expecting a possible reversal in input cost, and 2) fear of losing customers/profits if all changes in prices are passed on in one go.
3.4 International Comparison of Aggregate Inflation Persistence
In order to compare Pakistan‟s inflation persistence, during 2001-11, with that in „similar‟ countries we selected 17 (inflation) peer countries10
8 measures. It is important to note that Pakistan‟s (aggregate) inflation persistence is insignificant compared to significant inflation persistence in 15 (13) countries based on AR1 (SARCs) measure out of the 17 countries reported in Table 1B in the Appendix B. Comparing across a larger set of countries, we can see that the estimated degree of persistence in aggregate inflation for Pakistan (0.25 based on SARCs approach; as reported in column 4, and row 3 of Table 3.4 in Appendix A) is low compared to median persistence (0.27; based on SARCs) for 91 countries reported by Walsh (2011). We do not have group wise prices data for such countries for group level inflation persistence comparisons.
3.5 Micro Evidence on Inflation Persistence in Pakistan
By now, we have classified the groups as those showing (aggregate) inflation persistence and those which do not. But, does inflation persistence or its absence for any aggregate imply that all commodities in it show similar behaviour? Obviously, it may not be a necessary case. We now proceed to individual commodities based exploration of inflation persistence in Pakistan.
As in the case of aggregate level exercise, we first examine micro data to see if there is an extreme form of inflation persistence in Pakistan based on panel unit root test. The exercise is done for 342 non seasonal commodities (to have a balanced panel)11. We apply the Levin-Lin-Chu (2002) and Im-Pesaran-Shin (2003) tests to see if there is a panel unit root in the month-on-month changes in the commodity prices in the CPI basket (Table 3.2of Appendix A). We could not find the evidence of panel unit root in the MoM changes in commodity prices of 342 (non-seasonal) items in the CPI basket. Now, we further explore the degree of (non-extreme form of) inflation persistence based on micro data following AR (1) and SARCs approach.
We present the results of this investigation of inflation persistence in Pakistan on the basis of monthly changes in the prices of all 374 individual commodities as reported by PBS, for the period of July 2001 to June 2011, using both the AR(1) as well as the sum of autoregressive coefficients approach in Tables 3.5 and 3.6respectively. In addition to overall 374 commodities in the CPI basket, the analysis has been extended to different groups in the CPI. In Tables 3.5 and 3.6 (of Appendix A) each group name has been suffixed with the number of commodities in the group.
9
showing significant inflation persistence in addition to the weight of such commodities (columns 5-7) in the underlying basket.
The estimated degree of persistence in micro level investigation is higher, in 75 percent of the cases, than the counterpart in aggregate/group level investigation in this study when AR(1) approach is used (See figures 3.6 and 3.8 in Appendix A). This may be due to the reason that in micro level averaging (the degree of inflation persistence), we consider only those commodities for which there is (statistically) significant inflation persistence and thus ignore those for which estimated AR(1) coefficient is found to be negative or statistically insignificant. Furthermore, the share of commodities showing persistence is less than half except for couple of groups. Thus, we cannot deduce here that aggregation leads (MoM) inflation persistence to be biased downward. Although the share of commodities showing inflation persistence, using SARCs approach, is more than half (except for „fuel and lighting‟ group), the estimated degree of persistence in micro level investigation is higher, only in 46 percent of the cases, than the counterpart in aggregate/group level investigation (see figures 3.7 and 3.9 in Appendix A). Thus, we cannot deduce here again that aggregation leads (MoM) inflation persistence to be biased downwards. As a matter of fact, the micro level results are not comparable with aggregate level findings unless we consider only those commodities in aggregations which are found to have statistically significant inflation persistence at micro level. Since commodities (with significant inflation persistence) need not necessarily be the same every month, throughout July 2001 to June 2011, there is no way to generate such an index for this period12.
We would like to state that despite its use in this study and its use by Kota (2011), Tillmann (2011), Osborn and Sensier (2009), Angeloni et al (2006), Cecchetti and Debelle (2005), and Bilke (2005); autoregressive models give a purely statistical measurement of persistence and show how inflation has behaved. These models cannot, however, say anything about why persistence arises. Therefore, further investigation of inflation persistence is required by considering the variables influencing the inflation and its dependence on its own or other relevant variables‟ past.
4. Conclusion
10
degree of inflation persistence in various categories is found to be relatively higher in 60 percent of the cases and this may be because we considered only those commodities for which estimated degree of persistence is found to be significantly greater than zero.
Analyzing inflation persistence at the group level helps in identifying which group‟s inflation persistence behavior is driving persistence related behaviour in overall inflation. Estimated low degree of overall inflation persistence may be driven by the small estimated autoregressive coefficients for some subgroups like food group. Food inflation does not exhibit any significant inflation persistence and it may be because most of the commodities in food group (with above 60 percent of weight in food basket) are raw items like onion, fruits and fresh milk, and are directly prone to supply shocks and their prices are more volatile (compared to manufactured items in which manufacturers have capacity to absorb some of the changes in inputs costs and to pass these changes to consumers in parts which generates inertia in inflation).
11
References
Akaike, H. (1969). “Fitting Autoregressive models for prediction,” Annals of the Institute of Statistical Mathematics, Volume 21, pp. 243-247
Altissimo, F., M. Ehrmann, and F. Smets (2006). “Inflation Persistence and Price-setting Behaviour in Euro Area: A Summary of IPN Evidence,” European Central Bank Occasional Paper No 46
Angeloni, I., J. Gali,, L. Aucremanne, A. Levin, E. Ehrmann, and F. Smets (2006). “New Evidence on Inflation Persistence And Price Stickiness In The Euro Area: Implications For Macro Modeling,” Journal of the European Economic Association April-May 2006 4(23):562– 574
Batini, N. (2002). “Euroarea inflation persistence”, ECB, WP No.201
Batini, N., E. Nelson (2002). “The Lag from Monetary Policy Actions to Inflation: Friedman revisited”, Bank of England, Discussion Paper No.6;
Bilke, L. (2005). “Break in the Mean and Persistence of Inflation: A Sectoral Analysis of French CPI,” ECB Working Paper No. 463
Cecchetti., S and G. Debelle (2005). “Has the Inflation Process Changed?” BIS Working Papers No 185
Choudhary, M.A., S. Naeem, A. Faheem, N. Hanif, and F. Pasha (2011). “Formal Sector Price Discoveries: Preliminary Results for a Developing Country,” SBP Working Paper No 42, and Surrey University Discussion Paper No. 10/11
Chow, C. Gregory (1960). “Tests of equality between sets of coefficients in two linear regressions,” Econometrica, Vol. 28, No. 3 pp. 591-605
Cogley, T. and T.J. Sargent (2001). “Evolving Post-World War II US Inflation Dynamics,” in NBER Macroeconomics Annual 2001 (Eds) B. S. Bernanke and K. Rogoff, MIT Press, Cambridge, MA
Cutler, J. (2001). “A New Measure of Core Inflation in the U.K.”, MPC Unit Discussion, Paper No. 3 (London: Bank of England).
Fuhrer, J.C. (2009). “Inflation Persistence,” Working Paper No. 09-14 of Federal Reserve Bank of Boston
12
Gupta, S., and M. Saxegaard (2009). “Measures of Underlying inflation in Sri Lanka”, IMF Working Paper No. 09/167
Im, K. S., M. H. Pesaran, and Y. Shin (2003). “Testing for Unit Roots in Heterogeneous Panels,” Journal of Econometrics, 115, 53–74
Kim, C. J., C.R. Nelson and J. Piger (2004). “The less volatile US economy: A Bayesian investigation of timing, breadth, and political examination,” Journal of Business and Economic Statistics, 22, pp 80-93
Khundrakpam, J. K. (2008). “How Persistent is Indian Inflationary Process, Has it Changed?” Reserve Bank of India Occasional Papers, Vol. 29, No. 2, Monsoon, pp. 23-45
Kota, V. (2011). “The Persistence of Inflation in Albania,” Special Conference Paper No. 3, Bank of Greece
Levin, A and J. Piger (2003). “Is Inflation Persistence intrinsic in industrial economies?”, Federal Reserve Bank of St. Louis working paper 2002-023
Levin, A. and J. Piger (2004). “Is Inflation Persistence Intrinsic in Industrial Countries?” The Federal Reserve Bank of Saint Louis, Working Paper No. 023E
Levin, A., C. F. Lin, and C. Chu (2002). “Unit Root Tests in Panel Data: Asymptotic and Finite -Sample Properties,” Journal of Econometrics, 108, 1–24.
Marques, C (2004). “Inflation Persistence: Facts or Artefacts?” ECB Working paper No 371, June 2004
O‟Reilly, G. and K. Whelan (2005). “Has Euro area inflation persistence changed over time?,” The Review of Economics and Statistics, 87, pp. 709-20
Osborn, D. and M. Sensier (2009). “UK inflation: persistence, seasonality and Monetary Policy,” Scottish Journal of Political Economy, Volume 56(1), pp. 24-44.
Pakistan, Federal Bureau of Statistics (2006). Census of Manufacturing Industries in Pakistan, Islamabad.
Pivetta, F. and R. Reis (2007). “The persistence of inflation in the United States”, Journal of Economic Dynamics and Control, 31, 1326-1358
13
Stock, J. (2001). “Comment evolving post World War II US inflation dynamics,” in NBER Macroeconomics Annual 2001 (Eds) B. S. Bernanke and K. Rogoff, MIT Press, Cambridge, MA, pp. 379-87
Taylor, J. B. (2000). Low inflation pass through and the pricing power of firms,” European Economic Review, 44, pp. 1389-408
Tillmann, P. (2011). “Has Inflation Persistence Changed Under EMU?,” German Economic Review, Volume 12, Issue 4, pp. 1-17.
Walsh, J.P. (2011). “Reconsidering the Role of Food Prices in Inflation,” IMF Working Paper No. 11/71
Williams, J.C. (2006). “Inflation Persistence in an Era of Well-Anchored Inflation Expectations”, FRBSF Economic Letter, Federal Reserve Bank of San Francisco
Willis, J.L. (2003). “Implications of structural changes in the U.S. economy for pricing behavior and inflation dynamics”, Economic Review, First Quarter 2003, Federal Reserve Bank of Kansas City
14 Appendix A -4 -2 0 2 4 6 8 10 Ja n -59 A p r-60 Ju l-61 O c t-62 Ja n -64 A p r-65 Ju l-66 O c t-67 Ja n -69 A p r-70 Ju l-71 O c t-72 Ja n -74 A p r-75 Ju l-76 O c t-77 Ja n -79 A p r-80 Ju l-81 O c t-82 Ja n -84 A p r-85 Ju l-86 O c t-87 Ja n -89 A p r-90 Ju l-91 O c t-92 Ja n -94 A p r-95 Ju l-96 O c t-97 Ja n -99 A p r-00 Ju l-01 O c t-02 Ja n -04 A p r-05 Ju l-06 O c t-07 Ja n -09 A p r-10
Figure 3.1: Overall (MoM) Inflation in Pakistan
oil price shock of 1970s
commodity price shock of 2008
Recent decade 2001-2010
[image:15.612.75.541.332.643.2]0.00 0.20 0.40 0.60 0.80 1.00
Figure 3.3: Impact of Break on AR(1)-Micro
AR(1) (WOB)-Micro AR(1) (WB)-Micro
0.00 0.20 0.40 0.60 0.80 1.00
Figure 3.5: Impact of Break on SARCs-Micro
SARCs (WOB)-Micro SARCs (WB)-Micro -0.20 0.00 0.20 0.40 0.60 0.80 1.00
Figure 3.2: Impact of Break on AR(1)-Aggregate
AR(1) (WOB)-Aggre ga te AR(1) (WB) - Aggrega te
-0.20 0.00 0.20 0.40 0.60 0.80 1.00
Figure 3.4: Impact of Break on SARCs-Aggregate
15
-0.20 0.00 0.20 0.40 0.60 0.80 1.00
Figure 3.6: Impact of Aggregateon on AR(1)-WOB
AR(1) (WOB)-Aggre ga te AR(1) (WOB)-Micro
-0.20 0.00 0.20 0.40 0.60 0.80 1.00
Figure 3.8: Impact of Aggregateon on AR(1)-WB
AR(1) (WB) - Aggrega te AR(1) (WB)-Micro
[image:16.612.75.539.68.361.2]-0.20 0.00 0.20 0.40 0.60 0.80 1.00
Figure 3.7: Impact of Aggregateon on SARCs-WOB
SARCs (WOB)-Aggre ga te SARCs (WOB)-Micro
-0.20 0.00 0.20 0.40 0.60 0.80 1.00
16
Table 3.1: Unit Root Test for MoM Inflation in Pakistan
Series (Period) Phillips-Perron test
CPI (1959:01 to 2011:06) -22.13*
CPI (1959:01 to 2001:06) -19.40*
CPI (2001:07 to 2011:06) -8.96*
CPI – Non HRI (2001:07 to 2011:06) -9.59*
Food Beverages &Tobacco (2001:07 to 2011:06) -9.71*
Apparel Textile and footwear (2001:07 to 2011:06) -7.82*
House Rent Index (2001:07 to 2011:06) -1.82
Fuel & Lighting (2001:07 to 2011:06) -11.45*
Household Furniture & Equipment (2001:07 to 2011:06) -7.45*
Transport & Communication (2001:07 to 2011:06) -7.98*
Recreation & Entertainment (2001:07 to 2011:06) -11.45*
Education (2001:07 to 2011:06) -9.09*
Cleaning, Laundry & Personal Appearance (2001:07 to 2011:06) -7.96*
Medicare (2001:07 to 2011:06) -10.61*
Non-Food (2001:07 to 2011:06) -7.94*
Non-Food Non-Energy (Core) (2001:07 to 2011:06) -4.70*
Non-Food Non-Energy Non HRI (2001:07 to 2011:06) -6.25*
*: Null hypothesis of Unit Root is rejected at 5 percent level of significance.
Table 3.2: Panel Unit Root Test for MoM Inflation in Pakistan
Series for period 2001:07 to 2011:06 Levin, Lin and Chu t-test@ Im, Pesaran and Shin W-stat#
342 commodities (only constant included) -20.87* -51.61*
342 commodities (constant & trend included) -23.90* -52.96*
@: Null hypothesis assumes common unit root process.
#: Null hypothesis assumes individual unit root process.
[image:17.612.69.522.557.627.2]17
Table 3.3: Inflation persistence in Pakistan - AR(1) approach (with and without break)
Series Period AR(1)
coefficient without considering break point (WOB)
Break Points AR(1) coefficient while considering break point (WB)
(1) (2) (3) (4) (5)
CPI-overall 1959-2011 0.19* 1973: 07
2008:03 0.16*
CPI-overall 1959-2001 0.17* 1973: 07 0.15*
CPI-overall 2001-2011 0.28* 2008:03 0.18
CPI – Non HRI 2001-2011 0.18 2007:07 0.08
Food Beverages and Tobacco 2001-2011 0.13 2008:03 0.10
Apparel, Textile and Footwear 2001-2011 0.45* 2008:03 0.31*
Fuel and Lighting 2001-2011 -0.04 2008:03 -0.09
Household Furniture and equipment 2001-2011 0.57* 2008:04 0.44*
Transport and communication 2001-2011 0.29* none 0.29*
Recreation and Entertainment 2001-2011 -0.03 2008:05 -0.11
Education 2001-2011 0.20* 2008:05 0.12
Cleaning, Laundry and Personal Appearance 2001-2011 0.44* 2008:03 0.29*
Medicare 2001-2011 0.12 2006:08 0.00
Non-Food Group 2001-2011 0.50* 2008:06 0.39*
Non-Food Non-Energy (Core) 2001-2011 0.80* 2008:04 0.69*
Non-Food Non-Energy Non HRI 2001-2011 0.62* 2008:01 0.43*
18
Table 3.4: Degree of inflation persistence in Pakistan – sum of autoregressive coefficients
Series Period SARCs (WOB) SARCs (WB)
(1) (2) (3) (4)
CPI-overall 1959-2011 0.36* 0.30*
CPI-overall 1959-2001 0.34* 0.29*
CPI-overall 2001-2011 0.40* 0.25
CPI – Non HRI 2001-2011 0.18 0.08
Food Beverages and Tobacco 2001-2011 0.13 0.10
Apparel, Textile and Footwear 2001-2011 0.45* 0.31*
Fuel and Lighting 2001-2011 -0.04 -0.09
Household Furniture and equipment 2001-2011 0.74* 0.62*
Transport and communication 2001-2011 0.30* 0.30*
Recreation and Entertainment 2001-2011 0.20 0.06
Education 2001-2011 0.20* 0.12
Cleaning, Laundry and Personal Appearance 2001-2011 0.80* 0.45*
Medicare 2001-2011 0.12 0.00
Non-Food Group 2001-2011 0.74* 0.74*
Non-Food Non-Energy (Core) 2001-2011 0.87* 0.76*
Non-Food Non-Energy Non HRI 2001-2011 0.73* 0.50*
19
Table 3.5: Commodities, Weight, and the Degree of Inflation Persistence - AR (1)
Number (and percent) of commodities
in respective group showing
Significant Persistence
Weight (out of 100) of Commodities Showing Significant Persistence
Weighted Average of Magnitudes of Significant Persistence
Group
Historical Method (WOB)
Historical Method (WB)
Fixed Window (WOB)
Historical Method (WOB)
Historical Method (WB)
Fixed Window (WOB)
Historical Method (WOB)
Historical Method (WB)
Fixed Window (WOB)
(1) (2) (3) (4) (5) (6) (7) (8) (9) (10)
All 374 168 (45%) 137 (37%) 91 (24%) 56.60 52.97 43.18 0.63 0.62 0.70
CPI-NHRI 373 167 (45%) 136 (36%) 90 (24%) 33.17 29.54 19.75 0.39 0.35 0.43
FBT 124 62 (50%) 53 (43%) 39 (31%) 21.48 13.99 14.14 0.31 0.34 0.42
ATF 42 28 (67%) 21 (50%) 19 (45%) 4.16 3.07 2.84 0.42 0.38 0.50
HRI 1 1 (100%) 1 (100%) 1 (100%) 23.43 23.43 23.43 0.96 0.96 0.93
FL 15 3 (20%) 3 (20%) 1 (7%) 0.85 0.85 0.24 0.36 0.35 0.36
HFE 44 34 (77%) 28 (64%) 11 (25%) 1.83 1.45 0.61 0.40 0.34 0.45
TC 43 15 (35%) 15 (35%) 8 (19%) 2.08 2.08 0.66 0.42 0.35 0.39
RE 16 11 (69%) 3 (19%) 6 (38%) 0.33 0.09 0.25 0.45 0.34 0.40
Education 24 5 (21%) 3 (13%) 3 (13%) 0.35 0.31 0.10 0.39 0.31 0.32
CLPA 36 10 (28%) 5 (14%) 5 (14%) 1.81 0.82 0.95 0.31 0.32 0.51
Medicare 29 6 (21%) 4 (14%) 3 (10%) 0.27 0.10 0.15 0.28 0.37 0.44
NF 250 107 (43%) 83 (33%) 52 (21%) 34.91 32.20 29.05 0.77 0.79 0.84
NFNE 232 104 (45%) 80 (34%) 51 (22%) 34.06 31.35 28.80 0.78 0.80 0.85
NFNE-NHRI 231 103 (45%) 79 (34%) 50 (22%) 10.63 7.92 5.37 0.39 0.35 0.48
20
[image:21.612.39.575.101.552.2]
Table 3.6: Commodities, Weight, and the Degree of Inflation Persistence - AR (p)
Number (and percent) of commodities
in respective group showing
Significant Persistence
Weight (out of 100) of Commodities Showing Significant Persistence
Weighted Average of Magnitudes of Significant Persistence
Group
Historical Method (WOB)
Historical Method (WB)
Fixed Window (WOB)
Historical Method (WOB)
Historical Method (WB)
Fixed Window (WOB)
Historical Method (WOB)
Historical Method (WB)
Fixed Window (WOB)
(1) (2) (3) (4) (5) (6) (7) (8) (9) (10)
All 374 269 (72%) 245 (66%) 207(55%) 74.75 71.14 63.96 0.52 0.48 0.54
CPI-NHRI 373 268 (72%) 244 (65%) 206 (55%) 51.32 47.71 40.53 0.32 0.26 0.32
FBT 124 98 (79%) 92(74%) 84 (68%) 23.15 21.82 24.77 0.29 0.26 0.33
ATF 42 32 (76%) 28 (67%) 30 (71%) 4.57 3.62 4.16 0.45 0.28 0.38
HRI 1 1 (100%) 1 (100%) 1 (100%) 23.43 23.43 23.43 0.95 0.94 0.93
FL 15 5 (33%) 4 (27%) 2 (13%) 0.88 0.81 0.72 0.37 0.36 0.37
HFE 44 40 (91%) 38 (86%) 29 (66%) 3.17 3.12 2.79 0.41 0.28 0.28
TC 43 26 (60%) 26 (60%) 16 (37%) 5.34 5.34 2.02 0.29 0.23 0.29
RE 16 8 (50%) 8 (50%) 7 (44%) 0.19 0.19 0.20 0.33 0.27 0.27
Education 24 14 (58%) 12 (50%) 9 (38%) 1.67 1.57 0.61 0.18 0.13 0.17
CLPA 36 27 (75%) 20 (56%) 22 (61%) 4.20 3.24 4.03 0.21 0.15 0.31
Medicare 29 21 (72%) 19 (66%) 7 (24%) 1.63 1.49 1.23 0.09 0.08 0.09
NF 250 171 (68%) 154 (62%) 130 (52%) 44.88 42.65 41.59 0.63 0.61 0.64
NFNE 232 165 (71%) 148 (64%) 121 (52%) 42.09 39.88 38.47 0.67 0.64 0.68
NFNE-NHRI 231 164 (71%) 147 (64%) 120 (52%) 18.66 16.45 15.04 0.32 0.23 0.30
21
22
Table 1B: Month on month (Inflation) Persistence in Peer Countries#
Country AR(1) coefficient with
considering respective break point
SARCs with considering respective break point
Argentina 0.57* -0.12
Botswana 0.36* 0.36*
Burundi 0.02 0.02
Egypt 0.43* 0.43*
Indonesia 0.18* 0.18*
Kazakhstan 0.56* 0.52*
Kenya 0.26* 0.26*
Madagascar 0.31* 0.31*
Moldova 0.51* 0.40*
Mongolia 0.45* 0.45*
Nicaragua 0.34* 0.54*
Rwanda 0.35* 0.25*
Seychelles 0.16* 0.22*
Solomon Islands 0.04 0.04
Sudan 0.22* 0.09
Uruguay 0.36* 0.33*
Vietnam 0.46* 0.46*
Average (of above 17 countries) 0.33 0.28
Pakistan 0.18 0.25
#: Authors‟ calculations. *: Significantly different from zero at 5 percent.
1
Persistence can occur at high as well as low levels of inflation. Inflation persistence does not have similar
connotations in case of high levels of inflation compared to low levels of inflation. It has negative connotation when we observe it in high inflation periods, which is not the case when there is low inflation.
2
For a discussion on the advantages and disadvantages of various measures of persistence see Marques (2004).
3
Phillips-Perron unit root test has advantage over the Augmented Dickey-Fuller test of being robust to general forms of heteroscedasticity in the error term.
4
In order to explain the same, we have used an AR(1) to generate a series. We then perturbed the series by 1 percent and observed that it took almost 10 periods (when AR(1) coefficient is 0.60) to more than 50 periods (when AR(1) coefficient is 0.95) for the series to return to its previous levels (See Figure 1 in the Appendix A). In order to see what matters more; the degree of persistence or the shock, for a series to return to its earlier level we then shocked the series by 2 percent (double than earlier shock). We found that keeping the degree of persistence same, the size of shock does not matter as it took only a couple of period extra for the series to return to its earlier level when shock was doubled (see Figure 2 in the Appendix B). What matters more is the degree of persistence: higher the
persistence, longer the time needed for series to return to its previous level when a shock hits.
5
23
6
Prior to recent (July 2011) changes in house rent calculation procedure, PBS used to first compile a construction index by taking 24-month moving (geometric) average of construction cost – both labour and material, in the ratio of 40:60 – prevailing in 35-urban centers. Then, weights for house rent of individual cities (obtained through family budget survey) were used to apply to the construction index to obtain an overall HRI. It is the „24-months moving
average‟ which generates inertia in the HRI.
7
We have also conducted the lag selection procedure using Schwarz (1978) information criterion but the results were not much different.
8
Levine and Piger (2004) also observed that inflation persistence falls considerably when structural breaks are accounted.
9
We have also estimated the AR(1) coefficient as well as SARCs for the shorter span of time (last 36 months) - to reduce the impact of structural break in the mean inflation rate. But the results were found almost similar to what we obtained while estimating the degree of inflation persistence in the presence of structural break. These can be obtained on request.
10Countries for which last decade‟s average inflation have been (statistically) equal to that of Pakistan‟s last
decade‟s average inflation. Monthly CPI data for these countries is taken from IMF-IFS online for July 01 to latest available.
11
Prices for seasonal commodities are not reported for each of the 12 months in a year.
12