ISSN Online: 2163-0437 ISSN Print: 2163-0429
Influence of Land Use Activities on Riparian
Vegetation, Soil and Water Quality: An Indicator of
Biodiversity Loss, South West Mau Forest, Kenya
Naomi Njue, Eric Koech, Joseph Hitimana, Peter Sirmah*
School of Natural Resource and Environmental Management, University of Kabianga, Kericho, Kenya
Abstract
Watershed and riparian areas of Mau Forest Complex in Kenya are experiencing in-creased threats due to unsustainable land use activities geared towards economic growth amidst growing population. This study was carried out to examine effects of land use activities on riparian vegetation, soil and water quality along two major riv-ers (Chemosit and Kipsonoi) of South West Mau Forest (SWMF). Land use activities adjacent to these rivers and biodiversity disturbance on the riparian zone were iden-tified and underpinned to changes on Total Nitrogen, Total Phosphorous, Potas-sium, Sulphur, Cadmium, Copper, Lead, Total Suspended Solids and soil Organic Carbon. Three sampling sites designated(upstream, midstream and downstream) were identified and established along each river as guided by existing land use activi-ties represented by forest, tea plantation and mixed agricultural farming respectively. At each sampling site, a 200 m × 50 m section was systematically marked on each side of the river bank; the longest side being parallel to the river flow and divided in-to three belts transects each 20 m × 50 m, spaced 70 m apart. Six distinct land use ac-tivities (indigenous forest, food crop, tree and tea farming, livestock keeping and ur-ban settlement) were identified as the major land use activities in SWMF. Plant spe-cies richness decreased and overall riparian disturbance increased from upstream (intact canopy with native vegetation) to mid-stream and downstream as epitomized by the structure, biodiversity disturbance resulting from extensive and intensive farming, intrusion of exotic species to livestock grazing and urban settlement. Varia-tion among sampling sites in Total Suspended Solids, pH, Total Nitrogen, Phospho-rus and Potassium were associated to different land use activities along the riparian zone. Total Nitrogen and water pH showed significant sensitivity to land use changes (p < 0.05). Put together these results indicate loss of biodiversity, riparian distur-bance hence a need to adopt environmental-friendly land use planning and sustaina-ble farming systems in SWMF.
How to cite this paper: Njue, N., Koech, E., Hitimana, J., & Sirmah, P. (2016) Influence of Land Use Activities on Riparian Vegeta-tion, Soil and Water Quality: An Indicator of Biodiversity Loss, South West Mau For-est, Kenya. Open Journal of Forestry, 6, 373- 385.
http://dx.doi.org/10.4236/ojf.2016.65030
Received: March 31, 2016 Accepted: September 2, 2016 Published: September 5, 2016
Copyright © 2016 by authors and Scientific Research Publishing Inc. This work is licensed under the Creative Commons Attribution International License (CC BY 4.0).
http://creativecommons.org/licenses/by/4.0/
Keywords
Mau Forest, Riparian Vegetation, Kenya
1. Introduction
Watershed degradation in the developing countries due to anthropogenic activities is increasingly becoming a threat to the natural water resources (GoK, 2009; Mati et al., 2008). As a result, most rural areas are undergoing rapid and far reaching land use changes. Many researchers including Olson and Matina (2006) concur that most of the changes are mainly associated with intensification of agriculture and expansion of mixed-crop livestock systems into former grazing land and other natural areas. In addi-tion there is increased deforestaaddi-tion and encroachment of the forests hence reduced forest cover (Enanga et al., 2011).
Changes in land use patterns in Kenya are linked to a rapidly increasing population in rural areas (Mira, 2004). This growth rate translates to an increased pressure and demand for land resources especially in the watershed regions such as Mau Forest Complex. As a result, there is continuing watershed degradation reflected through di-minishing forest cover, reduced water quality, soil productivity, loss of riparian vegeta-tion and wetland areas leading to a decline in the ecological stability of these systems (Matano et al., 2015).
SWMFC is considered the most important of the five main watershed areas in Kenya because of its immense economic, social and environmental contributions to the coun-try (GoK, 2009). It is the main source of Chemosit and Kipsonoi rivers among other major rivers that drain into the Lake Victoria Basin. Despite the critical role in sup-porting environmental, socio-economic and biological processes, South West Mau Forest Complex has been greatly deforested through excision and encroachment for settlement and farmland (Gok, 2009; Kinyanjui, 2009). This high rate of vegetation loss has led to decline in the ecological and hydrological changes that may threaten the sus-tainable future of areas downstream, biodiversity conservation and livelihood support systems (Litman, 2011; Masese et al., 2011).
Riparian areas are essential for diminishing negative impacts of land use activities on rivers (Mitsch & Day, 2006; Enanga et al., 2011). However, the riparian areas in SWMFC are experiencing diverse development initiatives likely to have also considerably re-duced the biodiversity and increased threats to these river systems (GoK, 2009). This study set out to determine how land use activities have affected riparian structure, water and soil qualities along Chemosit and Kipsonoi rivers in South West Mau Forest Complex.
2. Materials and Methods
2.1. The Study Site
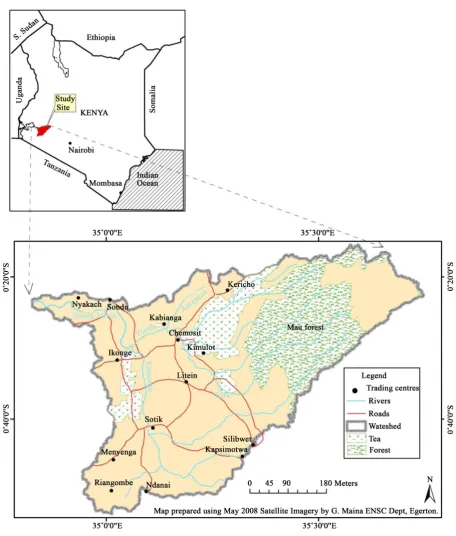
Forest Complex (SWMFC). It lies at 0.14˚ - 0.78˚ South and 35.28˚ - 35.70˚ West at an altitude ranging from 1600 m - 3000 m above sea level (Kinyanjui, 2009). Kipsonoi riv-er extends from the South Westriv-ern Mau main escarpment, flows through Sotik and fi-nally drains to Sondu river. On the other hand, Chemosit river, flows through Kimulot, Itare, and Nyakach before entering Lake Victoria(Calamari et al., 1995) (Figure 1).
The area receives conventional type of rainfall generally exhibiting bimodal pattern which is well distributed throughout the year with an average rainfall of 1000 mm to 2000 mm∙yr−1 with the highland areas receiving cumulative annual rainfall of
approx-imately 1835 mm which decreases to about 1500 mm∙yr−1 towards the lowlands. There
is a short dry spell in January and February while April and May are the wettest months and short rains in November and December. The temperatures in the area range from 18˚C to 22˚C with the lowland having an annual temperature of 26˚C. July is the cold-est month with an average of 16˚C while February is hottcold-est with average temperatures of 20˚C (GoK, 2009).
2.2. The Study Design
Three Sampling sites (designated upstream, midstream and downstream) were identi-fied to represent different predominant land uses along each river as guided by existing land use activities represented by forest, tea plantation and mixed agricultural farming respectively as follows: Chemosit river {Itare, Chemosit bridge, Kipranye bridge} and Kipsonoi rivers {Bosto, Chebilat bridge, Sondu bridge}. Sampling sites were restricted to a 200 m long upstream section of the river on either side of the bank and near bridges to enhance accessibility. In addition, sampling was started 30 m away from the bridge and forest margins to avoid edge effects.
In each of the sampling site, 3 water sampling points were identified at an interval of 100m. For soil sampling 3 belt transects (50 m × 20 m) were laid systematically on both sides of the river bank at an interval of 70 m apart. The transects were laid perpendicu-lar to the river flow to encompass the most heterogeneity (Stohlgren et al., 1995). In each transect, plots were created according to a modified procedure developed by Hi-timana et al. (2004). The belts were subdivided into 5 contiguously units of 10 m × 20 m sampling plots. 2 m × 10 m nested sampling units were established within each 0.02 ha plots. The same sampling design was adopted in all sampling sites along the two riv-ers.
2.2.1. Water and Soil Sample Collections
Water sampling was done from the middle and the two edges of the river bank. This was replicated 3 times at every 100 m section of the river. On the other hand, soil sam-ples were collected diagonally in 0.02 ha plots transects at 10 cm depth and at the 1st (10
m), 3rd (30 m) and 5th (50 m) 0.02 ha plots created in each transect from the edge of
riv-er. Soil was scooped, packed in well labeled transparent polythene bags. A total of 108 samples (3 sites × 18 replicates of sample plots × 2 river systems) were collected for analysis.
2.2.2. Land Use Activities Adjacent to River Systems
2.3. Physical and Chemical Analysis of Water
Physical parameters (Total Suspended Solids), chemical parameters (pH, Total Nitro-gen, Total Phosphorous and Total Potassium) and heavy metals (Copper, Cadmium and Lead) was done according to the standard procedures as described in APHA (1998). These are as follows: Total suspended solids were estimated gravimetrically, water pH using a pH meter, Total Nitrogen determined by Kjeldahl digestion. Total phosphorous was determined using the ascorbic acid method (APHA, 1995) while analysis for potassium, copper, cadmium and lead was carried out using Atomic Ab-sorption Spectrophotometer (AAS). Before analysis, calibration standards of different concentrations were prepared. In this particular analysis, each replica representing samples from the middle and the two edges were mixed separately to form a composite sample. A total of 18 composite samples were obtained for the entire water samples collected.
2.4. Physical and Chemical Analysis of Soil
Soil samples were separately air-dried at room temperature, crushed, homogenized and passed through a 2 mm sieve. Soil organic carbon content was determined by the Walkey- Black titration method (Nelson & Sommers, 1982). Total Nitrogen was determined us-ing the Kjeldahl distillation method (Okalebo et al., 2002). Potassium, Sulphur, Phos-phorous, Cadmium, Copper, and Lead were analyzed using inductivity couple plasma spectrophotometer (ICPS). Soil pH was determined using a pH meter.
3. Results and Discussions
3.1. Land Use Activities Adjacent to Chemosit and Kipsonoi Rivers Table 1 below shows the major land use activities adjacent to each of the two rivers.
[image:5.595.197.555.549.703.2]Chemosit and Kipsonoi rivers traverses through different land use types. In this case, six distinct land use activities were identified along based on their dominant land uses and characteristics. Generally there is a variation in land use activities from upstream to downstream. Upstream is dominated by indigenous forest characterized by dense
Table 1. Land use activities adjacent to Chemosit and Kipsonoi rivers.
Study sites Sampling sites Major land use activities Major crops
Chemosit river
Upstream Indigenous Forest None
Midstream Tea growing, tree farming, food crop, livestock keeping and urban land. Tea, maize, bananas, beans and pi-neapples
Downstream Food crop farming, tree farming and livestock keeping
Maize, pineapples, beans and bananas
Kipsonoi river
Upstream Indigenous Forest None
Midstream Food crop farming, tree farming, livestock keeping and urban land finger millet, sorghum and beans Bananas, maize, kales,
Downstream Food crop farming, tree planting,
network of trees and bushes with little human disturbance. From the edge of the forests towards midstream, the land opens up to a rich upland agricultural area of extensive and intensive farming characterized by tea plantation and few human settlements. Moving downstream, grazing and mixed agricultural farming predominate with more permanently settled small scale farmers and urban set-up with high population and economic activities. From our results, farming plays an important role in South West Mau catchment and is in agreement with findings by Calamari et al., 1995; Jaetzold and Schmidt, 2009.
Figure 2 reports the overall riparian biodiversity disturbance in South West Mau catchment.
Upstream riparian vegetation was least disturbed with native vegetation present on both sides of the river, intact canopy and with continuous woody vegetation along the riparian zone, dense ground cover and river banks in natural condition. Midstream ri-parian vegetation is in poor condition characterized by isolated woody vegetation, li-mited ground cover and disturbed banks. In addition there is a high disturbance of the riparian zone by stock or through the intrusion of exotic species, although some native species remain. Valley vegetation is clearly agriculture with native vegetation clearly disturbed and with a high percentage of introduced species present. Downstream ripa-rian vegetation is severely disturbed on both sides as indicated by reduced and absence of riparian vegetation.
3.2. Effect of the Land Use Activities on Water Quality
[image:6.595.196.554.484.683.2]The mean values and standard deviation of water physico-chemical variables at differ-ent sampling sites along the two rivers of Chemosit and Kipsonoi are presdiffer-ented in Ta-ble 2 below.
Table 2. Mean concentration levels and standard errors (±) of nutrients, total suspended solids
and heavy metals along Chemosit (c) and Kipsonoi (k) rivers.
Physico-chemical water parameters Upstream Midstream Downstream
Total SS (mg/l) ck45.39 ± 10.98 24.89 ± 6.43
84.33 ± 19.68 72.61 ± 23.85
40.50 ± 9.96 64.56 ± 13.31 pH kc7.04 ± 0.057.01 ± 0.94aba 7.17 ± 0.59
ab
6.91 ± 0.07a 6.53 ± 0.10 b
7.22 ± 0.07ab
Total Nitrogen (mg/l) kc3.73 ± 0.525.18 ± 0.68ab 6.74 ± 0.74 b
5.70 ± 0.48b 5.48 ± 0.83 ab
2.70 ± 0.75a
Total Phosphorus (mg/l) ck0.03 ± 0.01 0.04 ± 0.07 0.06 ± 0.01 0.06 ± 0.01 0.04 ± 0.01 0.06 ± 0.01
Potassium (mg/l) ck1.63 ± 0.06 1.63 ± 0.03
1.55 ± 0.35 1.78 ± 0.02
1.56 ± 0.54 1.58 ± 0.09 Cadmium (mg/l) ck1.26 ± 0.30
2.04 ± 0.51
0.48 ± 0.80 1.41 ± 0.7
1.35 ± 0.74 2.08 ± 0.51 Copper (mg/l) ck1.53 ± 1.01
2.45 ± 1.81
3.38 ± 1.44 2.57 ± 0.40
3.84 ± 0.52 0.63 ± 0.23 Lead (mg/l) ck0.80 ± 0.32
0.71 ± 0.33
1.28 ± 0.64 1.15 ± 0.58
Upstream Midstream Downstream
Figure 2. Overall riparian biodiversity disturbance.
During the study period, significant differences were observed in Water pH and To-tal Nitrogen between sampling sites. Tukey’s test showed that the mean water pH at upstream sampling site differed significantly from that recorded at downstream of Chemosit river. Along Kipsonoi river, the mean water pH differed significantly between midstream and Downstream sampling sites. In both rivers, the mean value for water pH ranged from 6.9 (slightly acidic) to 7.2 (slightly alkaline). However these values fall within the pH range associated with most natural waters of 6.5 to 8.5 (World Health Organization, 2000). Most ecosystems are sensitive to changes in pH while certain or-ganisms prefer different ranges of pH (Kinyua & Pacini, 1991). The reported land use activities in SWMF do not seem to modify the pH of the water. Indeed soils and land use activities affect the proportion of major ions in water bodies and hence the water pH (Bailey et al., 1994).
On the other hand, along Chemosit river significant differences were observed in to-tal nitrogen between upstream and midstream sampling sites and between upstream and downstream along Kipsonoi river, respectively. The high Total Nitrogen concen-trations of 6.7 mg/l and 5.7 mg/l observed midstream of the two rivers could be asso-ciated with adjacent urban and agricultural land use activities. According to (FAO, 1996) agricultural activities can lead to an increased flux of nitrogen into water bodies while use of fertilizers on agricultural land has been associated to high nutrient levels at such sites (Wu et al., 2006).
Further, total suspended solids, potassium, total phosphorous, cadmium, lead and copper did not however show any significant differences. Total Suspended Solids were highest midstream on both rivers. This variation could be associated to the different land use activities reported for these sites, run-off from agriculture, soil erosion as well as in- stream activities such as car washing. Presence of indigenous forests, absence of agricultural activities, intact riparian zones characterized by dense vegetation explain the low levels of Total Suspended Solids in the upstream of the two rivers (Andrea et al., 2009; Masese et al., 2011). However total suspended solids in SWMF ranged from 24 - 84 mg/l which is below WHO (2000) limits of 1000 mg/l of suspended solids of drinking water.
concen-trations of phosphorous in surface waters usually range from 0.005 to 0.02 mg/l, while the Environmental Protection Agency (EPA) recommends a 0.1 mg/l for aquatic sys-tems to prevent accelerated eutrophication (Buda et al., 2010). Low concentrations of total phosphorus (0.03 mg/l and 0.04 mg/l) recorded upstream of Chemosit and Kip-sonoi rivers is linked to the undisturbed dense network of trees. In undisturbed forested areas, streams are believed to have good water quality with low concentration of nu-trients (Andrea et al., 2009). The dense riparian vegetation within the forest land use are effective buffers in filtering out most of the nutrients from the surface run-off (Enanga et al., 2011). These findings mirror previous studies that concluded that water quality is greatly linked to land use in a catchment (Triest et al., 2012)and confirms several studies that have shown agriculture and urban land use as a primary predictor for nitrogen and phosphorous in stream water (Ahearn et al., 2005; Triest et al., 2012).
The amount of heavy metals represented by Cd, Cu and Pb did not differ significant-ly across sites and their concentration did not follow any trend from upstream to downstream. These results agree with previous study that metal concentrations at sites located relatively high up in the catchment were comparable to, or higher than concen-trations of these metals downstream. These values are linked to effluent discharge, agricultural and urban run-off, washing and bathing activities by local inhabitants and livestock access to the rivers. In addition degradation of the forest cover and other anthropogenic activities going on inside the forest, atmospheric deposition and geology weathering are potential sources of these metal ions (Dabrowski & Klerk, 2013).
3.3. Effect of the Land Use Activities on Soil Quality
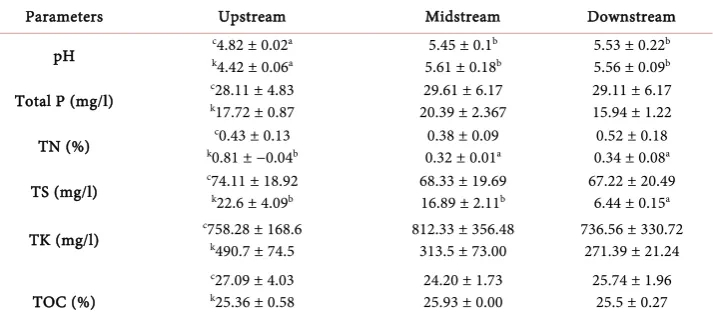
[image:8.595.196.553.522.680.2]The mean values and standard deviation of soil physico-chemical variables at different sampling sites along the two rivers of Chemosit and Kipsonoi are presented in Table 3 below. The low soil pH upstream might be due to the presence of slightly higher organ-ic carbon content in the soil. Variability in total organorgan-ic carbon along the two river
Table 3. Mean concentration levels and standard errors (±) of soil properties along Chemosit (c)
and Kipsonoi (k) rivers.
Parameters Upstream Midstream Downstream
pH ck4.82 ± 0.024.42 ± 0.06aa
5.45 ± 0.1b
5.61 ± 0.18b
5.53 ± 0.22b
5.56 ± 0.09b
Total P (mg/l) ck28.11 ± 4.83 17.72 ± 0.87
29.61 ± 6.17 20.39 ± 2.367
29.11 ± 6.17 15.94 ± 1.22 TN (%) k0.81 ± −0.04c0.43 ± 0.13 b
0.38 ± 0.09 0.32 ± 0.01a
0.52 ± 0.18 0.34 ± 0.08a
TS (mg/l) c74.11 ± 18.92 k22.6 ± 4.09b
68.33 ± 19.69 16.89 ± 2.11b
67.22 ± 20.49 6.44 ± 0.15a
TK (mg/l) c758.28 ± 168.6 k490.7 ± 74.5 812.33 ± 356.48 313.5 ± 73.00 736.56 ± 330.72 271.39 ± 21.24
TOC (%)
c27.09 ± 4.03
k25.36 ± 0.58 24.20 ± 1.73 25.93 ± 0.00 25.74 ± 1.96 25.5 ± 0.27
systems is linked to the reduction in organic material being returned to the soil system due to decreasing vegetation cover downstream and oxidation of soil organic matter as a result of continuous cultivation along the riverbanks, uncontrolled grazing and browsing, loss of organic matter by water erosion and removal of green materials. These results are in agreement with other studies that reported that the soil organic content differed with different land use types (Yimer et al., 2007; Girmay et al., 2008). The higher organic matter content upstream may be attributed to a higher accumula-tion of organic matter due to high inputs from root biomass (Yimer et al., 2007). Varia-bility in total nitrogen is linked to difference in soil organic matter content, intensities in cultivation and erosion, application of manures, pesticides and fertilizers rich in ni-trogen content in the soils (Moges & Holden, 2008).
The mean values and standard deviation of soil physico-chemical variables at differ-ent sampling sites along the two rivers of Chemosit and Kipsonoi are presdiffer-ented in Table 3. In this study , soil pH ranged between 4.42 and 5.56, implying the soils are strongly acidic and suitable for tea production which was consistent with previous stu-dies carried out in tea plantations (Matano et al., 2015). Soil pH was lowest in soils ob-tained Upstream on both rivers, with significant differences across the sampling sites. Tukey’s test showed that soil pH at upstream differed significantly from soil pH rec-orded midstream and downstream of Chemosit and Kipsonoi rivers. The low soil pH upstream might be due to the presence of slightly higher organic carbon content in the soil. The low soil pH at the upstream corresponded with a high soil organic carbon at the same site Total organic carbon did not show significance difference, however the levels varied across sampling sites along the Chemosit and Kipsonoi rivers. Variability in total organic carbon along the two river systems is linked to the reduction in organic material being returned to the soil system due to decreasing vegetation cover down-stream and oxidation of soil organic matter as a result of continuous cultivation along the riverbanks, uncontrolled grazing and browsing, loss of organic matter by water ero-sion and removal of green materials. These results are in agreement with other studies that reported that the soil organic content differed with different land use types (Yimer et al., 2007; Girmay et al., 2008). The higher organic matter content upstream along Chemosit river may be attributed to a higher accumulation of organic matter due to high inputs from root biomass (Yimer et al., 2007).
Variability in total phosphorous is related to the application of animal manure and application of diammonium phosphate (DAP) fertilizer on the adjacent farmlands. Lower phosphorous content in the soil along Kipsonoi river as compared to Chemosit river could be related to phosphorous fixation especially in forested areas, crop harvest in agricultural farms and erosion by water (Yimer et al., 2006). Highest content of phosphorous was recorded at the Midstream of Chemosit river majorly dominated by large scale tea production and lowest downstream of Kipsonoi river. According to Ma-tano et al. (2015), land use has a significant effects on soil chemical properties. The le-vels of soil nutrients (P and N) can be used to deduce the degree at which a given site is degraged. Potassium levels could be attributed to the relative pumping of potassium from the subsoil by vegetation in the forest land. Lower potassium levels downstream could be attributed to soil degradation and losses by leaching due to reduced vegetation cover (Bohn et al., 2001).
Figure 3 and Figure 4 report the amount of Cadmium, copper and lead in soils along Chemosit and Kipsonoi river. Cadmium showed lowest concentration as compared
Figure 3. Cadmium, copper and lead content in soils at different sites along Chemosit river.
Figure 4. Cadmium, copper and lead content in soils at different sites along Kipsonoi river.
0 1 2 3 4 5 6 7
Cadmium Copper Lead
M
ea
n C
on
ce
nt
ra
tio
ns
(m
g/
l)
to copper and lead. However, considering the Canadian soil quality guidelines, all the metals were within the maximum allowable values for agriculture soil; 50 - 60 mg/kg; 1.4 mg/kg and 70 mg/kg ranges for copper, cadmium and lead, respectively (Noorikh et al., 2013).
4. Conclusion
Indigenous forest, food crop farming, tree farming, tea growing, livestock keeping and urban settlement were identified as the major land use activities in SWMF. This pro-vided a clear insight on the various land use types along the course of Chemosit and Kipsonoi rivers. Plant species richness decreases and biodiversity disturbance increased from upstream (intact canopy native vegetation), through a mixture of native and exot-ic species in midstream to livestock grazing and urban settlement downstream. Varia-tion in Total Suspended Solids, pH, Total Nitrogen, Phosphorus and Potassium were associated to different land use activities along the riparian zone. Total Nitrogen and water pH showed significant sensitivity to land use changes. The results from this study indicate the need for protection of riparian zones, proper land use planning and adop-tion of sustainable farming systems within the catchment.
References
Ahearn, D. S., Sheibley, R. W., Dahlgren, R. A., Anderson, M., Johnson, J., & Tate, K. W. (2005). Land Use and Land Cover Influence on Water Quality in the Last Free-Flowing River Draining the Western Sierra Nevada, California. Journal of Hydrology, 313, 234-247.
http://dx.doi.org/10.1016/j.jhydrol.2005.02.038
Andrea, G., Veronique, V., Lorenzo, B., Willy, B., & Vanrollegham, P. (2009). Model-Based As-sessment of Shading Effect by Riparian Vegetation on River Water Quality. Ecological
Engi-neering, 35, 92-104. http://dx.doi.org/10.1016/j.ecoleng.2008.09.014
APHA (1995). Standard Methods for Examination of Water and Wastewater (20th ed.). Wash-ington, DC: American Public Health Association.
APHA (1998). Standard Methods for the Examination of Water and Wastewater. Washington, DC: American Public Health Association, American Water Works Association, and Water Pollution Control Federation.
Bailey, R. G., Busulwa, H., & Williams, A. (1994). Fish and Aquatic Ecosystems in the Ruwenzori
Mountains, Ugandas (p. 106). Darwin Initiative Report, London: Kings College London.
Bohn, H. L., McNeal, B. L., & O’Connor, G. A. (2001). Soil Chemistry (3rd ed., p. 307). New York: John Wiley & Sons, Inc.
Buda, A. R., Kleinman, P. J. A., Bryant, R., & Allen, A. (2010). Impact of Legacy Phosphorus Sources on Diffuse Pollution from Agriculture: Lessons from the Chesapeake Bay Watershed. In: E. van Bochove et al. (Eds.), Diffusepollution and Eutrophication: 14th International Water
Association Conference of the Diffuse Pollution Specialist Group (p. 63). IWA Publ., London.
Calamari, D., Akech, M. O., & Ochumba, P. B. O. (1995). Pollution of Winam Gulf, Lake Victo-ria, Kenya: A Case Study for Preliminary Assessment. Lakes and Reservoirs: Research and
Management, 1, 89-106. http://dx.doi.org/10.1111/j.1440-1770.1995.tb00010.x
Enanga, M., Shivoga, W., Maina-Gichaba, C., & Creed, F. (2011). Observing Changes in Riparian Buffer Strip Soil Properties Related to Land Use Activities in River Njoro Watershed, Kenya.
Water and Air Soil Pollution, 218, 587-601. http://dx.doi.org/10.1007/s11270-010-0670-z
FAO (1996). Control of Water Pollution from Agriculture. Written by Ongley, E.D. FAO Irriga-tion and Drainage Paper, No. 55.
Girmay, G., Singh, B. R., Mitiku, H., Borresen, T., & Lal, R. (2008). Carbon Stocks in Ethiopian Soils in Relation to Land Use and Soil Management. Land Degradation and Development, 19, 351-367. http://dx.doi.org/10.1002/ldr.844
GoK (2009). Rehabilitation of the Mau Forest Ecosystem, Project Concept by the Interim Coor-dinating Secretariat, Office of the Prime Minister, September 2009.
Hitimana, J., Kiyiapi, J. L., & Njunge, J. T. (2004). Forest Structure Characteristics in Disturbed and Undisturbed Sites of Mt. Elgon Moist Lower Montane Forest, Western Kenya. Forest
Ecology and Management, 194, 269-291. http://dx.doi.org/10.1016/j.foreco.2004.02.025
Jaetzold, R., & Schmidt, H. (2009). Farm Management Handbook of Kenya, Vol. 2 (2nd ed.). Ministry of Agriculture, Kenya, in Co-Operation with the Germany Agency for Technical Co-Operation (Gtz).
Kinyanjui (2009). Assessment of Trends in Forest Changes Induced by Human Pressure in
Western and South Western Mau Reserves.
Kinyua, A. M., & Pacini, N. (1991). The Impacts of Pollution on the Ecology of the Nairobi Athi River Systems in Kenya. Journal of Bio-Chemical Physics, 1, 57.
Litman T. (2011). Evaluating Transportation Land Use Impacts Considering the Impacts,
Bene-fits and Costs of Different Land Use Development Patterns. Victoria: Victoria Transport Policy
Institute.
Masese, F. O., Raburu, P. O., Mwasi, B. N., & Etiégni, L. (2011). Effects of Deforestation on Water Resources: Integrating Science and Community Perspectives in the Sondu-Miriu River Basin, Kenya. In Oteng-AmoakoAa (Ed.), New Advances and Contributions to Forestry Research (pp. 1-18). Rijeka: Intech Publishers.
Matano, A. S., Kanangire, C. K., Anyona, D. N., Abuom, P. O., Gelder, F. B., Dida, G. O., Owour, P. O., & Ofulla, A. V. O. (2015). Effects of Land Use Change Degradation Reflected by Soil Properties along Mara River, Kenya and Tanzania. Open Journal of Soil Science, 5, 20-38.
http://dx.doi.org/10.4236/ojss.2015.51003
Mati, B. M., Mutie, S., Gadain, H., Home, P., & Mtalo, F. (2008). Impacts of land-Use/Cover Changes on the Hydrology of the Transboundary Mara River, Kenya/Tanzania. Lakes and
Re-servoirs: Research and Management, 13, 169-177.
http://dx.doi.org/10.1111/j.1440-1770.2008.00367.x
Mira, O. (2004). Land Use Changes in Central Kenya from the 1950s—A Possibility to Genera-lise? GeoJournal, 51, 203-209.
Mitsch, W. J., & Day Jr., J. W. (2006). Restoration of Wetlands in the Mississippi-Ohio-Missouri (MOM) River Basin: Experience and Needed Research. Ecological Engineering, 26, 55-69.
http://dx.doi.org/10.1016/j.ecoleng.2005.09.005
Moges, A., & Holden, N. M. (2008). Soil Fertility in Relation to Slope Position and Agricultural Land Use: A Case Study of Umbulo Catchment in Southern Ethiopia. Environmental
Man-agement, 42, 753-763.http://dx.doi.org/10.1007/s00267-008-9157-8
Nelson, D. W., & Sommers, L. E. (1982). Organic Carbon. In Methods of Soil Analysis. Agrono-my Monograph, 9 (2nd ed). Madison USA.
Applications, 16.
Okalebo, J. R., Gathua, K. W., & Woomer, P. L. (2002). Laboratory Methods for Soil and Plant
Analysis: A Working Manual (2nd ed.). Nairobi: Tropical Soil Biology and Fertility Program,
Nairobi.
Olson, J. M., & Maitima, J. M. (2006). Sustainable Intensification of Mixed Crop-Livestock
Sys-tems, Land Use Change Impacts and Dynamics (Lucid). Nairobi: International Livestock
Re-search Institute.
Ouma, K. O., Mungai, N. W., & Kitaka, N. (2013). Temporal Variation of Sedimentation from Surface Runoff from Agricultural Land Uses in Sondu-Miriu Basin, Kenya. Research Journal of
Environmental and Earth Sciences, 5, 577-590.
Stohlgren, T. J., Falkner, M. B., & Schell, L. D. (1995). A Modified-Whittaker Nested Vegetation Sampling Method. Plant Ecology, 117, 113-121.http://dx.doi.org/10.1007/BF00045503
Triest, L., Lungayia, H., Ndiritu, G., & Beyene, A. (2012). Epilithic Diatoms as Indicators in Tropical African Rivers (Lake Victoria Catchment). Hydrobiologia, 695, 343-360.
World Health Organization (2000). Guidelines for Drinking Water Quality. New York: World Health Publication.
Wu, Q., Li, H.-R., Wang, J., Paulussen, Y., He, M., Wang, B., & Wang, Z. (2006). Monitoring and Predicting Land Use Change in Beijing Using Remote Sensing and GIS. Landscape and Urban
Planning, 78, 322-333.http://dx.doi.org/10.1016/j.landurbplan.2005.10.002
Yimer, F., Ledin, S., & Abdelkadir, A. (2007). Changes in Soil Organic Carbon and Total Nitro-gen Contents in Three Adjacent Land Use Types in the Bale Mountains, South-Eastern High-lands of Ethiopia. Forest Ecology and Management, 242, 337-342.
http://dx.doi.org/10.1016/j.foreco.2007.01.087
Submit or recommend next manuscript to SCIRP and we will provide best service for you:
Accepting pre-submission inquiries through Email, Facebook, LinkedIn, Twitter, etc. A wide selection of journals (inclusive of 9 subjects, more than 200 journals)
Providing 24-hour high-quality service User-friendly online submission system Fair and swift peer-review system
Efficient typesetting and proofreading procedure
Display of the result of downloads and visits, as well as the number of cited articles Maximum dissemination of your research work