www.impactjournals.com/oncotarget/ Oncotarget, Vol. 7, No. 45
ZSCAN5B and primate-specific paralogs bind RNA polymerase
III genes and extra-TFIIIC (ETC) sites to modulate mitotic
progression
Younguk Sun1,2, Huimin Zhang1,2, Majid Kazemian1,4, Joseph M. Troy1,3, Christopher Seward1,2, Xiaochen Lu1,2 and Lisa Stubbs1,2
1 Institute for Genomic Biology, University of Illinois at Urbana-Champaign, Urbana, IL, USA
2 Department of Cell and Developmental Biology, University of Illinois at Urbana-Champaign, Urbana, IL, USA 3 Illinois Informatics Program, University of Illinois at Urbana-Champaign, Urbana, IL, USA
4 Laboratory of Molecular Immunology and the Immunology Center, National Heart, Lung, and Blood Institute, National
Institutes of Health, Bethesda, MD, USA
Correspondence to: Lisa Stubbs, email: ljstubbs@illinois.edu
Keywords: zinc finger transcription factor, primate-specific duplication, RNA Polymerase III transcription, chromatin architecture, cell cycle, Chromosome Section
Received: August 13, 2016 Accepted: September 20, 2016 Published: October 06, 2016
ABSTRACT
Mammalian genomes contain hundreds of genes transcribed by RNA Polymerase III (Pol III), encoding noncoding RNAs and especially the tRNAs specialized to carry specific amino acids to the ribosome for protein synthesis. In addition to this well-known function, tRNAs and their genes (tDNAs) serve a variety of other critical cellular functions. For example, tRNAs and other Pol III transcripts can be cleaved to yield small RNAs with potent regulatory activities. Furthermore, from yeast to mammals, active tDNAs and related “extra-TFIIIC” (ETC) loci provide the DNA scaffolds for the most ancient known mechanism of three-dimensional chromatin architecture. Here we identify the ZSCAN5 TF family - including mammalian ZSCAN5B and its primate-specific paralogs - as proteins that occupy mammalian Pol III promoters and ETC sites. We show that ZSCAN5B binds with high specificity to a conserved subset of Pol III genes in human and mouse. Furthermore, primate-specific ZSCAN5A and ZSCAN5D also bind Pol III genes, although ZSCAN5D preferentially localizes to MIR SINE- and LINE2-associated ETC sites. ZSCAN5 genes are expressed in proliferating cell populations and are cell-cycle regulated, and siRNA knockdown experiments suggested a cooperative role in regulation of mitotic progression. Consistent with this prediction, ZSCAN5A knockdown led to increasing numbers of cells in mitosis and the appearance of cells. Together, these data implicate the role of ZSCAN5 genes in regulation of Pol III genes and nearby Pol II loci, ultimately influencing cell cycle progression and differentiation in a variety of tissues.
INTRODUCTION
Most eukaryotic genes are transcribed by RNA Polymerase II (RNA Pol II) and its attendant
transcriptional machinery. However, a significant number
of non-coding RNAs (ncRNAs), including tRNAs, 5SRNA, U6 small nuclear RNA, and other essential transcripts, depend on the activity of RNA Polymerase III (Pol III) (reviewed in [1]). Pol III promoters exist in
three major types, depending on their locations relative to the transcription start site (upstream of or internal to the transcript) and distinct sets of general transcription factors (TFs) - TFIIIA, TFIIIB and TFIIIC. Despite their different structures, Pol II and Pol III promoters share many features. For example, active promoters of both gene types
are marked by similar configurations of modified histones [2]; furthermore, several TFs classically identified as Pol
II regulators, such as MYC, P53 and MAF1, also regulate the expression of Pol III genes (reviewed in [3]).
Because they are central to basic cellular functions including translation, Pol III transcripts are essential to cellular survival. However, tRNAs and other Pol III transcripts also play a variety of other critical, noncanonical roles. Notably, active tDNAs are key participants in the most ancient known mechanism of chromatin organization, clustering together within the nucleus to serve chromatin barrier, insulator and other regulatory functions [4-7]. Most vertebrate tDNAs are organized in genomic clusters at syntenically homologous positions, thus providing a stable and conserved framework for chromatin structure [8]. However, not all TFIIIC binding sites are so highly conserved. In particular, extra-TFIIIC, or ETC sites, also called “chromatin organizing clamps” in yeast, interact with each other and
with tDNA to influence chromatin architecture [9, 10].
In mammals, Pol III and TFIIIC binding sites include transposable elements such as MIRs, ALUs and other SINE subfamilies that were originally derived from
Pol III transcription units [11]. These lineage-specific
transposable elements (TEs) greatly outnumber the conserved tDNA sites in mammalian genomes.
Furthermore, tRNAs and other Pol III transcripts, including the RNA component of RNase MRP (encoded by RMRP), are processed to generate small RNAs with diverse roles in cell proliferation and differentiation [12, 13]. The expression of individual Pol III genes and thus, their participation in both traditional and extra-translational functions varies according to cell type, cellular state and developmental stage [14-18], and
in different cell types [2, 16, 18-20]. The selection of specific tDNAs for expression or silencing has direct
developmental consequences [21], and indirect effects on
the transcription of nearby Pol II genes [6, 19, 22, 23].
Possibly relevant to this indirect effect, tRNA expression plays a decisive role in nuclear clustering and thus likely, the selection of alternative anchors for chromatin loops
[8, 10, 23, 24].
Here we report the DNA-binding functions of ZSCAN5B, a protein encoded by a unique eutherian
SCAN domain-containing zinc finger (SCAN-ZNF) gene,
and two human paralogs (ZSCAN5A and ZSCAN5D) that arose in early primate lineages. Primate ZSCAN5A
and ZSCAN5D have diverged from ZSCAN5B in both
sequence and tissue-specific expression patterns, but
share expression in dividing cell populations with a distinct peak around the time of mitosis. Combining chromatin immunoprecipitation sequencing (ChIP-seq) with analysis of gene expression after siRNA knockdown, we discovered that Pol III genes and ETCs are the strongly preferred binding sites for mouse Zscan5b and human ZSCAN5 proteins, and that ZSCAN5 gene knockdown alters expression of the Pol III genes. We also documented the dysregulation of nearby polymerase II (Pol II)-transcribed genes that predict cooperative functions in control of mitosis and cell fate decisions in
multiple tissues. Consistent with these predictions, stable knockdown of ZSCAN5A led to the accumulation of cells in mitosis and aneuploidy in cultured human cells. Based on these data, we conjecture that ZSCAN5B evolved in eutherians to directly modulate the activities of ancient Pol III gene activities including secondary effects on nearby Pol II genes. Further we hypothesize that in primates,
ZSCAN5A and ZSCAN5D evolved to independently extend these regulatory activities to a wider range of TFIIIC binding sites, including those carried by MIR and L2 repeat-associated ETCs.
RESULTS
The ZSCAN5 family arose by duplication of conserved Zscan5b in early primate history
Zscan5b is a unique gene in mouse and most other eutherian genomes, but primate genomes contain four very closely related gene copies, annotated as human
ZSCAN5A, ZSCAN5B, ZSCAN5C and ZSCAN5D [25]. Human ZSCAN5B is the ortholog of the single mouse
gene as confirmed by overall sequence similarity as well
as the alignment of the DNA-binding amino acids of
each zinc finger (corresponding to amino acids -1, 2, 3,
and 6 relative to the alpha-helix) [26-28] (Figure 1). For
simplicity, as we have in a recent paper [29], we will refer
to this pattern of DNA-binding amino acid quadruplets as
a protein’s “fingerprint” in the following discussion.
Mouse, marmoset and human ZSCAN5B proteins
share almost identical fingerprints, but the three primate-specific paralogs have diverged from the parental gene in fingerprint patterns. After an initial phase of divergence
in early primate history, these patterns have been very
well conserved (Figure 1). In contrast to the zinc fingers,
the SCAN domains of the four human ZSCAN5 family
members are nearly identical (95-98% identity between
members; not shown). Since SCAN mediates protein
dimer formation [30, 31], this suggests that ZSCAN5
family members could form homo/heterodimers, cooperating in different combinatorial patterns in tissues and cell types where they are co-expressed.
We found orthologs of all four human genes in the
ZSCAN5 paralogs display overlapping but unique patterns of expression
Overlapping but distinct patterns of tissue-specific
expression in human tissues
Publicly available data indicated that both human and mouse ZSCAN5 genesare expressed at high levels in testis but at very low levels in most other adult tissues.
To further examine expression profiles of ZSCAN5 family
members, we used quantitative reverse transcript PCR (qRT-PCR) to measure transcript levels of the unique mouse Zscan5b and all four human ZSCAN5 genes in panels of RNA derived from adult and embryonic tissues (Figure 2A-2D). ZSCAN5C transcripts were not detected, or were detected near background levels, in every tissue we tested (not shown). As expected, mouse Zscan5b
and all three expressed human paralogs were detected at highest levels in adult testis; in adult mouse, we also found
Zscan5b transcript in thymus, fetal liver and placenta with lower levels of expression in brain, lung and skeletal muscle. Quantitative RT-PCR across a similar panel of
tissues revealed significant overlaps, but also showed that
each of the human duplicates displays distinct features of gene expression compared to each other and to the unique mouse gene; ZSCAN5A and ZSCAN5B expression patterns
overlap significantly, while the ZSCAN5D expression
pattern has diverged most significantly from the other
human paralogs and the mouse gene.
Human ZSCAN5 genes display a peak of mitotic expression
ZSCAN5A was identified in a previous study as one of ~850 genes expressed in a cell cycle stage-specific pattern, with transcription peaking around the M/G1 transition [32]. To confirm this finding and to
investigate the cell-cycle expression patterns for other
ZSCAN5 genes, we synchronized HEK-293 cultures
using a double thymidine (TT) block, which synchronizes the cells at early S-phase [33]. We collected cells at different time points after release to test gene expression levels of ZSCAN5A, ZSCAN5B, and ZSCAN5D by
qRT-PCR, together with marker genes expressed at specific
cell cycle stages [CCNE1 (expression peak at G1/S),
RRM2 (S), CDC2 (G2), BUB1 (G2/M) and PTTG1 (M/ G1)]. ZSCAN5B and ZSCAN5D showed clear peaks of expression beginning around 14h after the release, consistent with peak transcription during the M/G1 period (Figure 2E; Supplementary Table 1A). ZSCAN5A
expression showed a similar expression pattern consistent with the published reports although RNA levels peaked somewhat sooner than the M/G1 transition, beginning around G2/M according to our experiments.
Mouse and human ZSCAN5B are expressed in populations of actively dividing cells
To identify cell type-specific expression patterns for
[image:3.612.156.456.415.617.2]the conserved paralog in vivo, we developed probes for in situ hybridization (ISH) from the unique 3’-untranslated
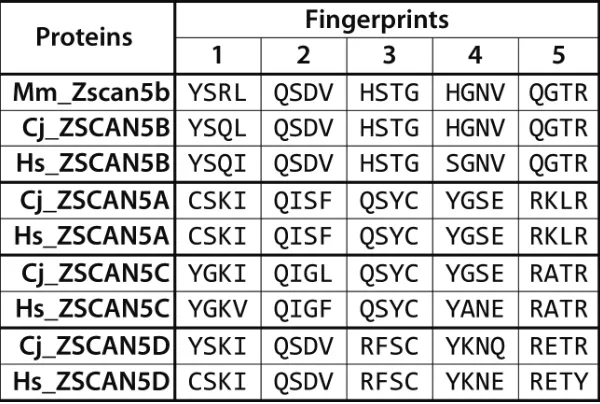
Figure 1: Diverged DNA-binding “fingerprint” patterns for primate-specific ZSCAN5 proteins. Amino acid residues
corresponding to DNA-binding positions (1-, 2, 3, and 6 relative to the alpha helix) in each of the five zinc fingers in ZSCAN5 proteins predicted from mouse (Mm), human (Hs), and marmoset (Cj) genomes are shown aligned in the C- > N terminal order of the zinc fingers in
each gene. Mouse and other mammals contain a single gene, Zscan5b, which was duplicated in early primate history to generate three new gene copies: ZSCAN5A, ZSCAN5C, and ZSCAN5D (Mm_Zscan5b: ENSMUSG00000058028, Cj_ZSCAN5B: ENSCJAG00000020279, Hs_ZSCAN5B: ENSG00000197213, Cj_ZSCAN5A: ENSCJAG00000037918, Hs_ZSCAN5A: ENSG00000131848, Cj_ZSCAN5C: ENSCJAG00000020275, Hs_ZSCAN5C: ENSG00000204532, Cj_ZSCAN5D: ENSCJAG00000014787, Hs_ZSCAN5D: ENSG00000267908). The fingerprints of the novel duplicates have diverged relative to the ancestral gene copy, but once generated, these
(3’UTR) regions of the mouse and human Zscan5b/ ZSCAN5B genes. For mouse, we hybridized probes to sagittal sections of whole embryos taken at 14.5 days post-coitum (E14.5), E16.5 and E18.5; for human, we
examined paraffin sections of a selection of adult tissues
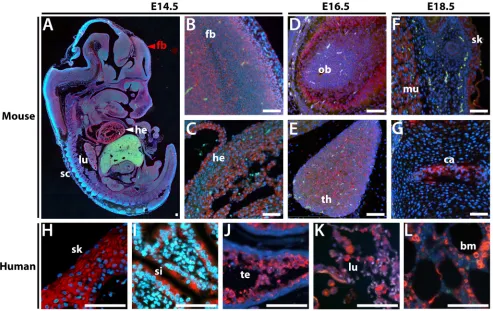
on a tissue array. Mouse Zscan5b displayed highest expression in E14.5 heart (Figure 3A, 3C), alveoli of the developing lungs, spinal cord and forebrain (Figure 3A, 3B). Heart and lung expression was diminished but expression remained particularly high in the olfactory bulb (Figure 3D) and thymus (Figure 3E) at E16.5. By E18.5, expression was high in developing skeletal muscle and skin (Figure 3F) and cartilage and lower level in bone in the vertebral column (Figure 3G) the intestinal epithelia; expression detected but at reduced levels in the E18.5 forebrain (not shown). In human tissues, ZSCAN5B was also detected in adult skin (Figure 3H), epithelial cells in the small intestine (Figure 3I), testicular spermatocytes
(Figure 3J), lung epithelia (Figure 3K), and bone marrow
(Figure 3L); thymocytes were also strongly positive for human ZSCAN5B, while tissue cores taken from several adult brain regions were not (not shown). In general, therefore, human adult gene expression was highest in tissues and cell types with high levels of cellular turnover and cell division. Interestingly, despite qRT-PCR data
suggesting distinct patterns of relative tissue-specific
expression levels (Figure 2A), the cell types and tissues that express Zscan5b in mouse embryos overlapped considerably with those that displayed high levels of human ZSCAN5B in adults.
Gene knockdown experiments reveal clues to shared and unique cellular functions
Testing RNA from a panel of human cell lines with
qRT-PCR confirmed the high and virtually ubiquitous
[image:4.612.68.544.288.629.2]expression of ZSCAN5A in cultured cells. However, very
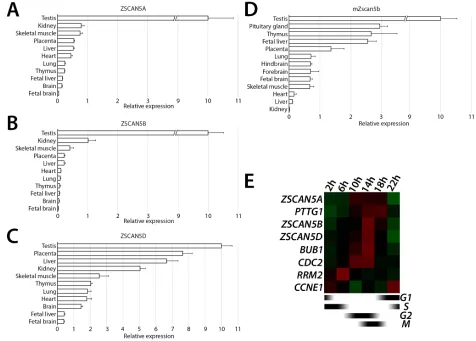
Figure 2: Tissue- and cell cycle stage-specific expression ZSCAN5 family genes. Relative transcript levels measured in cDNA prepared from total tissue RNA for A. human ZSCAN5A, B. ZSCAN5B, C. ZSCAN5D, and paralogous gene for D. mouse Zscan5b by
qRT-PCR. Relative expression in other tissues was normalized to expression level in testis, which was set as 10. Error bars correspond to the
variance between experimental triplicates. E. Heat map showing the patterns of expression for ZSCAN5A, ZSCAN5B, and ZSCAN5D in
HEK-293 cells collected at different times after release from a double thymidine block to synchronize cells at early S-phase. Expression
few cell lines also expressed ZSCAN5B or ZSCAN5D (not shown). With the goal of examining paralog function in
the same cellular context, we identified two lines in which
all three paralogs were expressed - BeWo, a trophoblast-like cell line derived from choriocarcinoma, and
HEK-293, derived from human embryonic kidney but with
neuronal characteristics [34] for further study.
Since transfection is particularly efficient for HEK-293 cells, we used HEK-HEK-293 for siRNA knockdown
experiments. We tested a number of independent siRNA designs, both commercially available and custom, for
each gene to assess efficiency and specificity of paralog
knockdown. Most siRNA designs displayed off-target
effects that significantly reduced levels of at least two
of the ZSCAN5 genes under conditions we tested (not shown). However, two of the siRNA reagents (hereafter called si4 and si5) reduced levels of ZSCAN5A relatively
efficiently. The two siRNA designs differed in their
impact on paralogous genes, producing some effect on ZSCAN5D (si5) or even some over-expression of
ZSCAN5B (si4). Additionally, we found a single siRNA design that knocked down ZSCAN5B transcripts quite
well and specifically (si1). We identified one siRNA
design (si2) that allowed a reasonable degree of ZSCAN5D
knockdown without reducing levels of either of the other two ZSCAN5 genes, but treatment with si2 increased
ZSCAN5B transcripts levels significantly in HEK-293 cells
(Figure 4A; Supplementary Table 1B). Unlike ZSCAN5A,
we could not find a second siRNA that knocked down
ZSCAN5D without significantly affecting the levels of the
other genes, complicating further functional analysis of this paralog.
We analyzed RNA from HEK-293 cells treated
with si1, si4, si5, and a scrambled control using RNA-seq to identify differentially expressed genes (DEGs). Since two independent siRNA designs could be tested for
ZSCAN5A, gene expression analysis after knockdown of this paralog yielded the most robust and reliable DEG set (363 genes detected with adjusted P > 0.05, fold change >
[image:5.612.60.553.310.621.2]1.5; Supplementary Table 2). Analyzing these DEGs with
Figure 3: In situ hybridization in sectioned embryos and adult human tissues shows that ZSCAN5B expression is
highest in rapidly dividing cell populations. Sagittal sections of paraffin embedded mouse embryos at E14.5, E16.5, and E18.5
were hybridized with a Zscan5b antisense RNA probe detected with TSA-Rhodamine (Red), against a DAPI counterstain (blue). A. Whole
the DAVID functional analysis program [35] revealed very
high enrichment for specific functional categories in the
up- and down-regulated genes (Table 1). Notably, genes up-regulated after ZSCAN5A knockdown (e.g. negatively regulated by ZSCAN5A) included cell cycle regulators especially proteins controlling spindle attachment, chromosome condensation and segregation and the metaphase/anaphase transition. Down-regulated DEGs (positively regulated by ZSCAN5A) were significantly
enriched for functions including transcriptional regulation and cell-fate commitment in a variety of tissues.
Genes differentially expressed after human
ZSCAN5B knockdown displayed significant levels of
overlap with ZSCAN5A DEGs, with 100 of the 363
ZSCAN5A DEGs being detected as similarly up- or down-regulated in the ZSCAN5B siRNA experiment (Supplementary Table 2). Since the ZSCAN5A
knockdown experiments we analyzed did not reduce levels of ZSCAN5B and vice versa (Figure 4A), these data suggested some level of functional cooperation between the paralogous proteins. Nevertheless, the ZSCAN5B DEG set also emphasized some novel functions including those
related to tRNA and rRNA processing and modification
(up-regulated DEGs) (Table 1); as for ZSCAN5A, genes down-regulated after ZSCAN5B knockdown were enriched for functions related to differentiation and development. Interestingly, the tissues predicted to be affected by
[image:6.612.58.494.80.511.2]ZSCAN5A and ZSCAN5B functions -including kidney, gut,
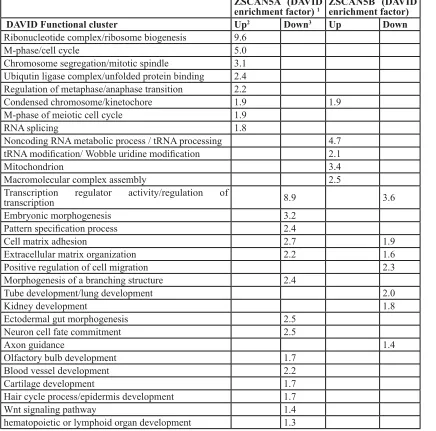
Table 1: Gene Ontology (GO) clusters identified as significantly enriched in gene sets up- or down-regulated after ZSCAN5 gene siRNA knockdown. (Note: this is new, data from 48h KD)
ZSCAN5A (DAVID
enrichment factor) 1 ZSCAN5B (DAVID enrichment factor) DAVID Functional cluster Up2 Down3 Up Down Ribonucleotide complex/ribosome biogenesis 9.6
M-phase/cell cycle 5.0
Chromosome segregation/mitotic spindle 3.1 Ubiqutin ligase complex/unfolded protein binding 2.4 Regulation of metaphase/anaphase transition 2.2
Condensed chromosome/kinetochore 1.9 1.9
M-phase of meiotic cell cycle 1.9
RNA splicing 1.8
Noncoding RNA metabolic process / tRNA processing 4.7
tRNA modification/ Wobble uridine modification 2.1
Mitochondrion 3.4
Macromolecular complex assembly 2.5 Transcription regulator activity/regulation of
transcription 8.9 3.6
Embryonic morphogenesis 3.2
Pattern specification process 2.4
Cell matrix adhesion 2.7 1.9
Extracellular matrix organization 2.2 1.6 Positive regulation of cell migration 2.3 Morphogenesis of a branching structure 2.4
Tube development/lung development 2.0
Kidney development 1.8
Ectodermal gut morphogenesis 2.5 Neuron cell fate commitment 2.5
Axon guidance 1.4
Olfactory bulb development 1.7
Blood vessel development 2.2
Cartilage development 1.7
Hair cycle process/epidermis development 1.7
Wnt signaling pathway 1.4
hematopoietic or lymphoid organ development 1.3
1 David enrichment scores are calculated as the geometric mean of –log transformed P-values of GO terms within a cluster
cartilage, hematopoietic/lymphoid tissues, and olfactory bulb - overlapped well with expression sites determined by qRT-PCR and ISH for the human and/or mouse genes (Table 1; Figure 2, Figure 3).
ZSCAN5 proteins bind to tRNA genes and ETC sites in human and mouse
ChIP with paralog-specific antibodies
To identify reagents for detection of ZSCAN5
proteins, we identified commercial antibodies targeting
ZSCAN5B and ZSCAN5D, and designed peptide epitopes from a sequence-divergent region of human ZSCAN5A and from the mouse Zscan5b protein to generate custom polyclonal antibodies (see Methods). These antibodies
identified nuclear proteins of the correct sizes in BeWo and HEK-293 nuclear extracts which reduced in overall
levels after siRNA knockdown of each gene; densitometry revealed a reduction of ZSCAN5A, 5B, and 5D proteins
by 84%, 67%, and 80%, respectively (Figure 4B; Supplementary Table 1C). These results confirmed antibody specificities and provided additional support for
the functional efficiency of siRNA knockdowns.
We performed ChIP-sequencing using the antibodies to human ZSCAN5A, ZSCAN5B, and ZSCAN5D in
HEK-293 and BeWo cells with ChIP-seq from BeWo
cells yielding by far the best results. ZSCAN5B peaks in BeWo chromatin were particularly clear, with very little background and strong enrichment in a limited number of genomic positions (a total of 672 peaks; 225 of which were detected with MACS software at a false discovery
rate (fdr) = 0; Supplementary Table 2). ZSCAN5A and
ZSCAN5D ChIP-seq experiments displayed a higher rate of background but also included larger numbers of clearly enriched peaks. ZSCAN5A and ZSCAN5D
ChIP-seq experiments from the HEK-293 cell line were not
successful, but ZSCAN5B ChIP yielded a small number
of clear peaks (101 peaks) in this cell line. Because
antibodies for all three proteins gave excellent results in BeWo chromatin, we focused on results from BeWo ChIP-seq datasets for most types of peak analysis and used the
ZSCAN5B HEK-293 ChIP-seq experiments primarily
[image:7.612.144.469.356.613.2]for cell-to-cell comparisons and for functional studies including association of peaks with siRNA knockdown DEGs.
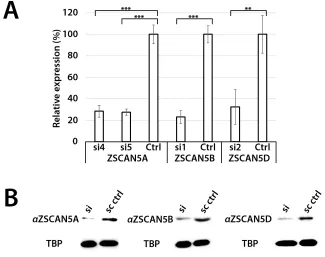
Figure 4: siRNA knockdown of ZSCAN5 and antibody specificity. HEK-293 cells were transfected with 10 nM of siRNA
targeting ZSCAN5A (si4, si5), ZSCAN5B (si1), or ZSCAN5D (si2) for 48h, after which RNA and nuclear protein extracts were collected.
A. qRT-PCR of each sample showed 71.6% (si4) and 72.6% (si5) knockdown of ZSCAN5A transcripts, 76.9% (si1) knockdown of ZSCAN5B
transcripts, and 67.6% (si2) knockdown of ZSCAN5D transcripts. P-values to evaluate the significance of each knockdown were generated from triplicate experiments using one-way ANOVA (**: P ≤ 0.01, ***: P ≤ 0.001) B. To assess the knockdown of each protein and to
test antibody specificities, Western blots were generated with nuclear protein extracts of the same siRNA knockdowns and stained with
ZSCAN5B preferentially binds tDNA in human and mouse cells
We noticed immediately that the summits of the most high-scoring ZSCAN5B peaks in both BeWo and
HEK-293 cell lines were positioned centrally inside
tRNA genes. In particular, ZSCAN5B peak summits were highly enriched in tDNA sequences (p = 0; Table 2). Of the 672 ZSCAN5B BeWo peaks, 240 peaks
overlapped with tDNA sequences; 64 of the 74 tDNA
peaks identified by ZSCAN5B ChIP-seq in HEK-293 (86.5%) were also identified in this BeWo tDNA peak set
(Supplementary Table 2). The ZSCAN5B-bound tDNAs in both cell types correspond to a variety of different amino acids and codons without obvious enrichment of a particular type (Supplementary Tables 2, 3). In all but one case, the bound tDNAs comprised a subset of the 522 loci annotated as active human tRNA genes [36]; a single annotated tDNA pseudogene from chromosome 2
was bound by ZSCAN5B at relatively low efficiency in
the BeWo cell line. However, this pseudogene was also
identified as bound by both TFIIIC and Pol III in other
human cell types, suggesting that it may be expressed (
[19]; Supplementary Table 2) Although tRNA expression
or Pol III occupancy has not been measured in the BeWo
or HEK-293 cell lines, all but 10 of the tDNAs bound by ZSCAN5B in BeWo and all tDNAs bound in HEK-293
cells were found previously to be commonly expressed in a variety of mammalian cell types ( [37]; these peaks are marked in Supplementary Table 2). Therefore, we surmise that ZSCAN5B preferentially binds to a subset of the active human tRNA genes.
As a comparison to the human ZSCAN5B ChIP-seq dataset, we used the mouse Zscan5b antibody for ChIP-seq in cells isolated from dissected mouse fetal placenta. We
identified 118 peaks, dominated by peaks mapping directly
onto a nested subset of the same tDNA sequences, located in syntenically homologous positions, as those detected by the human ZSCAN5B antibody (Supplementary Table 4). These similarities are remarkable, given that the ChIP experiments were used chromatin sources from different species and cellular sources - that is, from transformed human cell lines and mouse fetal placental tissue. Together these data provide strong support for the notion
that ZSCAN5B favors binding to a specific subset of
conserved tDNAs.
Almost all of the highest-scoring ZSCAN5B and
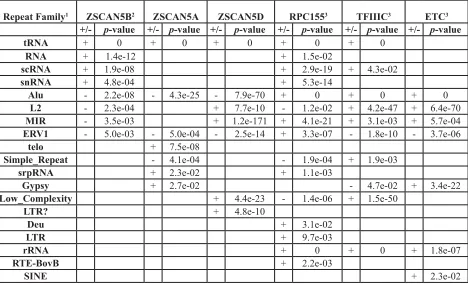
Table 2: Relative enrichment (+) or under-representation (-) of specific repeat families in collections of
ZSCAN5, RPC155, TFIIIC, and ETC ChIP peaks
Repeat Family1 ZSCAN5B2 ZSCAN5A ZSCAN5D RPC1553 TFIIIC3 ETC3 +/- p-value +/- p-value +/- p-value +/- p-value +/- p-value +/- p-value
tRNA + 0 + 0 + 0 + 0 + 0
RNA + 1.4e-12 + 1.5e-02
scRNA + 1.9e-08 + 2.9e-19 + 4.3e-02
snRNA + 4.8e-04 + 5.3e-14
Alu - 2.2e-08 - 4.3e-25 - 7.9e-70 + 0 + 0 + 0
L2 - 2.3e-04 + 7.7e-10 - 1.2e-02 + 4.2e-47 + 6.4e-70
MIR - 3.5e-03 + 1.2e-171 + 4.1e-21 + 3.1e-03 + 5.7e-04
ERV1 - 5.0e-03 - 5.0e-04 - 2.5e-14 + 3.3e-07 - 1.8e-10 - 3.7e-06
telo + 7.5e-08
Simple_Repeat - 4.1e-04 - 1.9e-04 + 1.9e-03
srpRNA + 2.3e-02 + 1.1e-03
Gypsy + 2.7e-02 - 4.7e-02 + 3.4e-22
Low_Complexity + 4.4e-23 - 1.4e-06 + 1.5e-50
LTR? + 4.8e-10
Deu + 3.1e-02
LTR + 9.7e-03
rRNA + 0 + 0 + 1.8e-07
RTE-BovB + 2.2e-03
SINE + 2.3e-02
1 Repeat family names and locations taken from repeat masker, http://www.repeatmasker.org/ ; a full accounting with
enrichments and depletions for specific elements in each family is provided in Supplementary Table 3.
2 ChIP peaks from the BeWo cell line, focused on all fdr=0 peaks (ZSCAN5B) or all peaks with enrichment > 15 for ZCAN5A
and ZSCAN5D, as reported in Supplementary Table 2.
3 Peak coordinates for these feature types are taken from [19], and were lifted over to human genome sequence build hg19
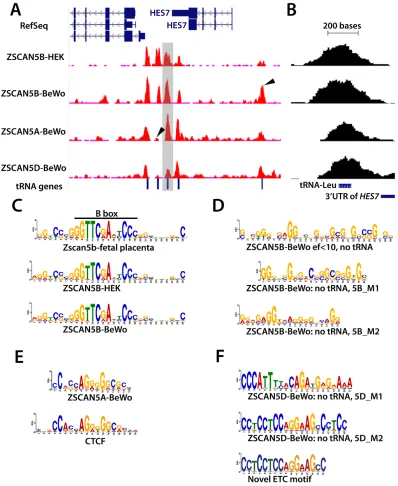
[image:8.612.64.532.78.362.2]Figure 5: ZSCAN5 binding displays a protein- and cell type-specific preference for tDNAs and other Pol III-related loci enriched in G/C rich motifs. A. Distribution of ChIP-seq reads in the HES7 region is displayed in a snapshot from the UCSC browser. ChIP-seq read pileups are shown in red, with the distribution of background reads from genomic input displayed in brown.
Peaks from ZSCAN5B in chromatin from two cell lines, HEK-293 and BeWo, shown together with peak profiles from ZSCAN5A and
ZSCAN5D ChIP-seq in BeWo chromatin, reveal strong enrichment over tRNA genes that are clustered in the region. Arrows in peak tracks highlight some of the peaks that are differentially enriched by ZSCAN5B ChIP in the two cell types, or in ChIP with ZSCAN5B compared to ZSCAN5A or ZSCAN5D. The tRNA-Leucine (tRNA-L) gene shown in close-up in panel B is highlighted in grey. B. A close-up view of the tDNA highlighted in grey in panel A, illustrating that the ChIP-seq peak summits are centered over the tDNAs. C. Motifs detected
as most highly enriched and central in ChIP-seq peaks for mouse Zscan5b and human ZSCAN5B in HEK-293 or BeWo cells include the
TFIIIC-binding B-box, which is present and highly conserved in all expressed tDNAs, and strikingly similar tracts of G/C-rich surrounding DNA. D. A motif search conducted after removing tDNA sequences from the ZSCAN5B BeWo peak set also revealed G/C-rich sequences, including an extended motif comprising two shorter motifs (5B_M1, 5B_M2) as predicted ZSCAN5B binding motifs. E. A G/C rich central motif was also detected in analysis of ZSCAN5A ChIP peaks; a portion of this motif bears striking resemblance to the known motif for transcription factor and insulator protein, CTCF. F. A distinct set of motifs were detected in high-scoring ZSCAN5D peaks, including a G/C
mouse Zscan5b peaks overlapped tDNAs, but ChIP-seq also detected common enrichment in other types of Pol III transcripts including Vault RNA, 7SLRNA, RMRP, and U6 snRNA. Accordingly, ZSCAN5B peaks were enriched for many of the same classes of RNA genes that are occupied by Pol III (measured by ChIP-seq with an antibody to the RPC155 subunit) and Pol III TF required for tRNA transcription, TFIIIC, as reported previously
by Moqtaderi and colleagues [19] (Table 2). The small
number of peaks that did not overlap with RNA Pol III genes was also interesting. For example, several individual peaks with high intensity were found to overlie MIR and Alu SINE repeats, which are evolutionarily derived from tRNA and 7SL RNA, respectively [38]. One particular
example, identified in human ZSCAN5B ChIP-seq in BeWo and HEK-293 cells as well as mouse Zscan5b
ChIP-seq in fetal placenta corresponds to a MIR repeat located approximately 1 kb downstream of the promoter of POLR3E, encoding the RPC5 subunit of Pol III (Supplementary Tables 2, 4); this MIR element has been shown to function as an enhancer for the POLR3E gene [17].
ZSCAN5A and ZSCAN5D binding sites are also enriched in Pol III transcripts
ZSCAN5A and ZSCAN5D binding sites were also highly enriched in tDNA sequences (Table 2). In fact, the three proteins appear to co-occupy many tDNA sites or to occupy neighboring tDNAs within the same genomic clusters (Supplementary Table 2) although with
different relative efficiencies. One particularly interesting
set of examples is illustrated in Figure 5A; the clustered tDNAs in this region are differentially marked by the human ZSCAN5 proteins. A close-up of a tRNA-Leucine (tRNA-L) gene located just downstream of HES7 and occupied in all of the ChIP experiments (Figure 5B; this tDNA is shaded in Figure 5A) illustrates the general position of the peak summits (or centers of the peaks) relative to the tRNA genes. As shown in Figure 5B, although ChIP peaks were generally broader than the tRNA genes per se (due to the standard chromatin shearing size for ChIP, see Methods), the summits are positioned directly over the middle of the genes.
[image:10.612.169.437.337.617.2]The tDNAs in this chromosome 17 region, which surround the ALOXE3, HES7 and PER1 genes, have been
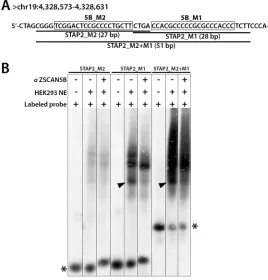
Figure 6: ZSCAN5B proteins bind G/C rich motifs. To test the prediction that the ZSCAN5B protein binds to the G-rich motifs,
we tested the summit region of a non-tDNA peak uniquely detected with high efficiency by ZSCAN5B in ChIP located within an intron of the STAP2 gene (human assembly GRCh37, chr19:4,328,490-4,328,689) which contains two predicted motifs. A. Biotin-labeled oligonucleotides were designed to cover fragments of the peak region including the “5B_M2” motif (boxed) and “5B_M1” (boxed) motif, respectively, and also a longer oligonucleotide spanning both motifs. Labeled probes containing 5B_M2 were named “STAP2_M2” (27 bp), 5B_M1 as “STAP2_M1” (28 bp), and the longer prone as “STAP2_M2+M1” (51 bp). B. Nuclear extracts (NE) containing a biotinylated
probe (Labeled probe) with or without anti-ZSCAN5B antibody (αZSCAN5B) were resolved on 6% non-denaturing polyacrylamide gels. Addition of αZSCAN5B caused the effective supershift of the lowest band of three “shift” complexes for STAP2_M1 and STAP2_M2+M1
demonstrated previously to serve as anchors of local chromatin loops that function as insulators in human
cells [10]. tDNAs throughout the genome also displayed ZSCAN5 protein-specific peaks and for ZSCAN5B, cell type-specific enrichment patterns (Supplementary Table
2). These data suggest that the ZSCAN5A, B, and D proteins all bind to tDNA sequences but can have different locus preferences within the same cell type; ZSCAN5B also clearly binds to certain tDNA loci more or less
efficiently depending on the cellular context.
Motif analysis reveals binding preferences for ZSCAN5 proteins
ZSCAN5A and ZSCAN5B proteins bind G/C rich motifs
We used the MEME suite [39] to search for enriched
sequence motifs enriched at the summits of the highest-scoring ZSCAN5A, ZSCAN5B and ZSCAN5D peak regions (see Methods). The analysis of ZSCAN5B peak summit regions revealed clear enrichment for a sequence including the TFIIIC-binding B box as the top-scoring, centrally located motif; Zscan5b peaks in mouse fetal placenta chromatin also yielded a very similar extended and central B Box motif (Figure 5C). The B Box motif is positioned internally to tRNA genes as an integral component of the Type 2 Pol III promoter [1]; that the B Box is positioned centrally within summits of the collected ChIP peaks indicates that ZSCAN5B binds very near the B Box site. The A box motif typical to Pol III
Type 2 promoters was also identified as highly enriched
in ZSCAN5B ChIP experiments although the motif was not central to the peaks (not shown). It was not at all surprising to identify these motifs, given that the A and B box elements in tDNAs are very distinct and very well conserved between sites.
However, there are several reasons to doubt that ZSCAN5B protein actually binds to the B Box site. In particular, although tRNA binding sites are by far the
most numerous, ZSCAN5B also bound with high affinity
to other types of genomic, including regions not associated with Pol III binding and Pol III transcripts - such as U6 and RMRP - that are expressed from Type 3 promoters
without a B Box motif [1, 40]. However, the enriched
motifs also included less distinct G/C-rich DNA sequences extending beyond the B box (Figure 5C), and we therefore hypothesized that ZSCAN5B might in fact bind to this G/C-rich DNA sequence.
To gain more detailed information about the binding motif, we examined 134 highly enriched (MACS
enrichment factor or ef > 10) ZSCAN5B BeWo peaks not associated with tDNAs. MEME analysis identified a long (29 bp) G-rich motif located centrally within the peaks
(detected at E value of 2.6e-26, in 56 of the 134 peak sites). Adjusting MEME parameters to search for shorter
motifs (since with 5 zinc fingers, ZSCAN5B is expected to bind at most to a 15 nt target region) identified two
similarly G/C-rich motifs, which we call 5B_M1 (detected at E value of 6.5e-12) and 5B_M2 (E = 1.7 e-02) (Figure
5D). ZSCAN5A peaks were also enriched in B-Box motif (E = 6.1e-46) and A-Box motifs (E = 5.0e-15), although
neither motif was located centrally to the peak regions
(not shown). However, MEME analysis identified a
G/C-rich motif that was centrally located in ZSCAN5A peak summits. This 5A-enriched motif (detected at E =
2.3e-29) bears a striking resemblance to the known binding
motif for transcription factor and chromatin organizer, CTCF (Figure 5E). Interestingly, CTCF has been shown
to be enriched at mammalian ETC sites [19] and tDNAs
[37], and the enrichment of CTCF motifs centrally within ZSCAN5A binding regions suggests that the two proteins may possibly interact or compete at those sites. Whatever this interaction, both ZSCAN5A and ZSCAN5B
ChIP-seq experiments identified G/C-rich motifs as potential
binding sites.
To ask whether the ZSCAN5B protein binds to the G-rich motifs, we selected one highly enriched ZSCAN5B peak region for the “supershift” version of electrophoretic mobility shift assays (EMSA). The tDNAs are repetitive and mostly occupied by the very large Pol III protein complex, and these properties complicate EMSA experiments. Therefore, we focused on a non-tDNA and high intensity peak uniquely detected by ZSCAN5B, located within an intron of the STAP2 gene (human
assembly GRCh37, chr19:4,328,490-4,328,689). The peak
summit region contains side-by-side high-scoring matches to 5B_M1 and 5B_M2 motifs. We designed biotin-labeled oligonucleotides that span the two motifs for EMSA testing (Figure 6).
Both double-stranded oligonucleotides from the
STAP2 intronic region were shifted after addition of
the HEK-293 nuclear extract, although the 5B_M1
oligonucleotide and a longer oligonucleotide containing both 5B_M1 and 5B_M2 were shifted much more intensely. Addition of the ZSCAN5B antibody caused the smallest of three “shift” complexes for 5B_M1 and the longer oligonucleotide with both motifs (arrowheads in
Figure 6) to be supershifted efficiently. Although, given
the nature of these experiments, we cannot rule out the possibility that ZSCAN5B might bind these sequences indirectly, e.g. through an intermediate protein also present in the extract, these data indicated that ZSCAN5B binds to
the G/C-rich sequence commonly identified in the tRNA
and non-tRNA binding peaks.
ZSCAN5D binding is enriched at MIR SINEs and LINE2-associated ETC motifs
ZSCAN5D peaks did overlap with ZSCAN5A and ZSCAN5B at tDNAs, but the highest-scoring peaks for the ZSCAN5D antibody were distinctly bound. In
were proximal (within 5 kb) to the transcription start
site (TSS), while 80% of ZSCAN5A and ZSCAN5B
peaks were distal to TSS. Enriched repetitive element classes also distinguished ZSCAN5D peaks from those associated with ZSCAN5A or ZSCAN5B. In particular, unlike ZSCAN5A or ZSCAN5B peaks, ZSCAN5D peaks were enriched for MIR and L2 repeats; in this respect the ZSCAN5D binding regions more closely resembled ETCs (Table 2). Furthermore, analysis of ZSCAN5D binding peaks revealed a distinct set of centrally enriched
motifs. The first and most highly enriched motif identified
in this peak dataset (5D_M1) corresponded to a novel sequence containing similarity to the known motif for GATA-1 (detected at E = 1.2e-524; Figure 5F). The
second significantly enriched motif found at the center of
predicted ZSCAN5D summits, or 5D_M2 (E = 1.4e-293)
is notable because it is virtually identical to a novel
ETC-associated motif identified previously in human cells [19]
(Figure 5F). The two ZSCAN5D peak-enriched motifs were mostly distributed in distinct peak summits, although several ChIP summits contained both predicted motifs in close proximity.
Closer inspection revealed that 5D_M1 mapped frequently within annotated MIR SINE repeats, while 5D_ M2 was contained within LINE2 (L2) elements; both of these repeat types were highly enriched in the ZSCAN5D ChIP peak dataset as well as ETC sites (Table 2). Analysis of peak sequences after masking repetitive elements within them returned centrally located motifs almost identical to 5D_M2 (E = 2.2 e-91, not shown) and 5D_M1 (E =
1.0e-87). It is therefore likely that ZSCAN5D binds to these motifs whether or not they are embedded in recognizable repeats. These data suggest that ZSCAN5D favors binding
to the previously identified ETC motif and that each of the primate-specific ZSCAN5 proteins likely recognize
G/C-rich sites that are nevertheless distinct from the sites preferentially bound by parental ZSCAN5B.
ZSCAN5 protein binding influences expression of bound Pol III and nearby Pol II genes
To ask whether ZSCAN5 protein binding might affect transcription of either the Pol III genes bound by the proteins or the Pol II genes located nearest those sites, we examined ZSCAN5 ChIP-seq peaks that either
mapped within or flanked DEGs detected after siRNA
knockdown. Since knockdown data could only be
reliably supplied by experiments in HEK-293 cells and ChIP-seq was only successful in HEK-293 cells with the
ZSCAN5B antibody, we focused primarily on peaks and nearby genes associated with ZSCAN5B in that cell line (Supplementary Table 5).
First, we examined Pol III genes to which the ZSCAN5B protein was actually bound. In the case of tDNAs, the protein sits very centrally over the bodies of
the genes, as described above (and illustrated in Figure 5B). The ZSCAN5B peak in RMRP is also situated centrally within the body of the gene rather than at its upstream promoter (Supplementary Table 2). ChIP-seq data revealed that RMRP was bound by ZSCAN5B in
both HEK-293 and BeWo cells and also at lower level
by ZSCAN5A in BeWo chromatin (Supplementary Table 2). This gene, encoding the RNA component of RNase MRP,represents one of the very few Pol III genes with a unique sequence composition, permitting accurate measurement of RMRP transcript levels in RNA-seq.
RMRP was significantly up-regulated (by a factor of 3
or 4 fold, respectively) in both ZSCAN5A and ZSCAN5B
siRNA experiments suggesting that ZSCAN5 protein binding suppresses expression of the gene (Supplementary Table 2). Most other Pol III genes are highly repetitive and all, including RMRP, display very strong and stable secondary structures, making PCR-based measurement of their expression challenging. However, primer sets that can uniquely detect a small number of tRNAs have been reported [17]. Of the genes expressing these tRNAs (encoding tRNA for tyrosine, or tRNA-Y), one was occupied by ZSCAN5A and ZSCAN5B in BeWo cells
and ZSCAN5B in HEK-293; a second gene, encoding to a
tRNA for Arginine (tRNA-R), was occupied by ZSCAN5A and ZSCAN5B in BeWo but not bound by ZSCAN5B in
HEK-293 cells (Supplementary Table 2). The other tRNA
genes for which unique primer sets have been reported were not occupied by ZSCAN5A or ZSCAN5B proteins in either cell type; these primer sets therefore provided excellent negative controls.
We used these validated tRNA primer sets to test expression after ZSCAN5 gene knockdown in
HEK-293 cells, along with primers for RMRP. Consistent with RNA-seq experiments, RMRP was up-regulated after siRNA knockdown as was the tRNA-Y expressed from the locus bound by both ZSCAN5A and ZSCAN5B in
HEK-293 cells (Supplementary Figure 1). The tRNA-R
expressed by the locus occupied by ZSCAN5A in BeWo
but not ZSCAN5B in HEK-293 cells was up-regulated
only slightly after ZSCAN5A knockdown in HEK-293
cells, although not at significant levels (p = 0.09) and was
not affected by knockdown of ZSCAN5B. Furthermore, the expression of tDNAs not bound by either protein in
HEK-293 cells remained unchanged. Although further studies
will be required to test the broader generality of this trend, these data support the hypothesis that ZSCAN5 proteins negatively regulate transcription of Pol III genes to which they are bound.
Next we examined expression status of Pol II genes with transcription start sites (TSS) located in the vicinity
of ZSCAN5B HEK-293 peaks. ZSCAN5B HEK-293
peaks are almost all located directly on top of Pol III genes, and Pol III genes are not frequently located near Pol II gene promoters. Therefore of the 17 ZSCAN5B
peaks, only eight genes -HES7, TRIM7, NDUFS7, TIA1, C17ORF59, C16ORF13, GEMIN7, MIR3648 - were
found within 5 kb of the peaks. The first six of the
above-mentioned genes are adjacent to peaks overlying tDNAs, and in some cases, clusters of ZSCAN5B-bound tDNAs -for example, HES7 which is flanked by clustered tDNA
peaks (Figure 5A; Supplementary Table 5) - whereas other DEGs are positioned near other types of ZSCAN5B peaks. Of the eight genes with TSS within 5 kb of peaks, only
tRNA-linked TIA1 was down-regulated while all others were up-regulated after ZSCAN5B knockdown.
Considering all HEK-293 peak-linked ZSCAN5B
[image:13.612.139.462.166.594.2]DEGs including those with promoters located further from peaks, the picture is more mixed, with 11 genes up-regulated and 6 genes down-regulated after siRNA knockdown (Supplementary Table 5). These gene numbers are too small for concrete conclusions. However, they suggest a trend toward repression of promoters especially
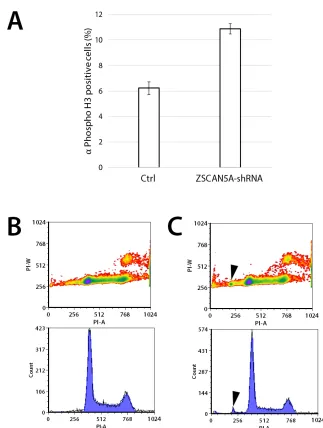
Figure 7: Knockdown of ZSCAN5A increases number of cells entering mitosis and aneuploidy. HEK-293 cells engineered
to stably carry an inducible short hairpin RNA construct targeting ZSCAN5A (ZSCAN5A-Tet-shRNA), or empty-vector control were
incubated with 1 µg/mL doxycycline (Dox) for 48h on gelatin-coated glass cover slips. A. Fixed coverslips were stained with mitotic
marker anti-Phospho-Histone H3 (Ser10) antibody (EMD Millipore), and DAPI to visualize mitotic cells using microscopy, examining totals of more than > 2000 cells per cell line. The number of mitotic nuclei was significantly increased in the shRNA-carrying cells (p =
5.04e-12, two-sample test for equality or proportion without continuity correction; see Methods), with standard errors from the counting of
multiple samples for each cell type shown as error bars. B. Flow cytometry of control and C. ZSCAN5A-Tet-shRNA cells taken 48 h after
Dox treatment consistently revealed the appearance of a small population of cells (average of 2.01%) with lower DNA content compared
to normal G1 cells after ZSCAN5A knockdown (arrows in C). This population was never detected in the Dox-treated (B) or untreated (not shown) control cells we tested. In both experiments, ZSCAN5A knockdown rate was determined by qRT-PCR to be 60 % (A) or 43% (B)
those located nearest to ZSCAN5B-occupied peaks. Further, they also hint that the effects of ZSCAN5 protein binding on nearby Pol II genes may not represent direct transcriptional repression or activation, but could involve more complicated mechanisms.
ZSCAN5A knockdown increases numbers of mitotic cells and aneuploidy
As described above and consistent with previous reports [32], ZSCAN5 paralogs are commonly up-regulated around the time of mitosis (Figure 2). Adding to the intrigue, ZSCAN5A knockdown experiments strongly suggested a role for this gene in regulation of the metaphase/anaphase transition (Table 1). To test
this hypothesis, we engineered HEK-293 cells to stably
carry copies of a plasmid transgene designed to express a tetracycline-regulated (Tet-on) short hairpin RNA (shRNA) based on si4, with the goal of knocking down
ZSCAN5A controllably andstably in HEK-293 cells.
Knockdown of ZSCAN5A was confirmed in
doxycycline (Dox) treated cells carrying the transgene with
qRT-PCR (ranging from 43-53% knockdown in different
experiments, not shown). Although this knockdown rate was consistently lower than achieved by siRNA treatment, these cells expressed phenotypes consistent with the functions predicted by the siRNA knockdown experiments. In contrast to cells transfected with an empty plasmid vector, and as evidenced by expression of mitotic
marker, phosphorylated Histone H3 (ser10), a significantly
larger fraction of ZSCAN5A shRNA-expressing cells were detected at the mitotic phase 48 h after addition of Dox,
consistent with a less efficient transition to anaphase (Figure 7A; Supplementary Table 1D). Furthermore, flow
cytometric analysis revealed the appearance of aneuploid cells after ZSCAN5A knockdown, with DNA content
lower than that of HEK-293 cells (Figure 7B, 7C). The
fraction of aneuploid cells was small in these short-term
experiments (around 2%; Figure 7), but highly consistent
between experimental replicates and repeat experiments in comparison to Dox-treated vector-only cells, which never yielded this aneuploid population (see Methods). Taken together with the siRNA gene expression results, these data suggest that ZSCAN5A depletion leads to abnormalities in spindle assembly or attachment during mitosis, a situation well known to cause metaphase arrest and aneuploidy in mammalian cells [41].
DISCUSSION
Our study defines the regulatory functions of the ZSCAN5 family of TF proteins for the first time.
ZSCAN5 genes are actively expressed in rapidly dividing cell populations and are cell-cycle regulated, with peak
expression around the time of the mitosis, and the encoded proteins bind preferentially to Pol III transcription
units. ZSCAN5B and primate-specific ZSCAN5A bind
preferentially to tDNA, occupying many of the same Pol III genes and similarly affecting the expression of neighboring genes. Based on these data we speculate that the two proteins interact and co-bind DNA as heterodimers through interactions between their nearly identical SCAN dimerization domains.
Our data indicate that when ZSCAN5B binds to Pol III promoters it also acts to negatively modulate the expression of those genes, and suggest that ZSCAN5A has a similar and we conjecture, a cooperative regulatory effect. The mechanisms underlying these functions will require further study but based on data presented here and published reports, we speculate that the differential
expression of flanking Pol II transcripts might arise
secondarily to dysregulation of the bound Pol III genes. Indeed, a number of previous studies have pointed to a relationship between Pol III transcriptional activity and the expression of nearby Pol II genes. For example, in budding yeast, actively expressed tDNAs exert repressive effects on nearby Pol II promoters, a phenomenon referred to as “tRNA gene-mediated silencing” [22, 42]. However, similar effects have not been documented in metazoans. Rather, several lines of evidence suggest a more complex relationship in mammals, with tDNAs, MIR repeats, and other active Pol III-transcribed sequences serving
enhancer-blocking or barrier-insulating functions [10, 17]. Our data do not argue definitely for a particular model, but
do indicate that ZSCAN5B typically represses the activity of Pol III loci to which it is bound, and that the protein may also dysregulate the nearest Pol II genes indirectly through this Pol III binding.
A number of different proteins have been described to regulate Pol III gene transcription in yeasts, in metazoans, or both [3, 43-45]. One deeply conserved Pol III regulator, MAF1, shares many properties with ZSCAN5B and serves as a potential model for its function. From yeast to mammals, MAF1 inhibits transcription from Pol III promoters via interactions with TFIIIB [46, 47]. The involvement of TFIIIB is a particularly interesting in this regard, since Type 2 promoters typical of tDNAs and Type 3 Pol III promoters, such as that associated with RMRP, share binding of TFIIIB but not TFIIIC or other factors [1]. Of further potential relevance, MAF1 also independently represses Pol II promoters [48], and indirectly represses Pol II promoters located near MAF1 binding sites in Pol III genes. Intriguingly, the indirect repression of neighboring Pol II loci relies on
MAF1-dependent regulation of Pol III-stimulated chromatin looping. In particular, Lee and colleagues have recently demonstrated that activity of two Pol II genes, CDKN1A
chromatin loops [23].
By analogy, we speculate that ZSCAN5B might
also influence chromatin loop formation by negatively
modulating activity at bound tDNAs, MIR repeats, and interacting sites; future research will be focused on testing this hypothesis. However, here we should add that chromatin loop formation need not always lead to Pol II gene activation: the remodeling of chromatin contact points can also lead to gene repression through enhancer
blocking and other mechanisms (e.g. [8, 24, 49-51]). If our
hypothesis regarding ZSCAN5 protein function is correct, the positive or negative effects on Pol II genes could be subtle and far-reaching, extending beyond the nearest promoters and depending on the particulars of interactions within the modulated chromatin loops.
Whether directly or indirectly, ZSCAN5A and
ZSCAN5B knockdown robustly affected the expression of large sets of functionally coherent genes, which together provide important clues to their ultimate biological functions. Consistent with its mitotic expression, DEGs
identified after ZSCAN5A knockdown strongly predicted functions related to mitotic spindle formation, chromosome segregation and metaphase-anaphase transition; cells engineered to stably knock down ZSCAN5A expression displayed phenotypes that are highly consistent with this prediction.ZSCAN5B knockdown further suggested a role
in tRNA maturation and modification, and the coordination
of these processes with tRNA synthesis makes excellent sense. Here we should note beyond the essential functions tRNAs serve in protein synthesis, tRNA processing also generates fragments that function as microRNAs and serve other independent signaling functions; the regulation of tRNA processing, per se, can thus exert wide and profound
influences on gene expression and cellular state [13].
Interestingly, many of the biological functions suggested for ZSCAN5 proteins can be encapsulated by a brief summary of known functions for RMRP, which is, as we have mentioned, a directly repressed target of ZSCAN5A and ZSCAN5B. RMRP has been reported to be essential to the processing of ribosomal RNAs, mitochondrial tRNAs, and microRNA precursors [52] and also processes cellular mRNAs, most notably degrading Cyclin B2 mRNA to permit cell cycle progression at the end of mitosis [53]. RMRP mutations are associated with cartilage hair hypoplasia-Anauxetic dysplasia (CHH-AD) spectrum disorders, associated with a range
of symptoms including short-limbed dwarfism, skeletal dysplasia, hair abnormalities, immunodeficiency and
bone marrow failure, gastrointestinal disorders, cognitive defects, and cancer susceptibility [52, 54]. Rather than being caused simply by loss of RNase MRP function
per se, many CHH-AD symptoms are thought to reflect
malfunction of RMRP-derived microRNAs that serve to target essential developmental genes [12]. Disruptions in the tight regulation of this single target locus could thus
set off a cascade of events with significant downstream
consequences, most of which are consistent with the predicted functions of ZSCAN5A and ZSCAN5B.
Because we could not knock down ZSCAN5D
specifically, the biological functions of this primate-specific paralog remain something of a mystery. However,
our data show that ZSCAN5D protein displays highest preference for tDNA-derived MIR SINE sites and a subset
of LINE2 elements that harbor a previously identified ETC motif [19]. L2 elements have carried the transposition-deficient MIR SINEs as “hitchhikers”, and remnants of
the two repeats can often be found closely juxtaposed [55]. The high enrichment of both ZSCAN5D and the human ETCs in MIR SINE and L2 repetitive elements (Table 2), suggests that a subset of ETC sites were distributed as MIR-associated L2 repeats during early mammalian evolution, and that ZSCAN5D has evolved as a preferred regulator of those ETCs distributed sites. Further studies
will be required to address these hypotheses definitively.
In closing, we note that despite the fact this TF gene family was elaborated relatively recently the genes have evolved to regulate one of the most ancient sets of essential functions, including tRNA transcription and the fundamental control of three-dimensional chromatin architecture. We surmise that ZSCAN5B evolved in early eutherian history to add a novel layer of regulation on a subset of Pol III-transcribed genes, modulating their transcription and their chromatin-organizing functions.
The new primate paralogs diverged in fingerprint structure
but retained a preference for a similar G-rich binding motif to co-bind with ZSCAN5B at many tDNA sites, likely dimerizing through their nearly identical SCAN domains. Through modulation of Pol III transcription and position effects on neighboring genes, our data suggest that human ZSCAN5A and ZSCAN5B collaborate to control of noncoding RNA processing, cell cycle progression and differentiation in many tissues. Although functional understanding of ZSCAN5D is complicated and still incomplete, the observation that this
primate-specific protein binds to MIR-repeat derived ETCs offers
a potentially valuable clue to the evolution of mammalian chromatin structure and deserves further investigation.
MATERIALS AND METHODS
Ethics statement
RNA preparation and quantitative RT-PCR
Total RNA was isolated from cell lines and tissues
using TRIzol (Invitrogen) followed by 30 min of
RNase-free DNaseI treatment (NEB) at 37oC and RNA Clean
& ConcentratorTM-5 (Zymo Research). 2 µg of total
RNA was used to generate cDNA using Superscript III Reverse Transcriptase (Invitrogen) with random hexamers (Invitrogen) according to manufacturer’s instructions.
Resulting cDNAs were analyzed of
transcript-specific expression through quantitative reverse-transcript
PCR (qRT-PCR) using Power SYBR Green PCR master mix (Applied Biosystems) with custom-designed primer sets (Supplementary Table 6) purchased from Integrated DNA Technology. Relative expression was determined by normalizing the expression of all genes of interest to either human or mouse Tyrosine 3-monooxygenase/tryptophan 5-monooxygenase activation protein, zeta polypeptide (YWHAZ) expression (∆Ct) as described [56].
In situ hybridization
Mouse embryos were collected, paraffin embedded,
sectioned and hybridized with an antisense RNA probe, essentially as previously described [57]. We generated In Situ hybridization (ISH) probes correspond to nucleotides of the mouse Zscan5b cDNA sequence (NM_133204), and to human ZSCAN5B (NM_001080456) (See
Supplementary Table 6 for probe sequences). Probes were cloned into the pGEM-T vector (Promega) and sequence-validated before being used for ISH. The reverse primer included a T7 promoter sequence to permit antisense RNA generation using the Roche DIG RNA Labeling kit (SP6/ T7) (Roche Applied Science) according to manufacturer’s
instructions. To prepare human tissue arrays, paraffin blocks containing formalin-fixed tissues from normal
anonymous adult donors were purchased from NoblePath Inc. Tissue microarray (TMA) blocks were generated using a Tissue Arrayer (Beecher Instruments). The
pre-cut paraffin tissue sections were checked by H&E staining
for tissue index selection. Forty-one 1.5mm diameter cores were included in the arrays, with 2 cores included to represent different regions of some tissues (x2). High quality 4-micron sections were generated using a Leica ST 2155 microtome. Slides were baked at 41°C overnight
and stored at -20°C until use. Slides were pretreated and
hybridizations were performed as described previously [58]. Sections were mounted using Vectashield Mounting Medium with DAPI. Fluorescent images were reviewed
using an Olympus BX60 microscope and captured by an
Olympus CC-12 digital camera.
Cell culture and cell cycle synchronization
HEK-293 (ATCC, CRL-1573), Neuro-2a (ATCC, CCL-131), and BeWo (ATCC, CCL-98) cell lines were
obtained from the American Type Culture Collection.
HEK-293 and Neuro-2a cells were maintained in Dulbecco’s Modified Eagle’s Medium (DMEM) containing 2 mM L-glutamine, 10% fetal bovine serum
(FBS), 1X Pen Strep, and BeWo cells in DMEM/F12K
containing 2 mM L-glutamine, 10% FBS, 1X NEAA, 1X
Pen Strep, incubated at 37°C in 5% CO2. For HEK-293
cell cycle synchronization, 2 mM thymidine was added
to HEK-293 cells grown to about 30% confluency and
the cells were subsequently incubated for 18h. Thymidine was removed by washing with 1X PBS three times, and
adding fresh media, followed by a further 9h-incubation.
The second round of 2 mM thymidine was then added and cells were incubated for an additional 15h. Cells were released from G1/S to S by washing with 1X PBS and adding fresh media, and were collected at different time points thereafter.
Plasmids and transfections
For siRNA knockdown, approximately 4.5x10⁵
HEK-293 cells were seeded to 6-well plates 24h before transfection. Cells were treated with 10 nM of siRNA specific to each ZSCAN5A (si4: SI00779436, si5: SI04221826, Qiagen) or ZSCAN5B (si1: SI00503300, Qiagen), or ZSCAN5D (si2: SI02804774, Qiagen) with
a scrambled negative control (Silencer negative control No.1 siRNA, Ambion) for 48h using Lipofectamine RNAi MAX transfection reagent (Invitrogen) according to manufacturer’s instructions.
To create a cell line that expresses an inducible short hairpin RNA (shRNA) targeting ZSCAN5A, an annealed double stranded oligonucleotide including to the si4 siRNA sequence was cloned into the pSuperior. Puro plasmid (Oligoengine). The resulting ZSCAN5A-Tet-shRNA plasmid was sequenced before subsequent
transfection. For plasmid DNA transfection, about 4.5x10⁵
HEK-293 cells were seeded to 6-well plates 24h before, and 3 µg of ZSCAN5A-Tet-shRNA or empty plasmid was transfected using Lipofectamine 2000 (Invitrogen). 24h later, transfected cells were selected under 1 µg/ml
of puromycin for additional 14 days. Single colonies were
selected and expanded, then tested for the efficiency of
ZSCAN5A by qRT-PCR knockdown 48h after addition of
1 µg/mL doxycycline (Dox; Sigma-Aldrich). Each colony was analyzed of its knockdown efficiency of transcripts
RNA-seq and computational analysis
48h after siRNA treatment, total RNA was prepared and tested for quality using an Agilent BioAnalyzer and Illumina libraries generated using the KAPA Stranded mRNA-Seq kit with mRNA Capture Beads (Kapa
Biosystems, KK8420). Sequencing was performed on an Illumina Hi-Seq 2000 instrument at the University of Illinois Roy J. Carver Biotechnology sequencing facility, to yield 60-65 million reads per sample. All sequencing
data described in this paper have been submitted to the Gene Expression Omnibus database (accession number
GSE85045).
RNA-seq data were analyzed using the
Tophat-Cufflinks Suite of tools [59]. For ZSCAN5A knockdown, expression results from si4 and si5 were analyzed as a group in comparison with the scrambled control. Genes
identified as differentially expressed with p < 0.05 (after
Benjamini-Hochberg correction for multiple testing) compared to the negative control-treated samples were considered for further analysis. For ZSCAN5B knockdown, which was effective only for a single siRNA design, we considered all genes with expression levels of at least 1 FPKM in at least one sample and considered genes with > 1.5 X fold change relative to scrambled control as DEGs. siRNA up-regulated and down-regulated genes were analyzed for function separately using the DAVID [35] functional clustering algorithm with default settings.
Protein preparation, western blots, and antibodies
Nuclear Extracts were prepared with NucBusterTM
Protein Extraction Kit (Novagen) and measured by Bradford-based assay (BioRad). The extracts were stored
at -80°C and thawed on ice with the addition of protease
inhibitor Cocktail (Roche) directly before use. 15 µg of nuclear extracts were run on 10% acrylamide gels and transferred to hydrophobic polyvinylidene difluoride (PVDF) membrane (GE-Amersham, 0.45 µm) using
BioRad Semi-dry system, then visualized by exposure to
MyECL Imager (Thermo Scientific).
Rabbit polyclonal antibodies were generated by injection of synthetic peptides corresponding to the tether regions of ZSCAN5A (DLVRAKEGKDPPKIAS) and mouse Zscan5b proteins (CPEPANPQPEKQVDSL);
peptide synthesis, antibody production, and affinity purification of antibodies against the purified peptide
epitope we carried out by Abgent Inc. ZSCAN5B
(sc-249845, Santa Cruz Biotechnology) and ZSCAN5D (ARP47809_P050, Aviva Systems Biology) antibodies
were obtained from commercial sources. Antibody
preparations were tested for protein specificity and efficiency by Western blot staining along with anti-TATA
binding protein control antibody (1TBP18, Abcam),
Immunocytochemistry and m-phase counting
Stably transfected cell lines were maintained in a regular medium described above with the addition of
0.5 µg/ml puromycin. For immunocytochemistry (ICC),
each cell was seeded and grown on gelatin-coated cover slips for 24h using the condition described above with
or without 1 µg/ml of Dox. After washing with 1X PBS, cells were fixed with -20°C methanol and incubated
at -20°Cfor 30 mins and wash three time with 1X PBS
again. Blocking was done by incubating the coverslips in antibody diluent (Dako) at 4°C for 2h. Primary antibodies
targeting ZSCAN5A (1:2000 dilution), ZSCAN5B (1:2000 dilution), and ZSCAN5D (1:2000 dilution), described above; anti-Gamma-tubulin (Abcam, 1:5000 dilution), and anti-Phospho-Histone H3 (Ser10) (EMD Millipore, 1:5000 dilution) were also used. Secondary antibodies
targeting primary antibodies were either conjugated with Alexa Fluor® 568 (1:5000 dilution) or Alexa Fluor® 488
(1:5000 dilution) and purchased from Thermo Scientific.
Mounting was done using ProLong® Gold Antifade
Mountant with DAPI (Thermo Scientific) and confocal
microscopy imaging was done using confocal microscope
Zeiss LSM880 in the Institute for Genomic Biology Core
Facility at the University of Illinois at Urbana-Champaign.
Ten samples, totaling more than 2000 cells, were processed
from each cell type and total and mitotic cells were
counted using Image J software [60]. To determine if the
difference in ratios of mitotic cells between two conditions
was significant we used the R function prop.test from the
R stats library, which uses Pearson’s chi-squared test to calculate a p-value. For each pair-wise test the count of mitotic cells and the count of the total cells was passed to prop.test for the two conditions being tested. The prop.test parameter “correct” (Yates’ continuity correction) was set to false. Values are summarized in Supplementary Table
1D. To calculate individual 95% confidence intervals for
the ratio of mitotic cells in each condition we used the R function binom.test from the R stats library using default
settings. These confidence intervals were used to display
error bars in Supplementary Table 1D.
Flow cytometry
In order to measure the effects of ZSCAN5 on G1/S/
G2 distribution, flow cytometry was done using above
described transgenic cell lines stained with propidium
iodide. Cells were grown as described above with 1 µg/
mL Dox for 48h. Each sample was trypsinized using
0.25% trypsine/EDTA (Gibco) and washed with 1X PBS with 0.2% FBS. Cell pellets were fixed with cold ethanol and stored at -20°C for 24h. Fixed cells were washed
twice with 1X PBS and stained with FxCycle™ PI/RNase