Received 23 April 1998/Returned for modification 12 June 1998/Accepted 1 October 1998
Three versions of a commercial human immunodeficiency virus (HIV) type 1 (HIV-1) load test (the
AMPLICOR HIV-1 MONITOR Test versions 1.0, 1.01, and 1.5; Roche Diagnostics, Branchburg, N.J.) were
evaluated for their ability to detect and quantify HIV-1 RNA of different genetic subtypes. Plasma samples from 96 patients infected with various subtypes of HIV-1 (55 patients infected with subtype A, 9 with subtype B, 21 with subtype C, 2 with subtype D, 7 with subtype E, and 2 with subtype G) and cultured virus from 29 HIV-1 reference strains (3 of subtype A, 6 of subtype B, 5 of subtype C, 3 of subtype D, 8 of subtype E, 3 of subtype
F, and 1 of subtype G) were tested. Detection of subtypes A and E was significantly improved with versions 1.01
and 1.5 compared to that with version 1.0, whereas detection of subtypes B, C, D, and G was equivalent with
the three versions. Versions 1.0, 1.01, and 1.5 detected 65, 98, and 100% of the subtype A-infected samples from
patients, respectively, and 71, 100, and 100% of the subtype E-infected samples from patients, respectively. Version 1.5 yielded a significant increase in viral load for samples infected with subtypes A and E (greater than
1 log10HIV RNA copies/ml). For samples infected with subtype B, C, and D and tested with version 1.5, only
a slight increase in viral load was observed (<0.5 log10). We also evaluated a prototype automated version of
the test that uses the same PCR primers as version 1.5. The results with the prototype automated test were highly correlated with those of the version 1.5 test for all subtypes, but were lower overall. The AMPLICOR HIV-1 MONITOR Test, version 1.5, yielded accurate measurement of the HIV load for all HIV-1 subtypes tested, which should allow the test to be used to assess disease prognosis and response to antiretroviral treatment in patients infected with a group M HIV-1 subtype.
Human immunodeficiency virus (HIV) type 1 (HIV-1) is characterized by extensive genetic variability. Phylogenetic analysis of many isolates collected from different geographic regions worldwide shows that HIV-1 can be divided into two groups. Group M (for major) represents the vast majority of characterized isolates, and it comprises at least 10 different phylogenetically related subtypes (subtypes A to J). Group O (for outlier) represents the most divergent strains, which are mainly found in Cameroon and Cameroonians (23, 24, 36, 37). Preliminary results indicate a heterogeneous distribution of genetic subtypes, with different prevalences in each country (6). Subtype B is predominant in Europe and North America, while all known subtypes are present in Central Africa, with a predominance of subtype A in west and central Africa and of subtype C in south and eastern Africa. Subtype C is also widely prevalent in India, which is the country with the largest number of HIV-infected people in the world, whereas subtype E is predominant in southeastern Asia.
Recent studies showed the introduction of subtype A, D, and E viruses and even group O viruses in the United States (8, 38). Similar data have been reported from several European countries such as Belgium (17), France (21, 43), England (3),
Sweden (2), and Germany (15), with subtype A being the pre-dominant non-B HIV-1 subtype in those countries. A study of blood donors in France showed a 16% increase in the preva-lence of individuals infected with non-subtype B viruses be-tween 1984 and 1995 (5). The impact of the different genetic subtypes on the pathogenesis, the course of HIV-1 infection, the transmissibility, and vaccine efficacy are not yet well known and must be further studied (16). However, several reports have shown that the performance of diagnostic assays can be influenced by genetic variability (18, 25, 26, 42).
To assess the progression of HIV-1 infection in patients, the CD4 cell count is the most commonly used marker. In recent years studies have shown that measurement of the viral load in plasma is also a valuable marker for monitoring the progres-sion of AIDS disease (19, 33, 34). To measure the response to antiretroviral therapy, a decrease in the HIV RNA level is a better predictor than an increase in the CD4 lymphocyte count (34, 40, 41). Therefore, several methods for the detection of virus in plasma have been developed (9, 39). HIV-1 p24 anti-gen detection in plasma by means of an antianti-gen binding en-zyme immunoassay is easy to perform but is not sensitive enough since it does no detect the p24 antigen in most asymp-tomatic patients (9). Quantitative culture of virus from plasma is very time-consuming and expensive, and its large-scale ap-plication is limited due to the short transport time needed to maintain the integrity of the samples. For these reasons, sev-eral quantitative nucleic acid amplification assays have been developed to quantify the HIV RNA load. The Quantiplex HIV RNA assay (Chiron)—based on branched DNA (44), the
* Corresponding author. Mailing address: ORSTOM Laboratoire Re´trovirus, 911 Ave. Agropolis, B.P. 5045, 34032 Montpellier Cedex 1, France. Phone: 33-4-6741-6297. Fax: 33-4-6761-9450. E-mail: triques @mpl.orstom.fr.
† Present address: Department of Infectious Diseases, University of Rochester Medical Center, Rochester, NY 14642.
110
on May 15, 2020 by guest
http://jcm.asm.org/
HIV-1 RNA QT (Organon Teknika) NASBA (nucleic acid sequence-based amplification) procedure (20), and the AMPLICOR HIV-1 MONITOR Test (Roche Diagnostics, Branchburg, N.J.)—is based on reverse transcription-PCR technology with coamplification of an internal RNA quantita-tion standard.
However, several studies have reported that some commer-cial viral load assays (NASBA and AMPLICOR version 1.0) were not able to detect and/or correctly quantify viral RNA in plasma from patients infected with non-subtype B HIV-1 strains (1, 4, 12, 25, 45). Due to the increase in international travel and the mixing of different populations, it is evident that the different subtypes will spread into Europe and the United States. Therefore, it is important that these commercial viral load assays be modified so that they can detect and accurately quantify all known HIV-1 variants. In the present study, we evaluated the performance of three versions of the AMPLI-COR HIV-1 MONITOR Test, which contain different PCR primer pairs for detection of the HIV-1gaggene, with plasma samples from patients infected with different genetic subtypes of HIV-1. In addition, we evaluated a prototype automated version of the test, in which amplification and detection take place on the COBAS AMPLICOR instrument.
MATERIALS AND METHODS
Origin and genetic subtypes of clinical samples.Ninety-six plasma samples obtained from 96 different HIV-1-infected patients were studied. Sixty of these patients live in France, where they receive medical care; the remaining 36 patients live in Cameroon and are followed in a hospital in that country. Fifty of the 60 patients living in France were receiving antiretroviral therapy, whereas none of the patients in Cameroon were receiving any antiretroviral drugs. Ge-netic subtypes were determined in the gp120 region of the envelope gene by the Heteroduplex Mobility Assay described by Delwart et al. (13). Some samples were also characterized by sequencing the C2-V3 region of the envelope fol-lowed by phylogenetic analysis as described previously (21). The distribution of the genetic subtypes among the samples was as follows: 55 subtype A, 9 subtype B, 21 subtype C, 2 subtype D, 7 subtype E, and 2 subtype G. For each patient 20 ml of blood was drawn into tubes containing EDTA as an anticoagulant, and the plasma samples were stored at280°C until use.
Quantified HIV-1 reference strains.A reference panel of 29 HIV-1 isolates of subtypes A through G was prepared as part of a study to prepare a set of quantified, well-characterized HIV-1 subtype standards and determine the quan-titative performance of the HIV-1 MONITOR Test with HIV-1 subtypes. Details on the preparation and characterization of the HIV-1 subtype reference panel will be described elsewhere (35). Briefly, each isolate was cultured in vitro by standard methods, and the culture supernatants were clarified and frozen. The virion concentration in the culture supernatants was determined by electron microscopic particle counting (22). Each virus stock was diluted to 20,000 virus particles per ml in defibrinated, normal human plasma. The 29 reference strains used in this study represented the following subtypes: subtype A (UG273, DJ258, and DJ263), subtype B (US1, US3, US4, CM237, BK132, and BZ167), subtype C (ZAM18, UG278, ETH2220, SE364, and SM145), subtype D (SE365, UG270, and UG274), subtype E (CM235, CM238, CM240, CM243, POC30506, RA12,
RA17, and NP1465), subtype F (BZ126, BZ162, and BZ163), and subtype G (HH8793).
Quantification of HIV-1 RNA. Four versions of the AMPLICOR HIV-1 MONITOR Test (Roche Diagnostics) were evaluated. The lower detection limit for all the versions is 200 RNA copies/ml, and the upper limit is 750,000 HIV RNA copies/ml. Version 1.0 is the currently available commercial test (product codes 83088 and 83102; Roche Diagnostics). Versions 1.01and 1.5 are modifi-cations to version 1.0 to improve the performance with non-B subtypes of HIV-1. The prototype automated test is a modification to version 1.5 in which amplifi-cation, detection, and calculation of results are automated on the COBAS AM-PLICOR instrument. The COBAS AMAM-PLICOR technique, which allows fully automated RNA and DNA amplification and detection, has been previously described in detail (14). The four versions differ in the internal quantitation standard RNA, the PCR primers, and the thermal cycling conditions that they use. The sample processing procedure is identical for all four versions. Versions 1.0 and 1.01use the version 1.0 quantitation standard RNA. Version 1.5 and the prototype automated test use a modified quantitation standard RNA that con-tains an additional 20 nucleotides of the HIV-1 sequence to include the primer binding site of the new downstream PCR primer. All four versions amplify the same region in thegaggene of HIV-1. Version 1.0 uses primers SK462 and SK431 and yields a 142-bp amplification product. Version 1.01is identical to version 1.0, except that the amplification reaction contains two additional prim-ers, SK145 and SK151, which are the same lengths as SK462 and SK431, respec-tively, and which bind to the same sites. The nucleotide sequences of SK145 and SK151 have been modified to be more homologous to the non-B subtypes of HIV-1. Version 1.5 uses primers SK145 and SKCC1B and yields a 155-bp amplification product. The downstream primer (SKCC1B) was shifted down-stream by 13 nucleotides to a region more highly conserved among the group M subtypes of HIV-1. The prototype automated test uses the same amplification reagents as version 1.5. Versions 1.0 and 1.01use the version 1.0 thermal cycling profile. The thermal cycling profiles for version 1.5 and the prototype automated test have been reoptimized with lower annealing temperatures to improve the performance with non-B subtypes of HIV-1. All four versions use the same oligonucleotide hybridization probes (SK102 and CP35) for capture of the HIV and quantitation standard amplification products, respectively. The detection procedure and reagents are identical for versions 1.0, 1.01, and 1.5. The proto-type automated test uses similar detection chemistries, except that oligonucleo-tide probe-coated magnetic microparticles instead of probe-coated microwell plates are used for capture of the amplification products.
The study protocol is illustrated in Fig. 1. Each sample was extracted in duplicate with the version 1.0 and version 1.5 quantitation standard RNA, ac-cording to the manufacturer’s instructions. The samples processed with the version 1.0 quantitation standard were used for version 1.0 and 1.01 amplifica-tion; the samples processed with the version 1.5 quantitation standard were used for version 1.5 and amplification on the COBAS instrument. Negative, low-positive, and high-positive controls were included in each run of 10 tests.
Statistical analysis.In order to compare to what extent the data obtained with the AMPLICOR version 1.5 test agree between the microwell plate version and the prototype automated test, the data were analyzed as described by Bland and Altman (7). The analysis was based on the differences between measurements for the same samples by plotting the differences against the average.
RESULTS
Sensitivity for detection of HIV-1 RNA from different
ge-netic subtypes. Overall, the version 1.0, 1.01, and 1.5 tests
[image:2.612.117.485.73.228.2]detected viral RNA in 73 (76%), 94 (98%), and 95 (99%) of the 96 patient samples, respectively (Table 1). The only sample FIG. 1. Outline of study protocol.
on May 15, 2020 by guest
http://jcm.asm.org/
in which HIV-1 RNA was not detected with version 1.5 was also negative by the two other tests. It was obtained from a patient who was infected with HIV-1 subtype B and who was receiving antiretroviral treatment. For this same patient we were also unable to isolate the virus from the corresponding peripheral blood mononuclear cells (PBMCs). The version 1.01and 1.5 tests detected significantly more subtype A- and E-infected samples compared to the numbers detected by ver-sion 1.0 (Table 1). Thirty-six (65%), 54 (98%), and 55 (100%) of the 55 subtype A-infected samples were detected with the version 1.0, 1.01, and 1.5 tests, respectively; and 5 (71.4%), 7 (100%), and 7 (100%) of the 7 subtype E-infected samples were detected by the three tests, respectively. The only subtype C-infected sample not detected with version 1.0 had very low HIV RNA levels with versions 1.01 and 1.5: 288 and 294 copies per ml, respectively.
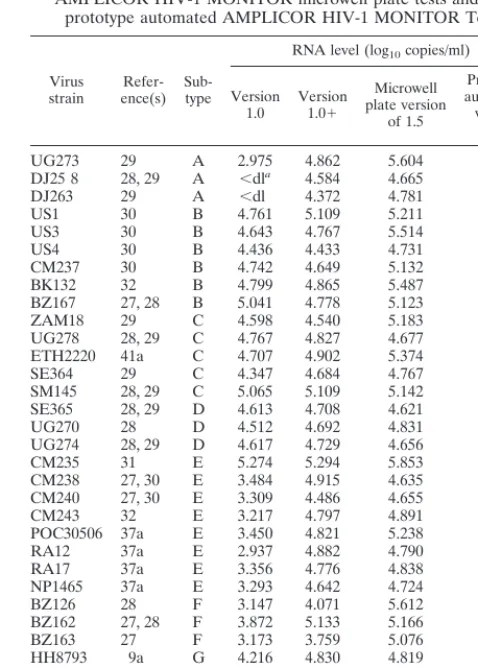
Table 2 presents the HIV-1 loads, expressed as log10HIV RNA copies per milliliter, obtained with the panel of quanti-fied reference strains of HIV-1. Each test sample contained 20,000 virus particles per ml. Two of the three subtype A strains were not detected with the version 1.0 test; all three subtype A strains were detected with versions 1.01and 1.5. All of the subtype B, C, D, E, F, and G strains were detected by versions 1.0, 1.01, and 1.5.
Efficiency of quantitation of HIV-1 RNA from different
ge-netic subtypes. To determine to what extent AMPLICOR
HIV-1 MONITOR Test versions 1.0, 1.01, and 1.5 were able to quantify HIV-1 RNA of various subtypes, we compared the viral loads obtained with the patient samples with each version (Fig. 2 and 3). Figure 2 presents the individual results obtained for all 96 samples; Fig. 3 presents the average results obtained with each test version by subtype. A significant increase in viral load of at least 1 order of magnitude was observed for the subtype A- and E-infected samples with the version 1.01and 1.5 tests. For the subtype B-, C-, and D-infected samples, versions 1.0 and 1.01 yielded equivalent results. The version 1.5 results for subtypes B, C, and D were highly correlated to those for versions 1.0 and 1.01, but the loads were slightly higher. The results obtained with versions 1.5 and 1.01were very highly correlated for all subtypes, but the loads obtained with version 1.5 were generally higher, by approximately 0.4 log10HIV RNA copies/ml. For some subtype A-infected sam-ples the loads obtained with version 1.5 were more than 1 log10 HIV RNA copies/ml higher than those obtained with version 1.0 (Fig. 2C).
As shown in Table 2, a similar trend was observed for the quantification of HIV-1 RNA from the reference strains. Each test sample contained 20,000 virus particles per ml. Therefore, the expected result was approximately 40,000 RNA copies per
patient samples: one sample each infected with subtypes A, B, C, and E. None of the four test methods detected HIV RNA in the subtype B-infected sample, which was from a patient receiving antiretroviral therapy (described above). The subtype A-, C-, and E-infected samples had low but detectable viral loads with version 1.5 of the test of 2,630, 294, and 499 HIV RNA copies/ml, respectively.
The prototype automated test and version 1.5 yielded results that were highly correlated for all subtypes, demonstrating that the correlation does not depend on subtype (Fig. 2D and 3). The correlation between the two tests was calculated by the method of Bland and Altman (7) by plotting differences
[image:3.612.53.294.101.225.2]Total 96 73 (76) 94 (98) 95 (99)
TABLE 2. HIV-1 RNA levels determined by the three AMPLICOR HIV-1 MONITOR microwell plate tests and the
prototype automated AMPLICOR HIV-1 MONITOR Test
Virus
strain ence(s)Refer- Sub-type
RNA level (log10copies/ml)
Version 1.0 Version1.01
Microwell plate version
of 1.5
Prototype automated version
of 1.5
UG273 29 A 2.975 4.862 5.604 5.149 DJ25 8 28, 29 A ,dla 4.584 4.665 4.678
DJ263 29 A ,dl 4.372 4.781 4.640 US1 30 B 4.761 5.109 5.211 4.894 US3 30 B 4.643 4.767 5.514 4.841 US4 30 B 4.436 4.433 4.731 4.581 CM237 30 B 4.742 4.649 5.132 4.600 BK132 32 B 4.799 4.865 5.487 5.068 BZ167 27, 28 B 5.041 4.778 5.123 5.143 ZAM18 29 C 4.598 4.540 5.183 4.728 UG278 28, 29 C 4.767 4.827 4.677 4.665 ETH2220 41a C 4.707 4.902 5.374 4.941 SE364 29 C 4.347 4.684 4.767 4.461 SM145 28, 29 C 5.065 5.109 5.142 5.017 SE365 28, 29 D 4.613 4.708 4.621 4.618 UG270 28 D 4.512 4.692 4.831 4.650 UG274 28, 29 D 4.617 4.729 4.656 5.111 CM235 31 E 5.274 5.294 5.853 5.274 CM238 27, 30 E 3.484 4.915 4.635 4.533 CM240 27, 30 E 3.309 4.486 4.655 4.609 CM243 32 E 3.217 4.797 4.891 4.723 POC30506 37a E 3.450 4.821 5.238 4.886 RA12 37a E 2.937 4.882 4.790 4.473 RA17 37a E 3.356 4.776 4.838 4.583 NP1465 37a E 3.293 4.642 4.724 3.930 BZ126 28 F 3.147 4.071 5.612 4.572 BZ162 27, 28 F 3.872 5.133 5.166 5.140 BZ163 27 F 3.173 3.759 5.076 4.996 HH8793 9a G 4.216 4.830 4.819 5.196
Mean 4.124 4.725 5.027 4.783
SD 0.75 0.31 0.35 0.29
a,dl, less than the detection limit.
on May 15, 2020 by guest
http://jcm.asm.org/
[image:3.612.310.549.386.721.2]against the average (Fig. 4). The correlation coefficient is 0.05 (95% confidence interval,20.18 to 0.28), and the highPvalue (P50.655) indicates that the differences observed between the two tests are not significant, independent from the average. However, the loads obtained with the prototype automated test were generally lower than those obtained with version 1.5 by approximately 0.3 log10HIV RNA copies/ml (from 0.24 to 0.38 log10HIV RNA copies/ml) (Fig. 2D and 3).
As observed for the plasma samples, a good correlation between the two techniques was observed, with slightly higher
viral loads for the reference strains also being detected by version 1.5 compared to the loads detected by the prototype automated test (Table 2).
Reproducibility.A total of 10 test runs have been done by
[image:4.612.59.546.71.564.2]one technician, and in each run, one high-positive and one low-positive control and one negative control were included. The reproducibilities of the different test versions were mea-sured by calculating the mean and standard deviation from the values obtained for each of the controls. In each run of the different tests all the positive controls were positive and all the FIG. 2. HIV loads in clinical samples with AMPLICOR HIV-1 MONITOR Test versions 1.0, 1.01, and 1.5 and the prototype automated test. The dotted lines indicate the upper limit of the linear range of the tests, at 750,000 HIV RNA copies/ml. (A) Version 1.01compared to version 1.0. (B) Version 1.5 compared to version 1.0. (C) Version 1.5 compared to version 1.01. (D) Prototype automated test compared to version 1.5. Data for the four samples in which HIV-1 RNA was not detected by the prototype automated test were excluded from the linear regression analysis in panel D. The different samples are represented as follows:E, subtype A (n555); F, subtype B (n59);Œ, subtype C (n521);, subtype D (n52);h, subtype E (n57); and‚, subtype G (n52).
on May 15, 2020 by guest
http://jcm.asm.org/
negative controls were negative. For the low-positive control the values observed were as follows: 3.59460.18, 3.55460.18, 3.930 60.16, and 3.7356 0.11 log10copies/ml with versions 1.0, 1.01, and 1.5 and the prototype automated test, respec-tively; and for the high-positive control the averages were 5.52060.12, 5.75260.15, 5.91760.12, and 5.76260.17 log10 copies/ml for versions 1.0, 1.01, and 1.5 and the prototype automated version, respectively.
DISCUSSION
Viral load in plasma is an essential marker for the prediction of disease progression and assessment of the potential of ther-apeutic drugs and vaccines (41), and the quantification of HIV RNA in plasma has become a main tool in predicting disease outcome and monitoring the efficacy of antiretroviral therapy in HIV-1-infected patients. However, the current AMPLICOR HIV-1 MONITOR Test is unable to quantitate accurately the RNA of some non-B subtypes of HIV-1.
In this study we evaluated three versions of the AMPLICOR HIV-1 MONITOR Test, version 1.0 (the current test), version 1.01(the current test with an additional pair of PCR primers), and version 1.5 (an upgraded test with new PCR primers), for their performance with group M subtypes of HIV-1. We also evaluated a prototype automated test, in which amplification and detection are automated on the COBAS AMPLICOR instrument.
Subtype A- and E-infected patient samples were poorly de-tected by the version 1.0 test (66% [41 of 62] were positive).
Alignment of these primers with HIV-1gagsequences in Gen-Bank shows that the upstream primer (SK462) contains three to six mismatches with subtype A sequences and that the down-stream primer (SK431) contains a mismatch two bases from the 39end in many subtype A, F, and G isolates (18). The presence of more than four mismatches at critical positions in a primer decreases the efficiency of the amplification (10). This decrease in efficiency can result in decreases in viral load mea-surements of more than 10-fold. The lower sensitivity for sub-type A- and E-infected samples and the lower viral load results for the detectable subtype A- and E-infected samples are most likely explained by the mismatches with the primers. All the subtype A-infected samples from Cameroon were from AIDS patients receiving no antiretroviral treatment, but the viral loads obtained by the version 1.0 test were lower than expected for such a population. However, the viral loads in these pa-tients observed by AMPLICOR HIV-1 MONITOR Test ver-sion 1.5 were similar to the viral loads expected in subtype B-infected patients at terminal stages of the disease.
[image:5.612.55.292.78.237.2]Plasma RNA levels obtained with version 1.01 with the subtype A- and E-infected samples were significantly greater than those obtained with version 1.0 but were slightly less than FIG. 3. Average log10HIV RNA copies per milliliter for subtypes A, B, C, D,
[image:5.612.347.547.488.677.2]E, and G from clinical specimens. For subtypes D, E, and G the results for individual samples are shown. For subtypes A, B, and C, the brackets represent the 95% confidence interval of the average. Only data for samples that were positive and below the upper limit of all four versions (750,000 HIV RNA copies/ml) were included in the figure. V, version.
FIG. 4. Comparison of AMPLICOR HIV-1 MONITOR Test version 1.5 (microwell plate) and the prototype automated version as described by Bland and Altman (7). Only data for samples that were positive and that had loads below the upper limit for all four versions (750,000 HIV RNA copies/ml) were included in the figure. The broken lines indicate the 95% confidence interval of the mean difference between the two tests for each sample.
on May 15, 2020 by guest
http://jcm.asm.org/
those obtained with version 1.5. Version 1.01 includes the downstream primer SK151. SK151 differs from SK431 by one nucleotide, which improves the homology to all HIV-1 isolates. However, the mismatch with subtype A samples near the 39 end is still present in SK151, which may explain the slightly lower results for subtype A- and E-infected samples obtained with version 1.01compared to those obtained with version 1.5. AMPLICOR HIV-1 MONITOR Test version 1.5 is able to detect and quantify HIV-1 RNA from all the HIV-1 group M genetic subtypes. However, the numbers of HIV-1 RNA copies per milliliter are slightly larger than those determined by the viral particle count assay, suggesting that the quantification of the viral load with this version could be slightly overestimated. In this study we also evaluated a prototype automated test on the COBAS AMPLICOR instrument. The prototype auto-mated test uses the same amplification reaction as version 1.5, except that the amplification takes place in the COBAS instru-ment. The results with version 1.5 and the prototype auto-mated test were highly correlated; however, the counts ob-tained with the automated test were generally 0.3 log10lower than those obtained with version 1.5, and the HIV-1 RNA in four samples with low viral loads with version 1.5 was not detected with the automated test. The lower counts obtained with the prototype automated test can be due to the difference in how the amplicons are captured (microwells versus mi-crobeads) or to the detection reagents used in the prototype automated test. Evaluation of the modified test is in progress at Roche Molecular Systems. However, the counts obtained by the prototype automated test are very close to the viral particle counts, and this result therefore makes us believe that the automated test on the COBAS instrument may become the future HIV-1 MONITOR test for the quantification of the viral load in plasma.
In conclusion, the new gag primers and other changes in version 1.5 significantly improved the detection and quantifi-cation of non-B subtypes of HIV-1 by the AMPLICOR HIV-1 MONITOR Test. This improvement was especially observed for subtype A, E, G, and also F strains, whereas previously, several studies reported difficulties in the detection and quan-tification HIV-1 RNA from subtype A-, E-, and G-infected samples (1, 12, 18, 25). All subtype E strains are recombinant viruses with agagregion from subtype A viruses; also, several subtype G viruses have been described as recombinants with a subtype A gag region (11, 32). This new version permits the accurate measurement of viral load for all group M subtypes tested and should therefore allow the accurate assessment of disease prognosis and response to antiretroviral treatment in patients infected with a group M subtype of HIV-1.
ACKNOWLEDGMENTS
We express our gratitude to Christian Laurent for help with the statistical analysis.
This work was partially supported by a grant from the ANRS (Agence National de Recherche sur le SIDA).
REFERENCES
1.Alaeus, A., K. Lidman, A. So¨nnerborg, and J. Albert.1997. Subtype specific problems with quantification of plasma HIV-1 RNA. AIDS11:859–865. 2.Alaeus, A., T. Leitner, K. Lidman, and J. Albert.1997. Most HIV-1 genetic
subtypes have entered Sweden. AIDS11:199–202.
3.Arnold, C., K. L. Barlow, J. V. Parry, and J. P. Clewley.1995. At least five HIV-1 sequence subtypes (A, B, C, D, A/E) occur in England. AIDS Res. Hum. Retroviruses11:427–429.
4.Arnold, C., K. L. Barlow, S. Kaye, C. Loveday, P. Balfe, and J. P. Clewley. 1995. HIV type 1 sequence subtype G transmission from mother to infant: failure of variant sequence species to amplify in the Roche AMPLICOR test. AIDS Res. Hum. Retroviruses8:999–1001.
5.Barin, F., A. M. Courouce, J. Pillonel, and L. Buzelay.1997. The retrovirus
study group of the French society of blood transfusion: increasing diversity of HIV-1M serotypes in French blood donors over a 10-year period (1985– 1995). AIDS11:1503–1508.
6.Birx, D. L.1996. Summary of track A: basic science. AIDS10(Suppl. 3):S85– S106.
7.Bland, J. M., and D. G. Altman.1995. Comparing methods of measurement: why plotting difference against standard method is misleading. Lancet346: 1085–1087.
8.Brodine, S. K., J. R. Mascola, P. J. Weiss, S. I. Ito, K. R. Porter, A. W. Artenstein, F. C. Garland, F. E. McCutchan, and D. S. Burke.1995. Detec-tion of diverse HIV-1 genetic subtypes in the United States. Lancet346: 1198–1199.
9.Bush, C. E., R. M. Donovan, O. Manzor, D. Baxa, E. Moore, F. Cohen, and L. D. Saravdatz.1996. Comparison of HIV type 1 RNA plasma viremia, p24 antigenemia and unintegrated DNA as viral load markers in pediatric pa-tients. AIDS Res. Hum. Retroviruses12:11–15.
9a.Carr, J. K., M. O. Salminer, J. Albert, E. Sanders-Buell, D. Gotte, D. L. Birx, and F. E. McCutchan.1998. Full genome sequences of human immunode-ficiency virus type 1 subtypes G and A/G intersubtype recombinant. Virology 247:22–31.
10.Christopherson, C. D., and S. Kwok.1996. The effects of mutations on HIV-1 quantitation by RT/PCR, abstr. MoA161.InAbstracts of the XI International Conference on AIDS.
11.Cornelissen, M., G. Kampinga, F. Zorgdrager, J. Goudsmit, and the UN-AIDS Network for HIV Isolation and Characterization.1996. Human im-munodeficiency virus type 1 subtypes defined byenvshow high frequency of recombinantgaggenes. J. Virol.70:8209–8212.
12.Coste, J., B. Montes, J. Reynes, M. Peeters, C. Segarra, J. P. Vendrell, E. Delaporte, and M. Segondy.1996. Comparative evaluation of three assays for the quantitation of human immunodeficiency virus type 1 RNA in plas-ma. J. Med. Virol.50:293–302.
13.Delwart, E. L., E. G. Shpaer, F. Louwagie, F. E. McCutchan, M. Grez, H. Rubsamen-Waigmann, and J. I. Mullins.1993. Genetic relationships deter-mined by a DNA heteroduplex mobility assay: analysis of HIV-1 env genes. Science262:1257–1261.
14.DiDomenico, N., H. Link, R. Knobel, T. Caratsch, W. Weschler, Z. G. Loewy, and M. Rosentraus.1996. COBAS AMPLICOR: fully automated RNA and DNA amplification and detection system for routine diagnostic PCR. Clin. Chem.42:1915–1923.
15. Dietrich, U., H. Ruppach, S. Gehring, H. Knechten, M. Knickmann, H. Jager, E. Wolf, R. Husak, C. E. Orfanos, H. D. Brede, H. Rubsamen-Waig-man, and H. von Briesen.1997. Large proportion of non-B HIV-1 subtypes and presence of zidovudine resistance mutations among German serocon-vertors. AIDS11:1532–1533.
16. Expert Group of the Joint United Nations Programme on HIV/AIDS.1997. Implications of HIV variability for transmission: scientific and politic issues. AIDS11:UNAIDS1–UNAIDS15.
17. Fransen, K., A. Buve´, J. N. Nkengasong, M. Laga, and G. van der Groen. 1996. Longstanding presence in Belgians of multiple non-B HIV-1 subtypes. Lancet347:1403. (Letter.)
18. Gobbers, E., K. Fransen, T. Oosterlaken, W. Janssens, L. Heyndrickx, T. Ivens, K. Vereecken, P. van de Wiel, and G. van der Groen.1997. Reactivity and amplification system with regard to different HIV-1 subtypes. J. Virol. Methods66:293–301.
19. Harrigan R.1995. Measuring viral load in the clinical setting. J. Acquired Immune Defic. Syndr. Hum. Retrovirol.10(Suppl):S34–S40.
20. Kievits, T., P. Rothbart, W. Quint, H. Huisman, J. Goudsmit, and P. Lens. 1991. NASBA isothermal enzymatic in vitro nucleic acid amplification opti-mized for the diagnosis of HIV-1 infection. J. Virol. Methods35:273–286. 21. Lasky, M., J. L. Perret, M. Peeters, F. Bibollet-Ruche, F. Liegeois, D. Patrel,
S. Molinier, C. Gras, and E. Delaporte.1997. Presence of non-B subtypes and divergent subtype B strains of HIV-1 in individuals infected after over-seas deployment. AIDS11:43–51.
22. Layne, S. P., M. J. Merges, M. Dembo, et al.1992. Factors underlying spontaneous inactivation and susceptibility to neutralization of human im-munodeficiency virus. Virology189:695–714.
23. Leitner, T.1996. Genetic subtypes of HIV-1.InHuman retroviruses and AIDS. Los Alamos National Laboratory, Los Alamos, N.M.
24. Loussert-Ajaka, I., D. Descamps, F. Simon, F. Brun-Vezinet, M. Ekwalanga, and S. Saragosti.1995. Genetic diversity and HIV detection by polymerase chain reaction. Lancet346:912–913.
25. Loussert-Ajaka, I., M. L. Chaix, B. Korber, F. Letourneur, E. Gomas, E. Allen, T. D. Ly, F. Brun-Vezinet, F. Simon, and S. Saragosti.1995. Variabil-ity of human immunodeficiency virus type-1 group O strains isolated from Cameroonian patients living in France. J. Virol.69:5640–5649.
26. Loussert-Ajaka, I., T. D. Ly, ML. Chaix, D. Ingrand, S. Saragosti, A. M. Courouce, F. Brun-Vezinet, and F. Simon.1994. HIV-1/HIV-2 seronegativity in HIV-1 subtype O infected patients. Lancet343:1393–1394.
27. Louwagie, J. J., E. L. Delwart, J. I. Mullins, F. E. McCutchan, G. Eddy, and D. S. Burke.1994. Genetic analysis of HIV-1 isolates from Brazil reveals presence of two distinct genetic subtypes. AIDS Res. Hum. Retroviruses10: 561–567.
on May 15, 2020 by guest
http://jcm.asm.org/
Gupta.1995. Quantitation of HIV-1 RNA in plasma predicts outcome after seroconversion. Ann. Intern. Med.122:573–579.
34.Mellors, J. W., C. R. Rinaldo, P. Gupta, R. M. White, J. A. Todd, and L. A. Kingsley.1996. Prognosis in HIV-1 infection predicted by the quantity of virus in plasma. Science272:1167–1170.
35. Michael, N. (Walter Reed Army Institute of Research, Rockville, Md.). Personal communication.
36. Myers, G., B. Korber, B. Hahn, K. T. Jeang, J. W. Mellors, F. E. McCutchan, L. E. Henderson, and G. N. Pavlakis.1995. A compilation of analysis of nucleic acid and amino acid sequences.InHuman retrovirus and AIDS. Los Alamos National Laboratory, Los Alamos, N.M.
37. Peeters, M., A. Gueye, S. Mboup, F. Bibollet-Ruche, E. Ekaza, C. Mulanga, R. Ouedrago, R. Gandji, P. Mpele, G. Dibanga, B. Koumare, M. Saidou, E. Esu-Williams, J. P. Lombart, W. Badombena, N. Luo, M. van den Hae-sevelde, and E. Delaporte.1997. Geographical distribution of HIV-1 group O viruses in Africa. AIDS11:493–498.
37a.Porter, K. R., J. R. Mascola, H. Hupudio, D. Ewing, T. C. VanColt, R. L. Anthony, A. L. Gorwin, S. Widodo, S. Erto´no, F. E. McCutchan, D. S. Burke, C. G. Hayes, F. S. Wignall, and R. R. Graham.1997. Genetic, antigenic and serologic characterization of human immunodeficiency virus type 1 from
1996. HIV viral load markers in clinical practice. Nat. Med.2:625–629. 41a.Salminen, M. O., B. Johansson, A. Sonnerborg, S. Ayehunie, D. Gotte, P.
Leinikki, D. S. Burke, and F. E. McCutchan.1996. Full-length sequence of an Ethiopian human immunodeficiency virus type 1 (HIV-1) isolate of ge-netic subtype C. AIDS Res. Hum. Retroviruses12:1329–1339.
42.Schable, C., L. Zekeng, C. P. Pau, D. Hu, L. Kaptue, L. Gurtler, T. Dondero, J. M. Tsague, G. Schochetman, H. Jaffe, and J. R. George.1994. Sensitivity of United States HIV antibody tests for detection of HIV-1 group O infec-tions. Lancet344:1333–1334.
43.Simon, F., I. Loussert-Ajaka, F. Damond, S. Saragosti, F. Barin, and F. Brun-Venizet.1996. HIV type 1 diversity in northern Paris. AIDS Res. Hum. Retroviruses12:1427–1433.
44.Urdea, M. S.1993. Direct and quantitative detection of HIV-1 RNA in human plasma with a branched DNA signal amplification assay. AIDS7 (Suppl. 2):S11–S14.
45.Vandamme, A. M., J. C. Schmit, S. Van Dooren, K. Van Laethem, E. Gob-bers, W. Kok, P. Goubau, M. Witvrouw, W. Peetersmans, E. De Clercq, and J. Desmyter.1996. Quantification of HIV-1 RNA in plasma: comparable results with the NASBA HIV-1 RNA QT and AMPLICOR HIV Monitor test. J. Acquired Immune Defic. Syndr. Hum. Retrovirol.13:127–139.