www.hydrol-earth-syst-sci.net/19/1547/2015/ doi:10.5194/hess-19-1547-2015
© Author(s) 2015. CC Attribution 3.0 License.
Evaluation of high-resolution precipitation
analyses using a dense station network
A. Kann1, I. Meirold-Mautner1, F. Schmid1, G. Kirchengast2,3, J. Fuchsberger2, V. Meyer1, L. Tüchler1, and B. Bica1 1Department of Forecasting Models, Central Institute for Meteorology and Geodynamics (ZAMG), Vienna, Austria
2Wegener Center for Climate and Global Change (WEGC), University of Graz, Graz, Austria
3Institute for Geophysics, Astrophysics, and Meteorology/Institute of Physics, University of Graz, Graz, Austria Correspondence to: A. Kann ([email protected])
Received: 16 September 2014 – Published in Hydrol. Earth Syst. Sci. Discuss.: 21 October 2014 Revised: 17 February 2015 – Accepted: 11 March 2015 – Published: 26 March 2015
Abstract. The ability of radar–rain gauge merging algo-rithms to precisely analyse convective precipitation pat-terns is of high interest for many applications, e.g. hydro-logical modelling, thunderstorm warnings, and, as a ref-erence, to spatially validate numerical weather prediction models. However, due to drawbacks of methods like cross-validation and due to the limited availability of reference data sets on high temporal and spatial scales, an adequate validation is usually hardly possible, especially on an oper-ational basis. The present study evaluates the skill of very high-resolution and frequently updated precipitation analy-ses (rapid-INCA) by means of a very dense weather station network (WegenerNet), operated in a limited domain of the southeastern parts of Austria (Styria). Based on case stud-ies and a longer-term validation over the convective season 2011, a general underestimation of the rapid-INCA precip-itation amounts is shown by both continuous and categori-cal verification measures, although the temporal and spatial variability of the errors is – by convective nature – high. The contribution of the rain gauge measurements to the analy-sis skill is crucial. However, the capability of the analyses to precisely assess the convective precipitation distribution pre-dominantly depends on the representativeness of the stations under the prevalent convective condition.
1 Introduction
Reliable precipitation analyses and forecasts with both high temporal update frequency and high spatial resolution are essential for many applications. For example, hydrological models usually require gridded precipitation fields on small
scales and short lead times which form the major component of flood warning systems (Komma et al., 2007). In climate re-search, precipitation re-analyses performed over decades are employed to estimate return periods or other extreme value statistics and often are of high social and economic relevance. Gridded precipitation analyses are also gaining importance in the field of spatial verification of numerical weather predic-tion (NWP) models, especially since convecpredic-tion-resolving models allow for simulating small-scale convective storms.
al-gorithms (Gregow et al., 2013). A few merging alal-gorithms are of multi-source nature, including radar and rain gauge data and additional components like NWP data to improve the analysis skill (e.g. NIMROD system by Golding, 1998; INCA system by Haiden et al., 2011).
The Integrated Nowcasting through Comprehensive Anal-ysis (INCA) system has been developed at the Central In-stitute for Meteorology and Geodynamics in Vienna, Aus-tria (ZAMG) and has been in operational use since spring 2004. Besides precipitation (the most traditional nowcast-ing parameter) many different parameters are computed by INCA (e.g. precipitation type, temperature, humidity, wind etc.). The techniques for computing analyses and nowcasts vary from parameter to parameter, as well as temporal reso-lution and update frequency.
A common way of validating the skill of precipitation analyses is the method of leave-one-out cross-validation. However, this method has drawbacks: it is computationally expensive, it assumes a random distribution of the stations with respect to climatology and topography, the results de-pend on the local conditions of the stations, and – due to the often inhomogeneous and sparse station networks – small-scale features are usually not captured.
Due to its limited representativeness, traditional point-wise verification against station measurements is not ade-quate and is amended by spatial verification methods like the Structure-Amplitude-Location (SAL) method (Wernli et al., 2008). These novel verification methods require gridded pre-cipitation analyses, preferably model-independent, of high quality as a reference. Wittmann et al. (2010) have used high-resolution precipitation analyses to validate the skill of dif-ferent limited area models (LAM) during a convective sea-son. Similarly, Sattler and Feddersen (2005) have applied daily precipitation analyses to evaluate the quality of a lim-ited area and a global ensemble system during heavy precip-itation events.
In this work, the INCA precipitation analyses are validated against the independent data set of the WegenerNet climate station network (operated by the Wegener Centre for Climate and Global Change, University of Graz, Austria; Kirchengast et al., 2014). Rather than the development of new tion measures, this paper applies well-established verifica-tion standards (e.g. cross-validaverifica-tion and feature-based met-rics) based on this dense station network. The WegenerNet data set has already been successfully applied to validate temperature, humidity, and wind speed analyses in an opera-tional context (Kann et al., 2011). Furthermore, the dense sta-tion network allows for a thorough evaluasta-tion of INCA pre-cipitation for small-scale, convective prepre-cipitation patterns.
Section 2 introduces the rapid-INCA analysis module and the station network WegenerNet. Section 3 briefly illustrates the synoptic conditions of selected cases with heavy precip-itation in August and September 2011, and their skill scores of verification. Section 4 describes the results of a long-term
validation during the whole convective period from April to September 2011, followed by a conclusion.
2 Data and methods
2.1 The rapid-INCA precipitation analysis
The rapid-INCA system is an extension of INCA, specifi-cally developed for precipitation nowcasting with a 5-minute accumulation period and update frequency (in contrast to 15 min in the original INCA version). Radar data from the Austrian weather radar network as well as measure-ments from the Austrian automatic weather stations net-work (Teilautomatische Wetterstationen, TAWES) are avail-able every 5 min and therefore allow for rapid-INCA up-dates at this frequency. In situations with rapidly changing weather conditions, such as fast-developing thunderstorms, rapid-INCA is a helpful tool (both in analysis and nowcast-ing mode) as it provides new assessments of the spatial pre-cipitation distribution every 5 min. However, the focus of the present study is on the rapid-INCA analysis procedure, not on nowcasting.
The rapid-INCA precipitation algorithm merges rain gauge measurements from approximately 270 TAWES sta-tions with radar-derived precipitation estimates. The synthe-sis is designed to combine the strengths of both data sources, i.e. the quantitative accuracy of the station measurements and the detailed spatial information of the radar image. However, the algorithmic synthesis has also to cope with the weak-nesses and error sources of both measurement methods and – as far as possible – to compensate for them. These weak-nesses are predominantly the potentially low representative-ness of site-specific measurements and the general quantita-tive uncertainty of precipitation estimates from radar reflec-tivity.
The precipitation analysis consists of the following steps (see Haiden et al., 2011 for a detailed description).
Figure 1. Rapid-INCA topography in the WegenerNet region. Blue circles represent WegenerNet stations, red crosses are the TAWES stations (Teilautomatische Wetterstationen) Feldbach (north) and Bad Gleichenberg (south) of ZAMG.
to non-meteorological echoes. The MaxCAPPI data are provided on a Cartesian grid with a horizontal resolution of 1 km and reduced to 14 reflectivity classes (“no rain”, 11.8, 14.0, 19.5, 22.0, 26.7, 30.0, 34.2, 38.0, 41.8, 46.0, 50.2, 54.3, 58.0 [dBZ]). Reflectivities are operationally converted to rainfall intensities by using the Marshall–Palmer relation Z=200R1.6 (Marshall and Palmer, 1948).
2. Further details about the radar stations and speci-fications can be found in Kaltenboeck (2012) and Kaltenboeck and Steinheimer (2015). At ZAMG, for lack of radial data, a pattern recognition filter is applied on the MaxCAPPI data to correct R-LAN signals. As the data are only corrected for ground clutter and R-LAN, beside residual clutter, all other error sources have to be considered when radar QPE is used. These errors are reflected in the MaxCAPPI data. As in the Max-CAPPI calculation always the maximum value of a ver-tical column is used – in particular, bright band effects in stratiform rain and the hail core in thunderstorms lead to overestimated rainfall intensities. Other impor-tant aspects are partial and total beam shielding and beam broadening with increasing distance to the radar station. In the target region the minimum height which is seen by the radar network is around 2000 m above ground (Fig. 2b). Rainfall close to the ground, which is measured by ground stations, is not captured in the radar signals, so that potential rainfall intensification or evap-oration processes and size sorting due to wind shear on the way to the ground are missed. Furthermore, with the
closest radar stations at distances of approx. 100 km (the mountain site Zirbitzkogel) and approx. 135 km (low-land site Rauchenwarth) the 1◦beam widths become as
broad as 1.7 and 2.35 km, respectively. The large radar bin volumes, together with the high variability of pre-cipitation in space and time, potentially lead to inho-mogeneous beam-filling problems and unrepresentative precipitation values. Finally, the fixedZ–Rrelationship, which does not take into account the variety of differ-ent drop-size distributions, and the restricted data res-olution of 14 intensity classes are further considerable limitations for radar-predicted rainfall intensities. Still, the MaxCAPPI product is the best available data source for INCA. With all the restrictions of radar-based QPE, radar data have the advantage to capture the precipita-tion structure in general, so that this informaprecipita-tion may be added to the local point measurements. INCA reads the MaxCAPPI data provided by each radar and generates a composite by selecting the highest value at each grid point. The MaxCAPPI composite is bi-linearly interpo-lated onto the INCA grid. A pre-scaling of the radar data is conducted before a high-quality analysis can be cal-culated as precipitation estimates of the radar may un-derlie important systematic errors. The local scaling fac-tor results from the ratio of monthly precipitation sums of station interpolation to monthly precipitation sums of radar-derived QPE. To avoid unrealistically high scaling factors a maximum value of 2 is set. In addition to the fixed scaling, a latest-data scaling procedure is applied using recent radar and observation data.
3. Interpolation of rain gauge data: the 1 min measure-ments are aggregated to 5 min sums and interpolated by inverse-distance weighting (IDW) onto the 1 km INCA grid by using the eight nearest stations. Note that only those measurements are used which fulfil several qual-ity control criteria including time series control, com-parison with radar data and with neighbouring stations. Figure 2 shows the operational rapid-INCA domain and the distribution of automatic stations as well as the po-sition of the five radar locations.
(a)
(b)
Figure 2. (a) Operational rapid-INCA domain, orography and rain gauge stations (TAWES) measuring precipitation in 5 min in-tervals (white/blue dots). Additionally, the locations of the five radars are marked (red triangles) as well as the WegenerNet re-gion (red square). (b) Relative height of the lowest available radar beam above orography, in combination with the location of the WegenerNet (red box) and the locations of the radars Rauchenwarth (RAU) and Zirbitzkogel (ZIR) (red diamonds).
in the case of 13 September 2014, 02:40 UTC. In ar-eas with low radar quality, the combination algorithm assigns large weights to the station interpolation. The radar-derived QPE contributes with small-scale convec-tive cells which were not captured by TAWES stations of ZAMG.
2.2 The WegenerNet
This brief description of the station network WegenerNet, op-erated by the Wegener Center for Climate and Global Change of the University of Graz, Austria, is based on Kirchengast et al. (2014) and Kabas (2012), wherein detailed further infor-mation can be found. The WegenerNet comprises 151 me-teorological stations within an area of about 20 km×15 km in southeastern Styria, Austria (centred near the city of Feld-bach, 46.93◦N, 15.90◦E), a region with high weather vari-ability (Kabas et al., 2011a, b). The stations are arranged on a quasi-regular 1.4 km×1.4 km grid (Fig. 1) and mea-sure the parameters air temperature, relative humidity, and precipitation amount. Selected stations additionally provide measurements of wind and soil parameters. Furthermore,
air pressure and net radiation are observed at one reference station. The collected data are processed by the automatic WegenerNet Processing System (WPS). The raw data are stored by Internet loggers (GeoPrecision GmbH, Germany; www.geoprecision.com) and transferred via GPRS to the database at the Wegener Center, Graz. The GPRS transmis-sion is performed hourly, with subsets of about 30 stations transferring in stacked 5 min batches during the first half of the hour.
The incoming data files are stored in a database and are checked by the Quality Control System (QCS). The QCS is run hourly and it checks for each of the 151 stations the availability and correctness as well as the technical and phys-ical plausibility of the measured data in eight quality-control (QC) layers (Table 1).
QC layers 0 and 1 check for data availability, QC layers 2, 5, and 7 are fairly common types of checks, on bounds and deviations, whereas the inter-station check of QC layer 6, which is made to detect implausible “jumps” of parame-ter values between stations, is unique to this type of dense station grid. For precipitation data, layers 2, 4, 5, and 6 are key: layer 2 checks for rain rates exceeding sensor specifica-tions, in layer 4 rain rates higher than climatological bounds are detected, and layer 5 looks for inconsistencies between rain gauges at a single station. Layer 6 is able to detect par-tially or totally blocked funnels, flushes due to sudden open-ing of blocked funnels, and in general unusual deviations from the values at neighbouring stations. If all QC layers are passed without any detection, the data receive a QC flag of 0, indicating the highest quality. In the present study, only such flag 0 data were used. Further details about the QCS and all implemented checks can be found in Kirchengast et al. (2014) and Scheidl (2014).
In the Data Product Generator, gridded data of the main parameters are derived on a regular 200 m×200 m Univer-sal Transverse Mercator (UTM) grid from individual station measurements by IDW. Subsequently, station data and grid-ded data (at 5 min resolution) are also averaged (summed up for precipitation) to various weather and climate data prod-ucts (from half-hourly up to annual).
For application purposes the resulting data and further in-formation on the station network are available for users at the WegenerNet data portal (www.wegenernet.org) in near-real time (data latency less than 30 to 90 min). The WegenerNet provides highly resolved individual station data and regular grids since 1 January 2007 as a new data source for research projects investigating local-scale weather and climate and en-vironmental change. Moreover, the data records serve as in-formation source for various applications in the study region (Kirchengast et al., 2014; Kabas et al., 2011b).
2.3 Method
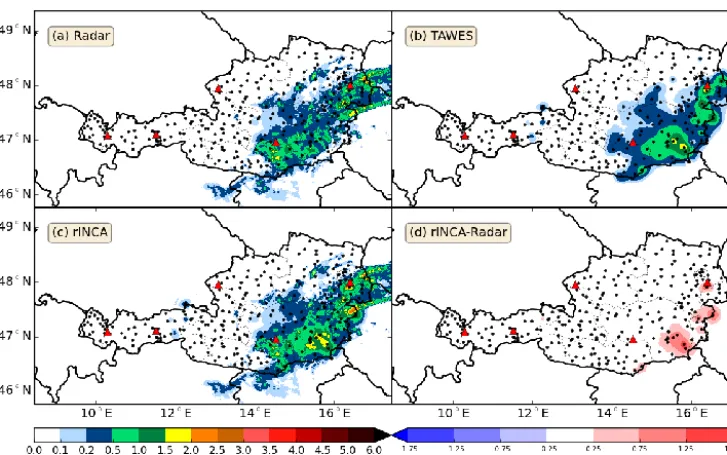
[image:4.612.50.285.66.330.2]Figure 3. Example of a 5 min precipitation analysis (rapid-INCA) based on the combination of rain gauge data and radar derived QPE on 13 September 2014, 02:40 UTC. (a) Scaled radar field, (b) interpolated rain gauge measurements (TAWES), (c) final rapid-INCA precipita-tion analysis and (d) difference between rapid-INCA and radar derived QPE.
Table 1. Overview of the WegenerNet data quality-control (QC) layers.
QC layer Description
0: check regarding station operation Check if station is currently in operations 1: check of data availability Check if expected sensor data values are available
2: check of sensor functioning Check if measurement value exceeds permitted range of technical sensor specifications 3: check of climatological plausibility Check if measurement value exceeds plausibly set maximum climatological bounds 4: check of temporal variability Check if measurement value shows too high or too little variation (“jumps”, “constancy”) 5: check of intra-station consistency Check if measurement value is not properly consistent with related parameters
6: check of inter-station consistency Check if measurement value deviates too much from values at neighbour stations 7: check against external reference Check (for pressure) if measurement value deviates too much from ZAMG reference
of the standard comparison techniques are carried out at these station locations. The INCA-related fields, rapid-INCA analyses, radar-derived QPE and rain gauge measurements (TAWES) are interpolated bi-linearly from the 1 km×1 km INCA grid to the WegenerNet station locations. This interpo-lation method has been chosen because the WegenerNet grid is nearly regular with a spatial resolution comparable to the rapid-INCA grid resolution.
Besides bias, mean absolute error (MAE) and root mean squared error (RMSE), the skill scores Equitable Thread Score (ETS), True Skill Score (TSS) and Frequency Bias In-dex (FBI), which are commonly used for validating precip-itation, have been computed for a threshold of 0.5 mm per 5 min (Table 2).
For spatial comparisons, IDW interpolation has been ap-plied to obtain WegenerNet measurements on the INCA grid. A quadratic distance weighting function has been chosen by taking into account the five nearest neighbours as the station
density of WegenerNet in the target region is relatively high and the respective observations should not be smoothed too much. The resulting field has been processed to obtain the spatial verification indicators structure, amplitude and loca-tion (SAL; Wernli et al., 2008), but also to demonstrate the spatial patterns of standard verification measures.
3 Heavy precipitation case studies
For the selection of cases with heavy precipitation during the convective season of 2011 the definition of Wussow (1922) for integration times smaller than 30 min has been followed:
hn≥
s
5t−
t
24
2
, (1)
[image:5.612.55.543.369.482.2]Table 2. Skill scores used for validation (Wilks, 2006). See also WMO Joint Working Group on Forecast Verification Research, e.g.: http: //www.cawcr.gov.au/projects/verification/.
ETS (equitable threat score)
True skill score (TSS)
Frequency bias index (FBI)
Range −1/3 to 1, 0: no skill −1 to 1, 0: no skill 0 to∞
Perfect score 1 1 1
Answers the question:
How well did the forecast “yes” events
correspond to the observed “yes” events?
How well did the forecast separate the “yes” events from the “no” events?
How did the forecast frequency of “yes” events compare to the observed frequency of “yes” events?
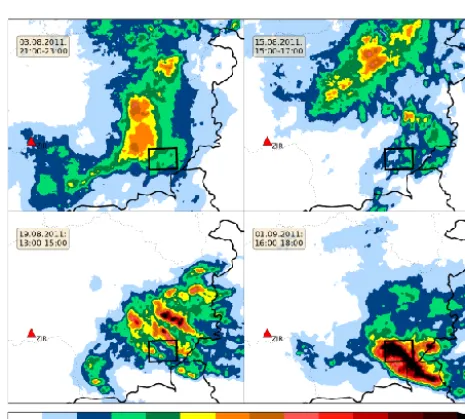
Figure 4. 2 h precipitation accumulations of the 5 min rapid-INCA analyses on 4 days (top left: 3 August 2011, top right: 15 Au-gust 2011, bottom left: 19 AuAu-gust 2011, bottom right: 1 Septem-ber 2011) in the respective time spans. The WegenerNet region is marked by a small black rectangle, the red triangle represents the radar (Zirbitzkogel) within this zoom.
is characterized by precipitation amounts exceeding 5 mm in 5 min, 7 mm in 10 min or 12 mm in 30 min.
3.1 Synoptic situations
Four cases with heavy precipitation over the WegenerNet re-gion were selected. Figure 4 shows 2 h sums of the 5 min rapid-INCA analyses of these selected cases. The synoptic situation for each of the cases is illustrated in Fig. 5.
[image:6.612.51.284.255.465.2]3 August 2011, 21:00–23:00 UTC: a trough northwest of Ireland and high pressure centred over the Baltics bring a warm upper-level flow from the southwest into Austria. At 18:00 UTC an eastwards-propagating ridge in relative
Figure 5. Satellite image, surface pressure analysis and frontal zones on the 4 selected days. Top left: 3 August 2011, 18:00 UTC; top right: 15 August 2011, 12:00 UTC; bottom left: 19 August 2011, 18:00 UTC; bottom right: 1 September 2011, 18:00 UTC.
topography (represented by the orange line in Fig. 5, top left) indicates high values of temperature and humidity in the southeastern part of Austria. CAPE values in the WegenerNet area amount to more than 2000 J kg−1 and the lifted index (LI) is around−6 K, thus indicating a potential for convec-tive developments. A convergence line gradually approaches from the west and leads to the formation of thunderstorms in the western Alpine regions of Austria but also in the south-eastern parts of the country.
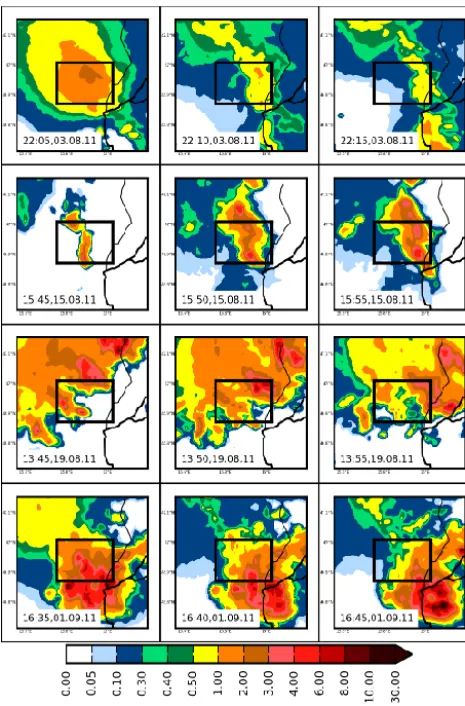
[image:6.612.311.545.256.429.2]west-Figure 6. Spatio-temporal distribution of rapid-INCA precipitation (mm/5 min) in the region of the WegenerNet indicated by the black rectangle (time is given in UTC).
ern Hungary) and below 16◦only a few kilometres west of the WegenerNet. A few hours ahead of the event, Deep Layer Shear (DLS) values range to approximately 12 m s−1 accord-ing to the 03:00 UTC soundaccord-ing at the 40 km distant station “Graz Thalerhof” (WMO ID 11240). CAPE (2000 J kg−1) and LI (−4 K) values at 15:00 UTC are highest within the Alpine region.
19 August 2011, 13:00–15:00 UTC: a cold front associated with a low over the southern Baltic Sea approaches the north-ern Alpine rim from the northwest (Fig. 5, bottom left), with its forward motion being gradually decreased. Nevertheless, cold air is advected in higher levels, whereas a northerly low level jet with a maximum in 925 hPa brings warm moist air into the target area. Thunderstorms were widespread on that day. In the vicinity of the WegenerNet, DLS values were around 10 m s−1and CAPE close to 1400 J kg−1 in the af-ternoon.
1 September 2011, 16:00–18:00 UTC: a very shallow sur-face pressure distribution with weak frontal signals
domi-Figure 7. Temporal evolution of precipitation rates for WegenerNet (WegNet), rapid-INCA, radar derived QPE (Radar), and TAWES station and four selected cases.
nates over most parts of Central and Eastern Europe. The air mass over the WegenerNet was generally moist and unstable with an increased potential for convective developments (LI around−4 K, DLS=12 m s−1). The thunderstorm initiation might be attributed to a recent crossing of a weak warm front in the northerly direction: in the warm sector the advection of warm air aloft is gradually cut off while the forcing at the ground is given through radiative heating.
3.2 5-minute rapid-INCA analyses for the selected cases
Figure 6 shows the spatio-temporal distribution of 5-minute rapid-INCA precipitation analyses in the region of the WegenerNet which is indicated by the black rectangle. On 3 August 2011, the maximum precipitation amounts are be-tween 2 and 3 mm per 5 min at 22:05 UTC, and then decrease with time. The precipitation cells on 15 August 2011 are gradually expanded and intensified with time to 6 mm per 5 min. On 19 August 2011, a heavy precipitation cell moves slowly across the northern part of the WegenerNet area, and on 1 September 2011, extremely high precipitation amounts are reached (>10 mm/5 min) before the precipitation cells leave the WegenerNet domain to the southeast.
3.3 Time series and verification of rapid-INCA analyses for the selected cases
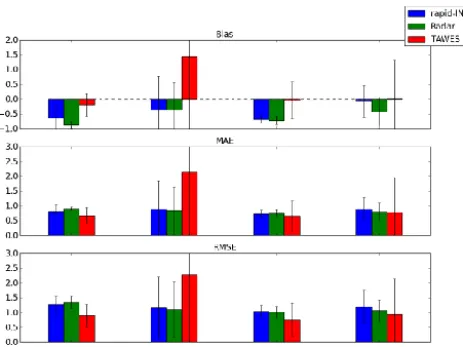
[image:7.612.313.546.64.240.2] [image:7.612.52.285.67.420.2]Figure 8. Relative bias, MAE and RMSE (weighted by the mean observed precipitation of WegenerNet). Values have been computed for each of the WegenerNet stations (151 stations) and then aver-aged over space. Error bars represent the standard deviation of ob-tained verification measures at each WegenerNet station.
Predominantly, both the onset and evolution of rapid-INCA precipitation amounts follow the WegenerNet observations. However, rapid-INCA underestimates the average precipi-tation rate in three of the cases, and shows an earlier onset and overestimation in the last case (1 September 2011). The latter situation is triggered by a slight overestimation of radar-derived QPE.
On the first 3 example days, widespread rain systems with embedded intensified precipitation regions and convection cross the target region from southwest/west. In these cases, signal attenuation in the extensive rain regions between radar station and target region and wetted radomes can contribute to the underestimated rain intensities in the radar QPE. On 1 September 2011, mainly one intense thunderstorm with se-vere hail at the ground is observed crossing the target region. The rainfall overestimation in this case may be attributed to uncorrected hail signals while the signal attenuation is negli-gible. Even if this simple validation approach is not suitable for a detailed quantitative analysis, it gives a qualitative view of the four cases under investigation.
[image:8.612.52.284.66.240.2]The verification measures of relative bias, MAE and RMSE (scaled by the mean observed precipitation at each of the WegenerNet stations) have been computed and aver-aged over space to evaluate the error characteristics of rapid-INCA. Only time steps with a minimum observed precipi-tation of 0.1 mm/5 min have been selected for the computa-tions. Figure 8 shows the resulting error measures along with the standard deviation indicated by the error bars. A nega-tive bias is visible for all rapid-INCA constituents except for the TAWES station interpolation on 15 August 2011. This is in accordance with the findings in Fig. 7. The error mea-sures MAE and RMSE are similar for rapid-INCA and radar-derived QPE, indicating that the radar-radar-derived QPE errors
Figure 9. Spatio-temporal distribution of 15 min interpolated TAWES station measurements (mm/15 min) on 1 September 2011 between 16:15 and 16:45 UTC (region of WegenerNet is shown by the black rectangle and the two TAWES stations of ZAMG are marked with a cross).
predominantly contribute to the rapid-INCA analysis errors. In certain cases (e.g. 15 August 2011 and 1 September 2011), the rapid-INCA analysis error is larger than the radar-derived QPE error. This indicates that the inclusion of the TAWES station observations may decrease the skill, i.e. the TAWES station observations are not representative for this specific precipitation event.
Moreover, the variation in the error measures across the WegenerNet domain is large for the TAWES stations, specif-ically on 15 August 2011 (only two TAWES stations are lo-cated within the WegenerNet area and constitute the inter-polated stations field; see Fig. 1). The comparison with the WegenerNet stations results in high variability of bias, MAE and RMSE on 15 August 2011 and 1 September 2011, which demonstrates the low representativeness of the TAWES sta-tion field. In such cases, the rapid-INCA analysis (i.e. combi-nation of station interpolation and radar-derived QPE) yields worse error measures than the pure radar-derived QPE. The high variability of rain gauge measurements (TAWES) can also be seen in the spatio-temporal distribution as shown in Fig. 9. The two TAWES stations are hit by a heavy (local-ized) precipitation cell on 1 September 2011 at 16:45 UTC, and the interpolation results in an exaggeration of the precip-itation field (compared to the rapid-INCA analysis in Fig. 6). In this case, an IDW interpolation with an exponent higher than 2 (instead of 1/r2), would limit the spatial influence of the TAWES stations and improve the results in regimes with local convection.
Figure 10. Skill scores for threshold of 0.5 mm/5 min. Scores are computed at each WegenerNet station and then averaged over space. Error bars indicate the standard deviation of the scores.
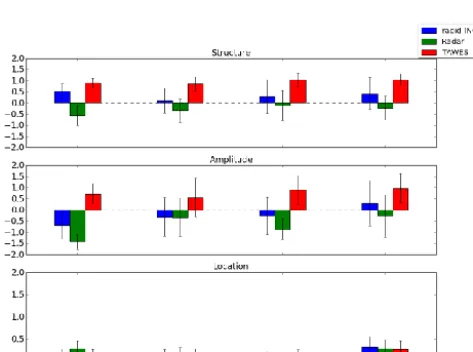
Figure 11. Structure, amplitude and location computed for each time step within the 2 h intervals at each date and subsequently av-eraged. Error bars indicate the standard deviation of S, A, L time series.
scores which can partly be explained by the decreasing sam-ple size. Another reason might be the tendency to miss heavy precipitation events with rapid-INCA.
For an objective analysis of the four cases, we applied the structure–amplitude–location (SAL) method (Wernli et al., 2008) to each time step within the respective 2 h intervals. The results are averaged and plotted in Fig. 11 with error bars indicating the standard deviation of the SAL time se-ries. As already emphasized in previous figures, the ampli-tude values of rapid-INCA show an underestimation of the observed precipitation in all but one case. Radar-derived QPE exhibits a higher underestimation than rapid-INCA which demonstrates the positive effect of merging interpolated rain gauge measurements (TAWES) with data of radar QPE. Only on 1 September 2011 did the TAWES station data
signifi-cantly overestimate precipitation, and in turn overcompen-sate the radar-derived QPE underestimation to finally yield a positive amplitude value of rapid-INCA. Positive struc-ture values indicate too large and/or too flat precipitation cells. Rapid-INCA overestimates the extent of precipitation cells (on average, as does the TAWES station interpolation). Radar-derived QPE in contrast yields negative structure val-ues, and thus underestimates the extent of the cells. These results suggest that the interpolation method of rain gauge measurements (TAWES) should take into account the current convective situation to be more confined for cases of heavy precipitation (e.g. IDW with a higher exponent, or more so-phisticated interpolation methods such as Kriging by using radar data fingerprints).
The location indicator of Fig. 11 does not yield conclusive results as it is relatively low for each of the rapid-INCA con-stituents. This behaviour may be explained by the small area under investigation and thus limited errors in displacement of cells.
4 Long-term validation results using WegenerNet data as reference
For the long-term validation, rapid-INCA analyses, radar-derived QPE and interpolated TAWES station measure-ments from the convective season in 2011 (1 April 2011 to 30 September 2011) at 5 min time steps have been in-terpolated to the WegenerNet stations (see Sect. 2.3). The relative bias, MAE and RMSE (scaled by mean measured WegenerNet precipitation) have been computed for each of the WegenerNet stations and, for better spatial representa-tion, interpolated to the INCA domain (by IDW).
Only time steps with measured WegenerNet precipitation exceeding a certain threshold have been used to avoid falsi-fying the error measures with precipitation-free time steps. Figure 12 presents the results for a selected threshold of 0.5 mm/5 min.
The bias shows substantial underestimation of the radar-derived QPE, with no specific spatial variation. Of course, interpolated rain gauge measurements exhibit a better agree-ment to observations in the vicinity of the two TAWES sta-tions than elsewhere. The rapid-INCA field also shows an un-derestimation of precipitation higher than 0.5 mm/5 min but with better results near the stations. In particular, the TAWES station of Feldbach (further north) has a positive impact on the bias of rapid-INCA. Note that the larger positive bias at one location in the northern part of the area is due to erro-neous measurements of the corresponding WegenerNet sta-tion.
[image:9.612.49.286.293.469.2]Figure 12. Relative bias, MAE and RMSE for rapid-INCA, radar and TAWES stations at each WegenerNet station. Only those data points are included where the WegenerNet station measured more than 0.5 mm/5 min. Circles represent exact values at the WegenerNet stations; the image is obtained by IDW interpolation to the INCA grid.
station data and rapid-INCA exhibit a better performance around the Feldbach station. The TAWES station further south (Bad Gleichenberg) yields worse results which may be attributed to the topography in this region: Bad Gleichenberg is surrounded by hills to the north, east and west (Fig. 1). With the closest radars as far as 100 and 135 km away, the large scan volumes in the areas of interest reduce the spatial variability which can be resolved in the radar measurement. The minimum visible height of 2000 m above ground adds further estimation errors for ground precipitation. But local differences cannot be attributed to local beam shielding ef-fects (compare Fig. 2b).
Figure 13 shows the skill score results for a threshold of 0.5 mm/5 min. Obviously, there is a tendency to underesti-mate the precipitation amounts (FBI<1) for all components; the best results for FBI are obtained close to the TAWES sta-tion of Feldbach. TSS indicates more hits than misses (TSS closer to 1) near the stations. ETS yields best results for the rapid-INCA analysis.
To investigate the influence of the threshold on the error measures and skill scores, mean values of the error measures and skill scores have been calculated for several thresholds (Fig. 14). The bias of rapid-INCA increases for increasing thresholds of the selected data. Thus, there is a pronounced underestimation of heavy precipitation events. Interpolated rain gauge measurements yield a lower negative bias com-pared to rapid-INCA which can be attributed to the relatively better performance near the stations, whereas rapid-INCA shows a spatially more homogeneous distribution of the bias
(compare Fig. 12). Generally, the variation in error measures and skill scores for the TAWES station data is much higher than for rapid-INCA analysis and radar-derived QPE. Aver-aging over the WegenerNet domain can lead to better perfor-mance of the error measures and skill scores.
Note that the MAE increases with the threshold whereas the RMSE is decreasing. This behaviour indicates that large errors mostly occur for samples including light precipitation amounts (with RMSE putting higher weight on outliers). The coarse resolution of the radar data with a minimum detected signal of 11.8 dBZ (approximately 0.2 mm h−1) and the re-duced visibility in the target region can be reasons for the underestimation of light precipitation in rapid-INCA analy-ses.
Figure 13. Skill scores for rapid-INCA, radar and TAWES stations at each WegenerNet station. Circles represent the exact values; the image is obtained by interpolation to the INCA grid.
Figure 14. Mean relative error scores (bias, MAE, RMSE) and mean skill scores (FBI, TSS, ETS) computed for several thresholds.
Marshall–Palmer relation, which is used to convert radar re-flectivities to rainfall intensities. It has been concluded in sev-eral studies that different rain types would need differentZ– R relationships (Austin, 1987; Atlas et al., 1999; Steiner et al., 2004). The Marshall–Palmer relation has been found to yield good results in stratiform rain, but can fail in convective
[image:11.612.92.504.360.593.2]5 Conclusions
In this study, the performance of short-duration, high-resolution precipitation analyses has been elaborated by means of a set of convective events and a long-term valida-tion covering the convective season in 2011 (1 April 2011– 30 September 2011). In order to point out the small-scale features of convective events, the dense station network of WegenerNet, which is located in the southeastern parts of Austria (Styria), has been used as a reference.
The validation results show a general underestimation of rapid-INCA and its constituents (radar-derived QPE and rain gauge measurements of TAWES). The spatial variation in error measures is highest for the interpolated TAWES sta-tion data. Results from the four selected cases in August and September 2011 show that the contribution from TAWES sta-tion interpolasta-tion can either have a positive or negative im-pact on the rapid-INCA skill, depending on the representa-tiveness of the station measurements. Merging TAWES sta-tion data with radar-derived QPE is able to reduce this effect, but is not able to avoid it completely. Another reason for the underestimation might be the tendency to miss heavy precip-itation with rapid-INCA.
This study indicates that the station contributions play a crucial part in the performance of the rapid-INCA analyses or in general in any radar–gauge merging method. Depending on the prevalent synoptic situation, e.g. local convection or large-scale precipitation, it may prove useful to adapt the sta-tion interpolasta-tion algorithm accordingly. Instead of a static IDW with both a fixed number of included nearest stations and a fixed exponent it could be advantageous to apply an IDW with dynamically adjusted parameters. Thus, further studies are needed to investigate the influence of IDW pa-rameters as well as modifications in the combination algo-rithm on the validation results. Also an improved pre-scaling of radar QPE may be useful since radar QPE shows a strong underestimation over the whole data set. As was outlined in detail 35 years ago in Wilson and Brandes (1979) and more recently in Krajewski et al. (2010), radar QPE is prone to a number of measurement errors.
For rapid-INCA analyses, the MaxCAPPI product is used as the best available information source. As the data are only corrected for ground clutter and R-LAN, beside residual clut-ter, all other error sources have to be considered when radar QPE is used. Topographically complex domains will always face the problem of locally reduced radar visibilities and ele-vated radar locations on mountain massifs. However, the re-cent upgrade of the Austrian radar network to dual-pol tech-nology provides possibilities for more sophisticated meth-ods of quality control and data correction, which promise more accurate radar QPE products. Apart from further im-provements by applying more sophisticated radar–rain gauge blending methods, the quantification of the uncertainties re-lated to the representativeness problem is a key issue in the generation of an ensemble of precipitation analyses.
The present study reveals that the WegenerNet, which of-fers high-quality station measurements on very high tempo-ral and spatial resolution, is ideally suited to further improve precipitation analyses and to assess their skill and uncer-tainty.
Acknowledgements. The authors thank Martin Suklitsch, Christine Gruber and Robert Goler for fruitful discussions about scientific and operational issues, and the editor and two anonymous referees for fruitful comments that led to substantial improvements of the paper.
Edited by: U. Ehret
References
Atlas, D., Ulbrich, C. W., Marks Jr., F. D., Amitai, E., and Williams, C. R.: Systematic variation of drop size and radar-rainfall rela-tion, J. Geophys. Res., 104, 6155–6169, 1999.
Austin, P. M.: Relation between Measured Radar Reflectivity and Surface Rainfall, Mon. Weather Rev., 115, 1053–1070, 1987. Chumchean, S., Sharma, A., and Seed, A.: An Integrated Approach
to Error Correction for Real-Time Radar-Rainfall Estimation, J. Atmos. Ocean. Technol., 23, 67–79, 2006.
Foote, G. B.: A Z-R relation for mountain thunderstorms, J. Appl. Meteorol., 2, 229–231, 1966.
Golding, B. W.: Nimrod: A system for generating automated very short range forecasts, Meteorol. Appl., 5, 1–16, 1998.
Goudenhoofdt, E. and Delobbe, L.: Evaluation of radar-gauge merging methods for quantitative precipitation estimates, Hy-drol. Earth Syst. Sci., 13, 195–203, doi:10.5194/hess-13-195-2009, 2009.
Gregow, E., Saltikoff, E., Albers, S., and Hohti, H.: Precipitation ac-cumulation analysis – assimilation of radar-gauge measurements and validation of different methods, Hydrol. Earth Syst. Sci., 17, 4109–4120, doi:10.5194/hess-17-4109-2013, 2013.
Haiden, T. and Pistotnik, G.: Intensity-dependent parameterization of elevation effects in precipitation analysis, Adv. Geosci., 20, 33–38, doi:10.5194/adgeo-20-33-2009, 2009.
Haiden, T., Kann, A., Wittmann, C., Pistotnik, G., Bica, B., and Gruber, C.: The Integrated Nowcasting through Comprehensive Analysis (INCA) System and Its Validation over the Eastern Alpine Region, Weather Forecast., 26, 166–183, 2011.
Handcock, M. S. and Stein, M. L.: A Bayesian analysis of Kriging, Technometrics, 35, 403–410, 1993.
Kabas, T.: WegenerNet Klimastationsnetz Region Feldbach: Ex-perimenteller Aufbau und hochauflösende Daten für die Klima-und Umweltforschung, Wiss. Ber. 47, document WCV-WissBer-No47-TKabas-Jan2012.pdf, Wegener Center Verlag, Graz, Aus-tria, available at: http://www.wegcenter.at/wcv/ (last access: 16 February 2015), 2012.
Kabas, T., Foelsche, U., and Kirchengast, G.: Seasonal and an-nual trends of temperature and precipitation within 1951/1971– 2007 in South-Eastern Styria/Austria, Meteorol. Z., 20, 277–289, 2011a.
network structure, processing system, and example results, Adv. Sci. Res., 6, 49–54, 2011b.
Kaltenboeck, R.: New generation of dual polarized weather radars in Austria, in: Proceedings of the 7th European Conference on Radar in Meteorology and Hydrology (ERAD), Toulouse, France, 24–29 June 2012, 6 pp., 2012.
Kaltenboeck, R. and Steinheimer, M.: Radar-based severe storm climatology for Austrian complex orography related to vertical wind shear and atmospheric instability, Atmos. Res., 158–159, 216–230, doi:10.1016/j.atmosres.2014.08.006, 2015.
Kann, A., Haiden, H., von der Emde, K., Gruber, C., Kabas, T., Le-uprecht, A., and Kirchengast, G.: Verification of operational anal-yses using an extremely high-density surface station network, Weather Forecast., 26, 572–578, 2011.
Kirchengast, G., Kabas, T., Leuprecht, A., Bichler, C., and Truhetz, H.: WegenerNet: A pioneering high-resolution network for moni-toring weather and climate, B. Am. Meteorol. Soc., 95, 227–242, 2014.
Komma, J., Reszler, C., Blöschl, G., and Haiden, T.: Ensem-ble prediction of floods – catchment non-linearity and fore-cast probabilities, Nat. Hazards Earth Syst. Sci., 7, 431–444, doi:10.5194/nhess-7-431-2007, 2007.
Krajewski, W. F.: Co-kriging radar-rainfall and raingage data, J. Geophys. Res., 92, 9571–9580, 1987.
Krajewski, W. F., Villarini, G., and Smith, J. A.: RADAR-Rainfall Uncertainties, B. Am. Meteorol. Soc., 91, 87–94, 2010. Marshall, J. S. and Palmer, W. M.: The distribution of raindrops
with size, J. Meteorol., 5, 165–166, 1948.
Overeem, A., Holleman, I., and Buishand, A.: Derivation of a 10-year radar-based climatology of rainfall, J. Appl. Meteorol. Clim., 48, 1448–1463, 2009.
Pereira Fo, A. J., Crawford, K. C., and Hartzell, C. L.: Improv-ing WSR-88D Hourly Rainfall Estimates, Weather Forecast., 13, 1016–1028, 1998.
Rezacova, D. and Sokol, Z.: Results of numerical experiments with LM DWD – First attempts to verify precipitation forecast by radar derived rainfall fields (1998 flood event), COST-717 Work-ing document WDF_02_200204_2, Brussels, 12 pp., 2002.
Rossa, A., Bruen, M., Frühwald, D., Macpherson, B., Holleman, I., Michelson, D., and Michaelides, S.: Use of Radar Observations in Hydrological and NWP Models. ESSEM COST Action 717, Office for Official Publications of the European Communities, Brussels, 292 pp., 2005.
Sattler, K. and Feddersen, H.: Limited-area short-range ensemble predictions targeted for heavy rain in Europe, Hydrol. Earth Syst. Sci., 9, 300–312, doi:10.5194/hess-9-300-2005, 2005.
Scheidl, D.: Improved quality control for the WegenerNet and demonstration for selected weather events and climate. Sci. Rep. No. 61, document WCV-SciRep-No61-DScheidl-Oct2014.pdf, Wegener Center Verlag, Graz, Austria, available at: http://www. wegcenter.at/wcv/ (last access: 16 February 2015), 2014. Steiner, M., Smith, J. A., and Uijlenhoet, R.: A Microphysical
In-terpretation of Radar Reflectivity–Rain Rate Relationships, J. At-mos. Sci., 61, 1114–1131, 2004.
Sun, X., Mein, R. G., Keenan, T. D., and Elliott, J. F.: Flood es-timation using radar and raingauge data, J. Hydrol., 239, 4–18, 2000.
Wernli, H., Paulat, M., Hagen, M., and Frei, C.: SAL – A novel quality measure for the verification of quantitative precipitation forecasts, Mon. Weather Rev., 136, 4470–4487, 2008.
Wilks, D. S.: Statistical Methods in the Atmospheric Sciences, 2nd Edn., Academic Press, Burlington, MA; London, 627 pp., 2006. Wilson, J. W. and Brandes, E. A.: Radar Measurement of Rainfall –
A Summary, B. Am. Meteorol. Soc., 60, 1048–1058, 1979. Wittmann, C., Haiden, T., and Kann, A.: Evaluating multi-scale
pre-cipitation forecasts using high resolution analysis, Adv. Sci. Res., 4, 89–98, 2010.