www.hydrol-earth-syst-sci.net/19/4023/2015/ doi:10.5194/hess-19-4023-2015
© Author(s) 2015. CC Attribution 3.0 License.
High-resolution modelling of interactions between soil moisture and
convective development in a mountain enclosed Tibetan Basin
T. Gerken1,2,a, W. Babel1, M. Herzog2, K. Fuchs1,b, F. Sun3, Y. Ma4, T. Foken1,5, and H.-F. Graf2 1Department of Micrometeorology, University of Bayreuth, Bayreuth, Germany
2Centre for Atmospheric Science, Department of Geography, University of Cambridge, Cambridge, UK
3Cold and Arid Regions Environmental and Engineering Research Institute, Chinese Academy of Sciences, Lanzhou, China 4Key Laboratory of Tibetan Environment Changes and Land Surface Processes, Institute of Tibetan Plateau Research, Chinese Academy of Sciences, CAS Center for Excellence in Tibetan Plateau Earth Sciences, Beijing, China
5Member of Bayreuth Center of Ecology and Environment Research (BayCEER), Bayreuth, Germany anow at: Department of Meteorology, The Pennsylvania State University, University Park, PA, USA bnow at: Institute of Agricultural Science, ETH Zürich, Zurich, Switzerland
Correspondence to: T. Gerken ([email protected])
Received: 27 March 2015 – Published in Hydrol. Earth Syst. Sci. Discuss.: 4 May 2015 Revised: 20 August 2015 – Accepted: 15 September 2015 – Published: 29 September 2015
Abstract. The Tibetan Plateau plays a significant role in at-mospheric circulation and the Asian monsoon system. Tur-bulent surface fluxes and the evolution of boundary-layer clouds to deep and moist convection provide a feedback sys-tem that modifies the plateau’s surface energy balance on scales that are currently unresolved in mesoscale models. This work analyses the land surface’s role and specifically the influence of soil moisture on the triggering of convection at a cross section of the Nam Co Lake basin, 150 km north of Lhasa using a cloud-resolving atmospheric model with a fully coupled surface. The modelled turbulent fluxes and de-velopment of convection compare reasonably well with the observed weather. The simulations span Bowen ratios of 0.5 to 2.5. It is found that convective development is the strongest at intermediate soil moisture. Dry cases with soils close to the permanent wilting point are moisture limited in convective development, while convection in wet soil moisture cases is limited by cloud cover reducing incoming solar radiation and sensible heat fluxes, which has a strong impact on the surface energy balance. This study also shows that local de-velopment of convection is an important mechanism for the upward transport of water vapour, which originates from the lake basin that can then be transported to dryer regions of the plateau. Both processes demonstrate the importance of soil moisture and surface–atmosphere interactions on the energy and hydrological cycles of the Tibetan Plateau.
1 Introduction
The Tibetan Plateau has an average elevation of more than 4500 m and is the world’s largest mountain highland. Land use/land cover change, such as permafrost (Cheng and Wu, 2007) and grassland degradation or deforestation (Cui and Graf, 2009; Cui et al., 2006), but also effects on the carbon and hydrological cycles (Babel et al., 2014), are associated with overuse of resources and climate change. They also af-fect atmospheric circulation and hydrological resources of the Tibetan Plateau, especially the cryosphere (i.e. Yao et al., 2007; Ni, 2011; Kang et al., 2010; Yang et al., 2011, 2014). Effects on the hydrological cycle are likely enhanced due to changes in phenology and length of the growing season (Shen et al., 2014; Che et al., 2014; Zhang et al., 2014). Ac-cording to Immerzeel et al. (2010) more than 1.4 billion peo-ple in Southeast Asia live in the catchments of rivers orig-inating on the Tibetan Plateau. It is therefore important to gain a better understanding of the hydrological processes in the region.
Gao et al., 1981; Yanai et al., 1992). This heating is proba-bly not the main driver of the Indian monsoon system (Mol-nar et al., 2010; Boos and Kuang, 2010), but acts to mod-ify it and influences regional atmospheric circulation as well as eastern Asian precipitation (i.e. Liang and Wang, 1998; Zhou et al., 2004). While conventional atmospheric circula-tion models do not have a high enough resolucircula-tion to resolve the relevant hydrological processes on the local scale, cloud-resolving models with a fully coupled surface model, as in-troduced by Patton et al. (2005), present a valuable tool for the systematic investigation of surface–atmosphere interac-tions, convective development and locally generated precipi-tation.
The triggering of deep convection over topography is a major source of precipitation in mountainous environments (e.g. Banta and Barker Schaaf, 1987; Gochis et al., 2004). The summer monsoon season is associated with an increase of the total precipitable water in the atmosphere from ap-prox. 5 to >15 mm and a destabilisation of the atmospheric profile (Taniguchi and Koike, 2008). A diurnal cycle in cloud development leading to the triggering of local convection be-fore noon is commonly observed on the Tibetan Plateau and is organised by thermal valley circulations (i.e. Ueno, 1998; Ueno et al., 2009; Yatagai, 2001; Kuwagata et al., 2001; Kurosaki and Kimura, 2002). This organisation of local cir-culation leads to daytime precipitation over mountain ridges and to night-time precipitation from convergence in the basin centre (Ueno et al., 2009). Modelling studies (Kuwagata et al., 2001) and remote sensing (Yatagai, 2001) have de-termined valley scales of 160–240 km to be most effective for these processes. Yang et al. (2004) have also investigated thermal circulations on the Tibetan Plateau and found sec-ondary triggering of convection within Tibetan valleys as a result of cold-pool fronts caused by convective events that were triggered over the mountains. Similar effects were sim-ulated for Nam Co Lake as the result of a combined lake breeze–thermal mountain circulation (Gerken et al., 2014). Uyeda et al. (2001) measured maximum cloud top heights of 17 km a.s.l. in the Nagqu Basin occurring between 12:00 and 15:00 LT. Yamada and Uyeda (2006) found different struc-tures of convection and precipitation on the Tibetan Plateau, which were associated with dry and moist surfaces. Dry sur-faces during the pre-monsoon led to a high cloud base and in-creased re-evaporation of precipitation, while moist surfaces during the monsoon yielded lower cloud bases and higher rates of deposited precipitation. A modelling investigation (Yamada, 2008) confirmed this process and showed stronger convective motion for the dry case. Hence, complex interac-tion of local and larger scale circulainterac-tion with local environ-mental conditions are essential for the evolution of clouds and the hydrological cycle on the Tibetan Plateau.
The influence of the monsoon declines to the North on the Tibetan Plateau (Tian et al., 2001, 2003, 2007). At the same time local moisture recycling on the central plateau becomes essential keeping the regional water cycle active (Kurita and
Yamada, 2008). Their research highlights the importance of the boundary layer as a major source of the precipitated water during night-time and of locally generated convection. Con-vection and precipitation at Nam Co Lake are both influenced by the lake’s water body (Li et al., 2009) and the complex to-pography (Maussion et al., 2011, 2014).
We previously investigated surface–atmosphere interac-tions, the development of mesoscale circulations and the evolution of convection in the Nam Co Lake basin. In Gerken et al. (2014), we applied a surface model (Gerken et al., 2012), coupled to the cloud-resolving ATHAM (Ac-tive Tracer High-resolution Atmospheric Model – Oberhu-ber et al., 1998; Herzog et al., 1998) and analysed convective triggering at Nam Co Lake. It was shown that the model can reproduce the most important atmospheric dynamics of the Nam Co Basin. Subsequently, the impact of different atmo-spheric profiles on convection and precipitation was investi-gated (Gerken et al., 2013a). These studies highlighted the importance of surface–atmosphere interactions in the gener-ation of precipitgener-ation and convection.
Observed Bowen ratios at Nam Co station vary from 3 to 0.5, with maximum latent heat fluxes exceeding 400 W m−2during wet conditions (Gerken et al., 2012). As a consequence Nam Co Lake can be classified as a semi-arid transitional region with strong soil moisture–climate cou-pling (Seneviratne et al., 2010). While the existence of feed-backs between land-surface moisture, rainfall and convec-tive development is well known, there is disagreement on the dominating processes and the sign of the resulting feed-back (Barthlott et al., 2011). Following the mechanism by Pal and Eltahir (2001), increased soil moisture increases the boundary layer’s total convective available energy and low-ers the lifting condensation level; both increase moist con-vection. At the same time, decreased solar radiation input due to larger cloud cover can reduce the available energy and thus convective development (Seneviratne et al., 2010; Pal and Eltahir, 2001; Pan et al., 1996). While soil moisture– atmosphere interactions occur on many different spatial and temporal scales, interactions on the seasonal scale are well documented (e.g. Fischer et al., 2007). Taylor et al. (2012) showed that the likelihood of convective precipitation over wet soils was increased. Interactions on shorter timescales are less well understood. Clark et al. (2004) have demon-strated that moisture variability on the 10 km scale can induce regional circulations that enhance convection. Additional ev-idence for the influence of soil-moisture-induced mesoscale circulations on convective development was found in ob-servational (Taylor et al., 2007) and modelling studies (e.g. Cheng and Cotton, 2004; Garcia-Carreras et al., 2010). Due to the localised convection triggering on the Tibetan Plateau, such processes might also play a role for precipitation at Nam Co Lake.
the model resolution in the Alpine region. Convection per-mitting resolutions led to predominantly negative feedbacks, caused by the presence of a stable layer above the bound-ary layer, while lower resolutions with parameterized con-vection showed positive feedbacks. Similarly, Barthlott et al. (2011) and Hauck et al. (2011) found considerable feedbacks between soil moisture and precipitation, but with a variable sign of the feedback. They identified convective inhibition as a major cause.
It is, therefore, key to understand soil moisture precipita-tion dynamics and its feedbacks at Nam Co Lake and simi-lar basins to gain a better understanding of the hydrological cycle on the Tibetan Plateau scale. This work investigates the role of the interactions between the lake, the surround-ing basin with complex topography and the atmosphere in the development of boundary-layer clouds and their evolu-tion into deep moist convecevolu-tion. We analyse (1) the sensi-tivity of convective development to surface moisture, (2) the modification of the surface energy balance through feedbacks between surface fluxes, specifically evapotranspiration, and cloud development and (3) the implications for locally trig-gered, convective precipitation at Nam Co Lake.
2 Material and methods 2.1 Site description
Nam Co Lake, approx. elevation 4730 m a.s.l., is located circa 150 km north of Lhasa and just to the north of the Nyenchen Thangla mountain chain, which has maximum peak heights of more than 7000 m. The average elevation of the Nam Co Basin is 5230 m (Liu et al., 2010). Between 6 July and 6 August 2012 scientists from the University of Bayreuth conducted a field experiment at Nam Co Lake in cooperation with the Institute of Tibetan Plateau Research, Chinese Academy of Sciences. The Nam Co Lake Monitor-ing and Research Station for Multisphere Interactions (Ma et al., 2009) is located at 30◦46.440N, 90◦57.720E. It is sit-uated at a distance of 300 m from a small lake, which is di-vided from Nam Co Lake to the north-west through a 500 m wide land bridge. The experiment is documented in Gerken et al. (2013b). Radiosondes were released on 8 days be-tween 17 and 29 July for 00:00, 06:00 and 12:00 UTC. Eddy-covariance flux measurements were performed with a CSAT-3 sonic anemometer and KH2O-krypton hygrometer (both Campbell Scientific). The KH2O was calibrated on site in accordance with Foken and Falke (2012). Standard atmo-spheric and soil temperature as well as moisture measure-ments were also carried out.
[image:3.612.340.516.129.287.2]As described in Gerken et al. (2014), the TK2/3 soft-ware package (Mauder and Foken, 2004, 2011) was used to post-process the high-frequency measurements. All flux corrections and post-processing steps recommended in Fo-ken et al. (2012) and Rebmann et al. (2012) were applied to
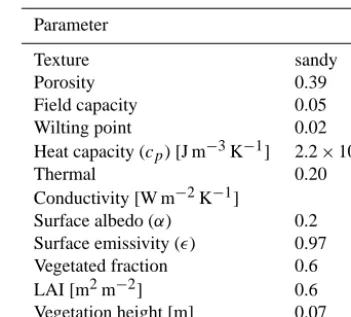
Table 1. Description of the soil and surface parameters at Nam Co
station (30◦46.440N, 90◦57.720E) and which are also used for the
simulations. Leaf area index (LAI) and vegetation height were esti-mated for July 2012 (Biermann et al., 2009). The table is modified from Gerken et al. (2013a).
Parameter
Texture sandy
Porosity 0.39
Field capacity 0.05
Wilting point 0.02
Heat capacity (cp)[J m−3K−1] 2.2×10⁶
Thermal 0.20
Conductivity[W m−2K−1]
Surface albedo (α) 0.2
Surface emissivity () 0.97
Vegetated fraction 0.6
LAI[m2m−2] 0.6
Vegetation height[m] 0.07
the flux data. Unlike surface models, the energy balance of eddy-covariance measurements is inherently unclosed (i.e. Foken, 2008; Foken et al., 2011). The presence of station-ary, secondary circulations leads to a missing flux fraction of approx. 30 % at Nam Co Lake. Therefore, before compar-ing measured and modelled fluxes, it is necessary to correct eddy-covariances fluxes according to the Bowen ratio (Twine et al., 2000). Additional information about flux dynamics at Nam Co Lake can be found in Biermann et al. (2014). Vaisala RS92-SGP radiosondes on Totex-TA600 balloons were launched from a portable Vaisala sounding system with a mobile GPS antenna and signals were processed with the SPS-220 unit and DigiCora III MW21 software v3.2.1.
This work uses mean local time throughout, which is close to UTC+6 h or 2 h before Beijing Standard Time. On 17 July sunrise, solar noon and sunset were determined with the National Oceanic and Atmospheric Administration Sun-rise/Sunset Calculator as 23:05, 06:02 and 13:00 UTC.
Figure 1. Land use map of Nam Co Lake created from Landsat data. The yellow line shows the path of radiosonde ascent on 17 July 2012, 00:00 UTC. The yellow circle indicates the location at which the radiosonde reaches 10 km a.g.l. and the cold-point height. The cyan cross indicates the location of Nam Co station. The inset, reproduced from Gerken et al. (2012), shows the area near the small lake and the location
of Nam Co Station (NamITP).©2012, The Microsoft Corporation,©Harris Corp, Earthstar Geographics LLC.
2.2 Model description
The non-hydrostatic, cloud-resolving ATHAM model (Ober-huber et al., 1998; Herzog et al., 1998, 2003), used in this study has originally been developed to simulate volcanic eruption plumes (Graf et al., 1999). Subsequently, it was applied to biomass-burning plumes (e.g. Trentmann et al., 2006) and atmospheric applications (Guo et al., 2004). The model uses a zvertical coordinate, and can be run both in 2-D and 3-D mode. Tracers, including all hydrometeors, are active. This means that the density of the gas-particle mix-ture and heat capacity of the fluid are influenced by the local concentration of all tracers (Oberhuber et al., 1998).
The simulations in this work include the following phys-ical processes, and are similar to the work in Gerken et al. (2013a): shortwave radiation (Langmann et al., 1998), long-wave radiation (Mlawer et al., 1997), and bulk microphysics (Herzog et al., 1998). Turbulence closure is of the order of 1.5 and predicts both turbulent length scale and turbulent kinetic energy (horizontal and vertical) (Herzog et al., 2003). The modified Hybrid (v6) land-surface model (Friend et al., 1997; Friend and Kiang, 2005; Gerken et al., 2012) and the Cou-pled Ocean–Atmosphere Response Experiment (COARE) – algorithm v2 (Fairall et al., 1996a, b) water surface scheme compute turbulent energy fluxes above land and water. Nam Co Lake has a mean depth of >50 m (Wang et al., 2009). The surface model and the coupled system were shown to perform well for this site (Gerken et al., 2012, 2013a, 2014)
and the reader is referred to these publications for a more extensive model description.
2.3 Model set-up and cases
Due to the almost parallel orientation of Nam Co Lake and the Nyenchen Thangla mountains, it is possible to simu-late the system’s most important dynamical features such as the diurnal cycle of turbulent fluxes, the formation of a lake breeze and the interaction between locally generated clouds and the complex topography using a 2-D approach (Gerken et al., 2013a, 2014). Our model domain cuts across the lake, the Nam Co station, as location of our measure-ments, and through the Nyenchen Thangla mountain chain, which is of relatively low height at this location compared to the glaciated peaks in the western range. The maximum elevation difference between the lake level and the mountain chain is approx. 800 m. As the 2-D modelling set-up does not permit flow around the mountain chain, we expect to overes-timate the influence of topography.
mov-[K]
325 375 425 475
Height agl [km]
0 2.5 5 7.5 10 12.5 15
a) θ (-), θ
e (- -) and
θ
e, sat (- - )
[oC] -70 -50 -30 -10
b) T (-) and T
dew (- -)
Height agl [km]
0 5 10
[image:5.612.129.470.64.226.2]c) q
Figure 2. Initial profile for Nam Co Lake 17 July 2012 06:00 LT used in the model simulations as measured by radiosonde. (a) Potential (θ),
equivalent potential temperature (θe), and saturated equivalent potential temperature (θe,sat); (b) temperature (T) and dew-point temperature
(Tdew) and (c) mixing ratio (q).
ing window was used to smooth the topography within the basin, convective development has a negligible sensitivity to the window size as shown in the supplement to Gerken et al. (2013a). Outside the Nam Co Basin the topography is set to the same elevation as the lake. Surface energy fluxes are gradually reduced to zero in the vicinity of the horizon-tal boundary, as we are interested in the behaviour of the mountain–lake system enclosed by mountains and hills. In contrast to cyclic lateral boundary conditions for momen-tum, hydrometeor tracers and water vapour concentrations exceeding the initialised profile are removed, without intro-ducing a density perturbation. The 2-D simulations are inte-grated from 04:00 to 20:00 LT. The model time step is 2.5 s. To assess the suitability of the 2-D simulations, we compare the convective development in 2-D with a 3-D simulation of the cross section that allows for the triggering of convection in three dimensions. The 3-D simulation spans the same do-main in the principal horizontal and vertical dimension, and is integrated over the first 12 h. While the vertical resolution is identical to the 2-D simulations, the horizontal domain re-solves the central 80 km and thus the lake basin and topo-graphic elements at 200 m and then applies a grid stretching to span the total domain with a total of 490 grid points. The second horizontal dimensions span 10 km with 200 m reso-lution and uniform topography in theydirection. The lateral boundary in this dimension is fully cyclic.
The 17 July 2012 was selected as the basis for the in-vestigations presented in this work as this day was free of large-scale synoptic effects, which are not included in the model, and showed a characteristic evolution from clear sky with few boundary-layer clouds to locally generated “Cu-mulonimbus” activity. Gerken et al. (2013a) showed that the model realistically reproduced the observed weather and the evolution of the vertical profiles for temperature and mois-ture. Figure 2 displays the temperature and moisture profiles
derived from the 00:00 UTC radiosounding of 17 July. The initial relative humidity (RH) of the atmospheric profile is reduced to a maximum of 90 %. This is reasonable as there was no closed cloud cover at the time of the sounding so that cloud passages of a radiosonde would lead to an overesti-mation of relative humidities at the respective level. As the focus of this work is the investigation of the impacts of vary-ing soil moisture, the initial geostrophic wind is set to 3 m s−1 throughout the model domain, which exhibited the most real-istic convection in Gerken et al. (2014). This also avoids wind shear to which 2-D simulations are very sensitive (i.e. Kir-shbaum and Durran, 2004). The model was initialised with 6.8 and 2.6◦C as first and second layer mean temperaturesT
1 andT2, which corresponds to an initial surface temperature (T0) of 4.5◦C. For the complete description of the Hybrid surface model initialisation the reader is referred to Gerken et al. (2012). Soil moisture in the surface model is initialised as a fraction of field capacity (FC), which is the amount of water a soil can hold against gravity. In order to investigate the influence of soil moisture on convective development, we set the initial soil moisture of the simulations to 2.0, 1.5, 1.0, 0.75, 0.5 and 0.4×FC. These cases are subsequently referred to by their initial soil moisture (e.g. “1.0×FC”).
While the 2.0×FC case corresponds to a realistic surface initialisation for 17 July, we leave soil temperatures and thus soil heat contents unmodified and reduce soil moisture grad-ually to the permanent wilting point (PWP=0.4×FC). The lake surface temperature is initialised with 10◦C, which is
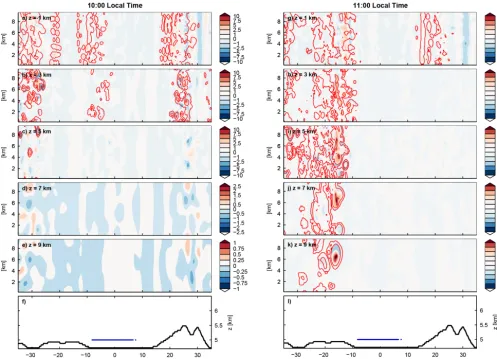
Figure 3. Development of convection in the 3-D simulation of case 2.0×FC at 10:00 LT for heights 1, 3, 5, 7 and 9 km a.g.l. (a–e); at
11:00 LT (g–k). The filled contours indicate vertical velocities (w, [m s−1]) and the red contour lines show the location of clouds; (f, l) display
the topography of the model domain. The location of the lake is indicated by the blue line.
3 Results and discussion
3.1 Comparison of 2-D vs. 3-D
While 2-D simulations of deep convective development are frequently used to investigate the triggering of convection (i.e. Wu et al., 2009; Kirshbaum, 2011; Garcia-Carreras et al., 2011), they may overestimate convection due to the lack of entrainment in their convective plumes (e.g. Petch et al., 2008). As a consequence, we start the analysis by compar-ing the convective development for case 2.0×FC between the 2-D and 3-D simulations. As in Gerken et al. (2013a), we consider grid elements with liquid water contents (both water and ice) ofqt>10−3g kg−1as clouds.
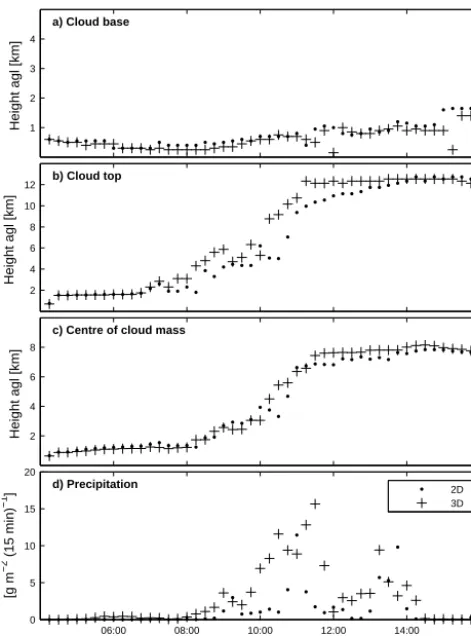
Figure 3 shows the development of vertical velocities and cloud cover at several heights for 10:00 and 11:00 LT for the case 2.0×FC in the 3-D set-up. During this time boundary-layer clouds that form near the mountains and hills develop into a convective plume that reaches 9 km a.g.l. at 10:30 LT
(not shown) and then develops further. Overall, this results in maximum updraft strengths in excess of 10 m s−1. Subse-quently, the cloud development in terms of cloud base height, cloud top height and centre of the cloud mass (Zc) as defined by Wu et al. (2009):
Zc= R R
qtzdxdz R R
qtdxdz
, (1)
1 2 3 4
a) Cloud base
Height agl [km]
2 4 6 8 10
12 b) Cloud top
Height agl [km]
2 4 6 8
c) Centre of cloud mass
Height agl [km]
06:00 08:00 10:00 12:00 14:00
0 5 10 15 20
d) Precipitation
Local Time
[g m
−2
(15 min)
−1
] 2D
[image:7.612.50.286.65.383.2]3D
Figure 4. Comparison between the 2-D and 3-D simulation of case
2.0×FC for (a) cloud base height, (b) cloud top height, (c) the
centre of cloud mass (Zcas defined in text) and (d) mean deposited
precipitation.
However, due to the topographic forcing clouds are organised in bands so that entrainment is of less importance than antic-ipated. Our results are comparable to Garcia-Carreras et al. (2011), who also had stronger cloud development in the 3-D case. This might be due to the absence of lateral entrainment of dry air due to the limited extent and cyclic nature of the third dimension.
Despite some differences in the structure of convective evolution, the resulting convective development is suffi-ciently similar to focus on a 2-D approach to further evaluate the behaviour of the system.
3.2 Turbulent fluxes
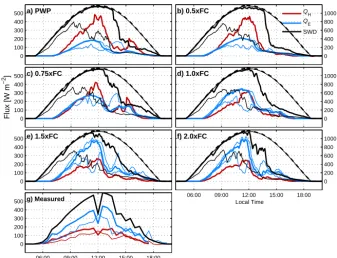
We investigate the locally driven evolution from boundary-layer clouds to precipitating convection as is frequently ob-served at Nam Co Lake. Variation of initial soil moisture con-tents in Hybrid leads to a shift in the Bowen ratio. Figure 5 displays the diurnal cycle of the simulated median turbulent latent (QE) and sensible heat fluxes (QH) as well as incom-ing solar radiation (SWD). The last panel shows the observed quantities at Nam Co station. As expected, the Bowen ratio
changes from approx. 2.5 for the dry surface at PWP to 0.5 for the moist surface at 2.0×FC. While the incoming so-lar radiation initially follows the clear-sky radiation, there is a reduction of downward shortwave radiation seen in both the simulations and the measured fluxes after solar noon. This decrease in incoming solar radiation is the strongest for 1.0×FC, while 1.5×FC and 2.0×FC show a slightly weaker decline during the afternoon. This highlights the im-pact of soil moisture on cloud development. Larger latent heat fluxes lead to increased cloud formation, which is fur-ther discussed in the next sections. Solar radiation and face fluxes were measured at Nam Co station, while the sur-face model calculated sursur-face fluxes are for the total model domain. Due to the stochastic nature of turbulence, it is not meaningful to directly compare a single model grid cell to the measured data. However, it is possible to say that the median, simulated solar radiation flux within the Nam Co Basin for case 0.75×FC resembles most closely the measurements, while the moister cases have lower simulated solar irradia-tion. A comparison between the grid cell closest to the station and measurements (not shown) indicates that case 1.5×FC matches most closely the observed fluxes in both terms of the Bowen ratio and the decrease of fluxes in the afternoon due to cloud cover, but the timing of the decrease was too early. At the same time there is large variation of fluxes as indicated by the interquartile difference, so that simulated solar radia-tion flux for all cases appears to be in reasonable agreement with the measured shortwave radiation.
The spatial variability of surface energy fluxes and solar radiation also demonstrates that surface atmosphere interac-tions change with increasing soil moisture. With the onset of cloud development, solar irradiance of shaded grid cells be-gins to drop, while the median irradiance and turbulent sur-face fluxes remain unaffected. With increasing cloud optical depth median shortwave radiation fluxes begin to decrease. This occurs first in the most shaded cells and then progresses to the mean fluxes. For the moister simulations (1–2×FC) there is little difference between lower and upper quartile la-tent heat fluxes in the early afternoon, indicating widespread cloud cover as the main driver for the decrease. However, in the later afternoon, there is again increased variability in the simulated turbulent fluxes (both median and upper quartile) that is not accompanied by a corresponding increase in the median solar irradiation flux. This indicates that in addition to solar irradiance, local circulation systems likely play a role in the surface energy balance. The impact of local circula-tions on the surface energy balance, turbulent fluxes and con-vective triggering was investigated in Gerken et al. (2014).
simu-0 100 200 300 400
500a) PWP b) 0.5xFC
0 200 400 600 800 1000 QH Q
E SWD
0 100 200 300 400
500c) 0.75xFC
Flux [W m
−2
] d) 1.0xFC
0 200 400 600 800 1000
SWD
[W m
−2
]
0 100 200 300 400
500e) 1.5xFC
06:00 09:00 12:00 15:00 18:00 f) 2.0xFC
Local Time
0 200 400 600 800 1000
06:00 09:00 12:00 15:00 18:00 0
100 200 300 400
500g) Measured
[image:8.612.131.468.65.323.2]Local Time
Figure 5. Development of turbulent surface fluxes in the Nam Co Lake basin for cases PWP, 0.5×FC, 0.75×FC, 1.0×FC, 1.5×FC and
2.0×FC on 17 July 2012 (a–e). Thick black lines correspond to the median flux over land. For SWD andQE also the upper and lower
quartiles are given as thin lines, presenting a measure of spatial flux variation. The dashed line is clear-sky SWD; (g) measured turbulent fluxes near Nam Co research station. Thin lines correspond to directly measured eddy-covariance fluxes. Thick lines are energy-balance corrected fluxes according to Twine et al. (2000).
lated and measured fluxes in Fig. 5f and g shows that mea-sured median simulated fluxes in the afternoon are lower than the measured ones, while the maximum fluxes around noon show similar magnitudes. This is likely due to an overestima-tion in the simulated convective development that is caused by the lack of the third dimension and entrainment of dry air into convective thermals. The inherently unclosed nature of turbulent fluxes measured by the eddy-covariance technique (Foken, 2008) introduces an additional degree of uncertainty into the comparison of modelled and measured fluxes. The observed mean of the ground heat flux at the Nam Co sta-tion is of the order of 30 % of net radiasta-tion (Biermann et al., 2014), leaving approx. 30 % of the total surface energy bal-ance unclosed. Using the energy balbal-ance correction of Twine et al. (2000) conserves the observed Bowen ratio, while the recently proposed buoyancy correction according to Charu-chittipan et al. (2014) would attribute most of the unclosed flux to Qh and would thus change the Bowen ratio
con-siderably. The Hybrid surface model was able to reproduce the turbulent flux measurement at the Nam Co station for a wide range of observed soil moisture (Gerken et al., 2012). Additionally, Kracher et al. (2009) showed that many land-surface models tend to reproduce measured Bowen ratios. As a consequence, we assume in this work that the Bowen ratio method of energy balance closure (Twine et al., 2000) is applicable and that there is an overall reasonable
agree-ment between the diurnal evolution of modelled fluxes for the moister surface initialisations and the measured fluxes. 3.3 Soil moisture–evapotranspiration response
Immediately connected to turbulent flux dynamics and of central importance for the hydrological response of the Nam Co Basin is the question of the relationship between soil moisture and evapotranspiration. Figure 6 displays the soil moisture variables for the simulated cases. The first panel shows the development of soil moisture expressed as a func-tion of field capacity for the upper model layer. From Fig. 6 it becomes apparent that evapotranspiration during the day-time has a large effect on modelled soil moisture. The sur-face model Hybrid has a comparatively simple treatment of soil moisture, which includes drainage, molecular diffusion between soil layers for transport and evapotranspiration and precipitation as sources and sinks. While there is a general decreasing tendency of soil moisture during the course of the simulations, precipitation events can replenish the soil with water. In the case of 1.0×FC, afternoon precipitation leads to soil moisture in the upper layer that are slightly larger than the initialised soil moisture and similar to soil moisture as in the moister 1.5×FC case.
0.2 0.4 0.6 0.8 1 1.2 1.4 1.6 1.8
2 a) Soil Moisture
SM / FC [−]
0.5 1 1.5 2 2.5 3
3.5 b) Evapotranspiration
ET [mm]
PWP 0.5xFC 0.75xFC 1.0xFC 1.5xFC 2.0xFC
0.5 1 1.5 2 2.5 3 3.5 4
4.5 c) Potential Evaporation (Hybrid)
ET
p
[mm]
06:00 08:00 10:00 12:00 14:00 16:00 18:00 0.1
0.2 0.3 0.4 0.5 0.6 0.7 0.8
0.9 d) Evaporation from Lake
ENamCo
[mm]
[image:9.612.49.286.64.318.2]Local Time
Figure 6. Moisture variables over time and averaged for Nam
Co Basin for cases PWP, 0.5×FC, 0.75×FC, 1.0×FC, 1.5×FC
and 2.0×FC on 17 July 2012: (a) soil moisture in terms of FC
[–]; (b) integrated evapotranspiration [mm]; (c) integrated poten-tial evaporation [mm] and (d) integrated evaporation from Nam Co Lake [mm].
Indeed, there is a large increase in simulated evapotranspi-ration between cases 0.5×FC and 0.75×FC, demonstrat-ing a soil-moisture-limited regime as discussed in Senevi-ratne et al. (2010). A further doubling of soil moisture to 1.5×FC leads to a similarly big increase in evapotranspi-ration. This increase, however, is no longer true for the case 2.0×FC, which in fact has a lower actual evapotranspira-tion than the 1.5×FC case. Between these two cases, the surface has switched from a moisture-limited regime to a ra-diation limited one due to an additional increase in cloud cover. At the same time, estimated potential evapotranspi-ration peaks for the 1.0×FC case (Fig. 6c). Potential evap-otranspiration, as calculated in Hybrid, is unlike the other quantities not a standard model output and had to be esti-mated with 5 min averaged model outputs, leading to some uncertainties in its magnitude. Nevertheless, it is striking that 1.0×FC has the largest potential evapotranspiration, while 1.5×FC and 2.0×FC as the moistest cases in fact have the lowest. Additionally, for case 1.5×FC actual evapotranspi-ration approaches potential evapotranspievapotranspi-ration. In addition to the transition from a soil moisture-limited to a radiation-limited regime, there is also a feedback evident between soil moisture and convective development, which acts trough the generation of wind, precipitation and the reduction of
in-coming shortwave radiation. This will be further discussed in Sect. 3.4.
There is little variation of evaporation from the lake sur-face between cases and total daytime evaporation is less than 0.5 mm (Fig. 6d) and thus 50 % smaller than evapotranspi-ration from the land surface of even the driest case, high-lighting the role of the land surface as a source of water. Ad-ditionally, the lake does not exhibit a strong diurnal pattern in simulated evaporation. This is in reasonable agreement to Biermann et al. (2014), who did not find a diurnal cycle in the measured lake evaporation.
Figure 7 shows the importance of soil moisture for the en-ergy balance of the Nam Co Basin. Turbulent surface fluxes are integrated over space and time. The surface energy bal-ance on the Tibetan Plateau is of key importbal-ance for un-derstanding hydrological processes. Due to the clean atmo-sphere (i.e. Cong et al., 2009) at Nam Co Lake and its high elevation, the fraction of diffuse to direct radiation is small compared to more polluted environments so that clouds, through modification of the net radiation, have a stronger influence on the surface energy balance than in other re-gions. Soil moisture strongly modifies the partitioning of the available energy into sensible and latent heat, evident in the Bowen ratio, and thus the surface energy balance. We sep-arated the integrated surface energy fluxes into the area of the lake, the non-elevated land around the lake, referred to as plain, the Nam Co Basin, which is defined from the lake to the top of the Nyenchen Thangla and an equal extent on the northern side of the lake. For completeness the whole do-main values are also presented. Overall, sensible heat fluxes from the lake are negligible, while the importance of Nam Co Lake for latent energy fluxes compared with the plain area is very dependent on the initial soil moisture conditions: for the cases PWP and 0.5×FC integrated latent heat fluxes from the lake have almost the same magnitude as the fluxes from the plain area, whereas for the moister cases they are compar-atively small. As a consequence the importance of the lake as a moisture source for the surrounding area decreases with moister environmental conditions.
0 7.5 15 22.5
a) Esens,lake
PWP 0.5xFC 0.75xFC 1.0xFC 1.5xFC 2.0xFC
b) Elat,lake
0 25 50 75 100
c) Esens,plain
[GJ]
d) Elat,plain
0 100 200 300 400
500 e) E
sens,basin f) Elat,basin
06:00 08:00 10:00 12:00 14:00 16:00 18:00 0
250 500 750 1000
g) Esens,tot
Local Time
[GJ]
06:00 08:00 10:00 12:00 14:00 16:00 18:00
h) Elat,tot
[image:10.612.128.466.66.402.2]Local Time
Figure 7. Spatially and temporally integrated turbulent energy fluxes (E) at Nam Co Lake for cases PWP, 0.5×FC, 0.75×FC, 1.0×FC,
1.5×FC and 2.0×FC on 17 July 2012: (a, b) sensible and latent energy over the lake, (c, d) over the plain adjacent to the lake, (e, f) the
Nam Co Basin as defined in the text and (g, h) in total domain.
3.4 Convective development
We investigated the development of locally developed con-vection as it is frequently observed in the Nam Co Lake basin. As discussed in Sect. 3.2 there is a direct interac-tion between soil moisture, Bowen ratio and turbulent sur-face fluxes, which to a large extent drives convective evo-lution. Therefore, differences in convective development are expected for the simulated cases.
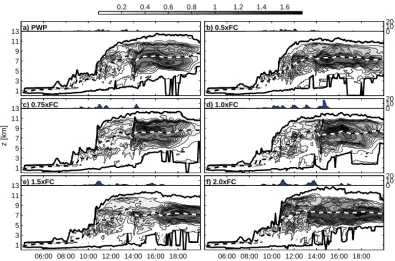
During the course of the day, boundary-layer clouds form-ing at the beginnform-ing of the simulation grow into moist deep convection that produces precipitation in the model domain. Figure 8 displays the simulated averaged cloud liquid wa-ter concentration, as well as Zc, cloud base and cloud top height. While all simulations lead to the development of deep convection, there are some differences in the amount of generated convection, the convective timing and dynam-ics as well as deposited precipitation (Sect. 3.5). The drier PWP and 0.5×FC cases show only limited or isolated con-vection before solar noon and then some deeper concon-vection around 14:00 LT, which does not lead to strong
precipita-tion. Cases 0.75×FC and 1.0×FC on the other hand have a slightly stronger and earlier triggering of convection and then a stronger release of convective energy in the afternoon that is accompanied by a distinct precipitation event. The moistest simulations (cases 1.5×FC and 2.0×FC) have a stronger cloud development before noon and then lack a strong con-vective triggering in the afternoon.
These three regimes become especially visible, when analysing the convective mass fluxMcdefined as the product of moist density (ρ) and vertical velocity (w) integrated for a given heightz:
Mc(z)= Z
ρwdA, (2)
1 3 5 7 9 11
13a) PWP
0.2 0.4 0.6 0.8 1 1.2 1.4 1.6
b) 0.5xFC 01020
1 3 5 7 9 11
13c) 0.75xFC
z [km]
d) 1.0xFC
0 10 20
Prec [g m
−2]
06:00 08:00 10:00 12:00 14:00 16:00 18:00 1
3 5 7 9 11
13e) 1.5xFC
Local Time
06:00 08:00 10:00 12:00 14:00 16:00 18:00 f) 2.0xFC
Local Time
[image:11.612.102.498.65.326.2]0 10 20
Figure 8. Modelled development of convection at Nam Co Lake for cases PWP, 0.5×FC, 0.75×FC, 1.0×FC, 1.5×FC and 2.0×FC
on 17 July 2012: contours correspond to mean cloud water equivalent concentrations in the Nam Co Lake basin [g m−3]. The dashed line
indicates the height of the centre of cloud mass (Zc) and black lines indicate cloud top and cloud bottom heights. The upper panel of each
subplot indicates mean deposited precipitation within each 5 min interval [g m−2].
smaller than the reduction of buoyancy by the entrainment of dry air. Overall, there is little difference in Mc at 3 km between the cases, but the dry cases lack the moisture for a subsequent release of latent energy and strong convection in the afternoon. It should be noted that the initial profile is quite moist for the lowermost 3 km, but then there is a dry zone between 3 and 6 km a.g.l. The equivalent potential tem-perature profile (θe) reveals a predisposition for convection. Hence, comparatively largeQEfluxes are necessary to
pro-vide the atmosphere with sufficient moisture for the develop-ment of convection and the release of latent heat. At the same time, the moister simulations also do not develop strong deep convection, as they have the smallest convective mass flux at 3 km around 14:00 LT. This means that the cloud cover dis-played in Fig. 8e and f develops earlier and is not associated with strong convective motion. At the same time, the cloud base height decreases with increasing moisture as more water vapour accumulates in the boundary layer, which is consis-tent with the investigation by Golaz et al. (2001) and Yamada (2008), who also found a decreased buoyancy for their wet surface case. Furthermore, for the intermediate cases, local differences in precipitation affect surface moisture and po-tentially induce circulations that lead to additional convec-tion triggering (Clark et al., 2004).
An analysis of convective available potential en-ergy (CAPE) tells a similar story (Fig. 10). After sunrise,
simulated CAPE values in the Nam Co start to diverge be-tween cases due to differences in the surface energy bal-ance. Cases PWP and 0.75×FC develop the least amount of CAPE, which is fully released between 09:00 and 14:00 LT. The moistest cases in contrast develop the largest amounts of CAPE, but it is not fully released as high soil moisture and associated lack of sensible heat fluxes reduce convec-tion development. Consequently, CAPE is exported from the basin. Cases 0.75×FC and 1.0×FC present an intermedi-ate, for which there is ample development of CAPE, which is almost fully depleted by convection during the afternoon, so that they have the highest overall release of CAPE.
Overall, there are three different regimes of convective de-velopment in the simulations for Nam Co Lake that are asso-ciated with soil moisture. Convective development requires the availability of moisture and vertical instability through surface heating, and these conditions are best met for the in-termediate moisture cases, while the drier cases do not pro-vide a strong enough moistening and the moister cases inhibit the development of vertical motion due to increase cloud cover and lack of surface heating.
Ti-10
20 a) PWP z = 3 km b) z = 5 km
10 20
c) z = 7 km
10
20 d) 0.5xFC e)
10 20 f)
10
20 g) 0.75xFC
Mc
[Mg m
−1
s
−1
]
h)
10 20 i)
Mc
[Mg m
−1
s
−1
]
10
20 j) 1.0xFC k)
10 20 l)
10
20 m) 1.5xFC n)
10 20 o)
06:00 09:00 12:00 15:00 18:00 10
20 p) 2.0xFC
Local Time
06:00 09:00 12:00 15:00 18:00 q)
Local Time
06:00 09:00 12:00 15:00 18:00 10 20 r)
[image:12.612.70.522.65.383.2]Local Time
Figure 9. Convective mass flux at 3, 5 and 7 km a.g.l. for cases PWP, 0.5×FC, 0.75×FC, 1.0×FC, 1.5×FC and 2.0×FC on 17 July 2012.
Local Time
06:00 09:00 12:00 15:00 18:00
CAPE [J kg
-1
]
0 200 400 600 800 1000 1200
PWP
0.5xFC
0.75xFC
1.0xFC
1.5xFC
2.0xFC
Figure 10. Temporal development of simulated Convective
Avail-able Potential Energy (CAPE, [J kg−1]) within the Nam Co Lake
basin for cases PWP, 0.5×FC, 0.75×FC, 1.0×FC, 1.5×FC and
2.0×FC on 17 July 2012.
betan valleys (e.g. Kurita and Yamada, 2008; Ueno et al., 2009). In addition to precipitation from mesoscale convec-tive systems there are two types of locally developed pre-cipitation: (1) daytime isolated convection triggered over the mountain chains or, in the case of Nam Co Lake, at the colli-sion front between the lake breeze and the geostrophic wind
(Gerken et al., 2013a) and (2) convergence in the centre of the valleys through thermal circulations leading to night-time precipitation. Due to the nature of our study, we only discuss the effects of locally generated, daytime precipitation.
As was demonstrated in Sect. 3.3 locally generated precip-itation has a large influence on the availability of soil mois-ture and thus on surface fluxes. This is of special importance since potential evaporation rates of approx. 4 mm day−1are of similar magnitude to the water that is stored in the up-permost 10 cm of the soil at field capacity. Actual evapo-ration rates for a Kobresia meadow were measured at 2 to 6 mm day−1 (Babel et al., 2014). Therefore, the water bal-ance of the Nam Co Basin and the regional transport of wa-ter vapour are of importance. Due to the simple Kessler-type microphysics used in this study, the actual precipitation rates only allow for a qualitative comparison between cases.
[image:12.612.51.285.425.571.2]Table 2. Total simulated deposited precipitation (Prec, [g m−2]) and normalised by evapotranspiration (Prec/ET [–]) for cases PWP, 0.5×FC,
0.75×FC, 1.0×FC, 1.5×FC and 2.0×FC on 17 July 2012 for lake area, the plain adjacent to lake, the Nam Co Basin as defined in the
text and the total domain. The area definitions are the same as those used in Fig. 7.
Case Lake Plain Basin Domain
Prec Prec/ET Prec Prec/ET Prec Prec/ET Prec Prec/ET
[g m−2] [−] [g m−2] [−] [g m−2] [−] [g m−2] [−]
PWP 6 0.01 115 0.09 103 0.10 65 0.06
0.5×FC 5 0.01 81 0.06 154 0.13 74 0.06
0.75×FC 55 0.11 224 0.11 194 0.12 103 0.06
1.0×FC 40 0.08 244 0.12 393 0.24 204 0.10
1.5×FC 47 0.09 315 0.11 176 0.09 153 0.06
2.0×FC 216 0.44 355 0.14 271 0.15 201 0.08
Table 3. Total integrated moisture flux (Fq) into Nam Co Lake basin between 06:00 and 16:00 BST. The control domains denoted with subscripts A and B are indicated in Fig. 11g. The subscripts Nw, Se stand for the north-west and south-east boundaries. Positive fluxes across
the lateral boundaries indicate flux into the domain. ET andPare the evapotranspiration and precipitation flux; 3 and 10 indicate the vertical
boundaries of the control volumes, with a negative sign for upward flux.1qtotis the total net moisture flux for a volume.
Domain A
Domain B
Case Fq,ANw Fq,ASe Fq,ET Fq,P Fq,3 Fq,10 Fq,BNw Fq,BSe 1qtot,A 1qtot,B
[Mg] [Mg] [Mg] [Mg]
PWP 1351.8 −1382.4 51.4 −5.2 99.3 −2.3 244.3 −332.1 −83.7 9.2
0.5×FC 1367.1 −1360.9 57.6 −7.8 128.4 −3.9 279.4 −350.3 −72.4 53.6
0.75×FC 1473.4 −1449.0 79.4 −9.8 166.3 −9.5 181.7 −332.8 −72.4 5.7
1.0×FC 1438.7 −1438.0 81.9 −19.9 167.1 −0.1 256.0 −372.8 −104.4 50.1
1.5×FC 1432.8 −1430.0 103.2 −8.9 124.7 −3.4 324.2 −355.6 −27.6 89.9
2.0×FC 1422.6 −1417.0 90.5 −13.7 129.7 −6.5 334.8 −366.4 −47.3 91.6
largest spread with 1 to 44 % of recycled water. In general, the lake surface receives comparatively less precipitation per area than the rest of the basin, which is in line with expecta-tions, as a cool water body suppresses convective activity. We observe increasing precipitation with increasing soil mois-ture. This trend is most clear for the driest cases, while it becomes less apparent for the moistest cases. This is in ac-cordance with the observations of convective activity, which are strongest for intermediate initial soil moisture. Addition-ally, the basin and the plain are over-represented in terms of deposited precipitation in comparison to the total domain.
A closer investigation into the moisture budget of the Nam Co Lake basin (Fig. 11) further points to the importance of vertical moisture transport within the region. We define two control domains for the Nam Co Basin: control domain A corresponds to the lowermost 3 km a.g.l., while control do-main B is located directly above and extends to 10 km. The horizontal extent of the control domains is from the centre of the model domain to the top of the Nyenchen Thangla mountain chain and a similar extent to the north-west (see also Fig. 11g for illustration). It becomes apparent that the vertical transport of moisture dominates the overall
[image:13.612.85.509.297.431.2]Figure 11. Instantaneous moisture flux fq [kg m−1s−1] for Nam Co Lake basin. (a, c, e) Moisture transport into control volume A, as
indicated in (g) of this figure, representing the Nam Co Basin up to 3 km a.g.l.: evapotranspiration (blue); precipitation (cyan); net horizontal flux (black); net vertical flux (red); and resulting total flux (grey, dashed). The precipitation flux is not displayed as it is of negligible magnitude. (b, d, f) Transport into the mid-tropospheric control volume B with the same horizontal extent and from 3 to 10 km vertical extent; (g) is a schematic drawing of the control volumes.
upper level wind speeds used in this work are unrealistically low, so that under realistic conditions one would expect an even faster transport of moisture from the basin to the sur-rounding area. Recent work by Froidevaux et al. (2013) in-vestigated the importance of background wind speeds and horizontal transport of convective cells during their devel-opment. While wind speeds used in this work were lower than observed, the lake–land circulation (i.e. Gerken et al., 2014) provides the necessary horizontal propagation mecha-nism that allows for the development of convective cells.
4 Conclusions
In this work we have used the high-resolution atmospheric model ATHAM, coupled with the Hybrid surface model, to investigate the influence of soil moisture on convective devel-opment in the Nam Co Lake area. Surface moisture and, thus, turbulent fluxes are highly variable on the Tibetan Plateau
and, therefore, not only are important for the Bowen ratio and the surface energy balance, but also have an effect on atmospheric dynamics.
It was established in this work as well as in previous stud-ies that the modelling system used in this investigation is a sensible and cost-effective approach for the most impor-tant processes with regard to surface–atmosphere interac-tions, the evolution from boundary-layer clouds to deep and moist convection, and its interaction with background winds and complex topography.
Nam Co station. There is a feedback between surface fluxes, cloud cover and convection. Larger latent heat fluxes lead to increased cloud cover and consequently to smaller net sur-face radiation. This is seen in the simulated evapotranspira-tion. The surface changes from a water limited to a radiation-limited evapotranspiration regime, so that increased moisture actually means smaller net surface radiation. The role of the lake as a source of moisture depends on the initial surface moisture. Latent heat fluxes from the lake have a substan-tial contribution to the overall water budget of the basin only for very dry land surfaces. Our research clearly demonstrates the importance of soil moisture for the overall surface en-ergy balance of the lake system and thus for potentially wider implications for the Tibetan Plateau’s energy balance as a whole.
We subsequently investigated convective development and convective mass fluxes and found a “convective optimum” for the Nam Co Lake basin at intermediate soil moisture. At small soil moisture there is insufficient moisture available for latent heat release, which drives convection in the condition-ally unstable Tibetan atmosphere. At very high soil moisture there is increased cloud cover, small sensible heat fluxes and decreased vertical motion. So while precipitation does occur, there is little convective development.
This has implications for the moisture budget of the Nam Co Basin. We found that the basin itself and especially the plain and the mountains are a preferential area for precipita-tion so that weather staprecipita-tions close to the lake are not repre-sentative for the entire basin. At the same time vertical trans-port of moisture through convection and the subsequent lat-eral transport with the background wind, may be an impor-tant water source for the larger region. Overall, precipitation effects can be directly seen in the soil moisture response of the coupled model and thus have an influence on turbulent fluxes, convective development and the surface energy bal-ance. As precipitation events are both small in scale and short in duration, it is extremely important to get a good represen-tation of regional precipirepresen-tation in time as well as location. This requires mesoscale models at the appropriate resolu-tions of the order of a few hundred metres. Additionally, both Hohenegger et al. (2009) and our previous work (Gerken et al., 2013a) highlight the importance of atmospheric pro-files, through stability and convective inhibition, in the trig-gering of convection. This demonstrates a further need for accurate high-resolution data sets for soil and atmospheric data.
As current environmental impacts, such as climate change and land use change, not only are expected to impact surface cover and soil moisture, but also it is important to assess how these changes will affect convective development and thus the hydrological cycle on the Tibetan Plateau.
Acknowledgements. This research was funded by the German
Research Foundation (DFG) Priority Programme 1372 “Ti-betan Plateau: Formation, Climate, Ecosystems” as part of the Atmosphere–Ecology–Glaciology–Cluster (TiP-AEG): FO 226/18-1,2. The work described in this publication has been supported by the European Commission (Call FP7-ENV-2007-1 grant no. 212921) as part of the CEOP-AEGIS project coordinated by the University of Strasbourg. The map of Nam Co was produced by Sophie Biskop (University of Jena) and Jan Kropacek (University of Tübingen) within DFG-TiP and Phil Stickler of the Cambridge Geography Department Cartography Unit. This publication was funded by the German Research Foundation (DFG) and the University of Bayreuth in the funding programme Open-Access Publishing.
Edited by: A. Loew
References
Babel, W., Biermann, T., Coners, H., Falge, E., Seeber, E., In-grisch, J., Schleuß, P.-M., Gerken, T., Leonbacher, J., Leipold, T., Willinghöfer, S., Schützenmeister, K., Shibistova, O., Becker, L., Hafner, S., Spielvogel, S., Li, X., Xu, X., Sun, Y., Zhang, L., Yang, Y., Ma, Y., Wesche, K., Graf, H.-F., Leuschner, C., Guggenberger, G., Kuzyakov, Y., Miehe, G., and Foken, T.: Pasture degradation modifies the water and carbon cycles of the Tibetan highlands, Biogeosciences, 11, 6633–6656, doi:10.5194/bg-11-6633-2014, 2014.
Banta, R. M. and Barker Schaaf, C.: Thunderstorm Gene-sis Zones in the Colorado Rocky Mountains as deter-mined by traceback of geosynchronous satellite Images,
Mon. Weather Rev., 115, 463–476,
doi:10.1175/1520-0493(1987)115<0463:TGZITC>2.0.CO;2, 1987.
Barthlott, C., Hauck, C., Schädler, G., Kalthoff, N., and Kottmeier, C.: Soil moisture impacts on convective indices and precipitation over complex terrain, Meteorol. Z., 20, 185–197, doi:10.1127/0941-2948/2011/0216, 2011.
Biermann, T., Babel, W., Olesch, J., and Foken, T.: Mesoscale Cir-culations and Energy and Gas Exchange over the Tibetan Plateau – Documentation of the Micrometeorological Experiment, Nam Tso, Tibet, 25 June–8 August 2009, Arbeitsergebnisse 41, Uni-versity of Bayreuth, Bayreuth, 2009.
Biermann, T., Babel, W., Ma, W., Chen, X., Thiem, E., Ma, Y., and Foken, T.: Turbulent flux observations and modelling over a shallow lake and a wet grassland in the Nam Co basin, Tibetan Plateau, Theor. Appl. Climatol., 116, 301–316, doi:10.1007/s00704-013-0953-6, 2014.
Boos, W. R. and Kuang, Z.: Dominant control of the South Asian monsoon by orographic insulation versus plateau heating, Na-ture, 463, 218–222, doi:10.1038/nature08707, 2010.
Charuchittipan, D., Babel, W., Mauder, M., Leps, J.-P., and Fo-ken, T.: Extension of the averaging time of the eddy-covariance measurement and its effect on the energy balance closure, Bound.-Lay. Meteorol., 152, 303–327, doi:10.1007/s10546-014-9922-6, 2014.
throughout the Qinghai–Tibetan Plateau from 1982 to 2011, Agr. Forest Meteorol., 189–190, 81–90, 2014.
Cheng, W. Y. Y. and Cotton, W. R.: Sensitivity of a Cloud-Resolving Simulation of the Genesis of a Mesoscale Convec-tive System to Horizontal Heterogeneities in Soil Moisture Ini-tialization, J. Hydrometeorol., 5, 934–958, doi:10.1175/1525-7541(2004)005<0934:SOACSO>2.0.CO;2, 2004.
Cheng, G. and Wu, T.: Responses of permafrost to climate change and their environmental significance, Qinghai-Tibet Plateau, J. Geophys. Res., 112, F02S03, doi:10.1029/2006JF000631, 2007. Clark, D. B., Taylor, C. M., and Thorpe, A. J.: Feedback between the land surface and rainfall at convective length scales, J. Hydrometeorol., 5, 625–639, doi:10.1175/1525-7541(2004)005<0625:FBTLSA>2.0.CO;2, 2004.
Cong, Z., Kang, S., Smirnov, A., and Holben, B.: Aerosol optical properties at Nam Co, a remote site in central Tibetan Plateau, Atmos. Res., 92, 42–48, doi:10.1016/j.atmosres.2008.08.005, 2009.
Cui, X. and Graf, H.-F.: Recent land cover changes on the Tibetan Plateau: a review, Climatic Change, 94, 47–61, doi:10.1007/s10584-009-9556-8, 2009.
Cui, X., Graf, H.-F., Langmann, B., Chen, W., and Huang, R.: Climate impacts of anthropogenic land use changes on the Tibetan Plateau, Global Planet. Change, 54, 33–56, doi:10.1016/j.gloplacha.2005.07.006, 2006.
Fairall, C. W., Bradley, E. F., Godfrey, J. S., Wick, G. A., Ed-son, J. B., and Young, G. S.: Cool-skin and warm-layer effects on sea surface temperature, J. Geophys. Res., 101, 1295–1308, 1996a.
Fairall, C. W., Bradley, E. F., Rogers, D. P., Edson, J. B., and Young, G. S.: Bulk parameterization of air–sea fluxes for Tropi-cal Ocean-Global Atmosphere Coupled-Ocean Atmosphere Re-sponse Experiment, J. Geophys. Res., 101, 3747–3764, 1996b. Fischer, E. M., Seneviratne, S. I., Vidale, P. L., Lüthi, D., and
Schär, C.: Soil moisture–atmosphere interactions during the 2003 European summer heat wave, J. Climate, 20, 5081–5099, doi:10.1175/JCLI4288.1, 2007.
Flohn, H.: Hochgebirge und allgemeine Zirkulation, Arch. Meteor. Geophy. A, 5, 265–279, doi:10.1007/BF02247771, 1952. Foken, T.: The energy balance closure problem: an overview, Ecol.
Appl., 18, 1351–1367, 2008.
Foken, T. and Falke, H.: Technical Note: Calibration device for the krypton hygrometer KH20, Atmos. Meas. Tech., 5, 1861–1867, doi:10.5194/amt-5-1861-2012, 2012.
Foken, T., Aubinet, M., Finnigan, J. J., Leclerc, M. Y., Mauder, M., and Paw, U. K. T.: Results of a panel discussion about the en-ergy balance closure correction for trace gases, B. Am. Meteorol. Soc., 92, ES13–ES18, doi:10.1175/2011BAMS3130.1, 2011. Foken, T., Leuning, R., Oncley, S. R., Mauder, M., and Aubinet, M.:
Corrections and data quality control, in: Eddy Covariance, edited by: Aubinet, M., Vesala, T., and Papale, D., Springer Atmo-spheric Sciences, Springer, Dordrecht, 85–131, doi:10.1007/978-94-007-2351-1_4, 2012.
Friend, A. D. and Kiang, N. Y.: Land surface model devel-opment for the GISS GCM: effects of improved canopy physiology on simulated climate, J. Climate, 18, 2883–2902, doi:10.1175/JCLI3425.1, 2005.
Friend, A. D., Stevens, A. K., Knox, R. G., and Can-nell, M. G. R.: A process-based, terrestrial biosphere model of
ecosystem dynamics (Hybrid v3.0), Ecol. Model., 95, 249–287, doi:10.1016/S0304-3800(96)00034-8, 1997.
Froidevaux, P., Schlemmer, L., Schmidli, J., Langhans, W., and Schär, C.: Influence of the background wind on the local soil moisture-precipitation feedback, J. Atmos. Sci., 71, 782–799, doi:10.1175/JAS-D-13-0180.1, 2013.
Gao, Y.-X., Tang, M.-C., Luo, S.-W., Shen, Z.-B., and Li, C.: Some aspects of recent research on the Qinghai-Xizang Plateau Mete-orology, B. Am. Meteorol. Soc., 62, 31–35, doi:10.1175/1520-0477(1981)062<0031:SAORRO>2.0.CO;2, 1981.
Garcia-Carreras, L., Parker, D. J., Taylor, C. M., Reeves, C. E., and Murphy, J. G.: Impact of mesoscale vegetation hetero-geneities on the dynamical and thermodynamic properties of the planetary boundary layer, J. Geophys. Res., 115, D03102, doi:10.1029/2009JD012811, 2010.
Garcia-Carreras, L., Parker, D. J., and Marsham, J. H.: What is the mechanism for the modification of convective cloud distributions by land surface-induced flows?, J. Atmos. Sci., 68, 619–634, doi:10.1175/2010JAS3604.1, 2011.
Gerken, T., Babel, W., Hoffmann, A., Biermann, T., Herzog, M., Friend, A. D., Li, M., Ma, Y., Foken, T., and Graf, H.-F.: Tur-bulent flux modelling with a simple 2-layer soil model and ex-trapolated surface temperature applied at Nam Co Lake basin on the Tibetan Plateau, Hydrol. Earth Syst. Sci., 16, 1095–1110, doi:10.5194/hess-16-1095-2012, 2012.
Gerken, T., Babel, W., Sun, F., Herzog, M., Ma, Y., Foken, T., and Graf, H.-F.: Uncertainty in atmospheric profiles and the impact on modeled convection development at Nam Co Lake, Tibetan Plateau, J. Geophys. Res., 118, 12317–12331, doi:10.1002/2013JD020647, 2013a.
Gerken, T., Fuchs, K., and Babel, W.: Documentation of the At-mospheric Boundary Layer Experiment, Nam Tso, Tibet 8 July– 8 August 2012, Arbeitsergebnisse 53, University of Bayreuth, Bayreuth, 2013b.
Gerken, T., Biermann, T., Babel, W., Herzog, M., Ma, Y., Fo-ken, T., and Graf, H.-F.: A modelling investigation into lake-breeze development and convection triggering in the Nam Co Lake basin, Tibetan Plateau, Theor. Appl. Climatol., 117, 149– 167, doi:10.1007/s00704-013-0987-9, 2014.
Gochis, D. J., Jimenez, A., Watts, C. J., Garatuza-Payan, J., and Shuttleworth, W. J.: Analysis of 2002 and 2003 warm-season precipitation from the North American Monsoon Experiment Event Rain Gauge Network, Mon. Weather Rev., 132, 2938– 2953, doi:10.1175/MWR2838.1, 2004.
Golaz, J.-C., Jiang, H., and Cotton, W. R.: A large-eddy sim-ulation study of cumulus clouds over land and sensitivity to soil moisture, Atmos. Res., 59–60, 373–392, doi:10.1016/S0169-8095(01)00113-2, 2001.
Graf, H.-F., Herzog, M., Oberhuber, J. M., and Textor, C.: Effect of environmental conditions on volcanic plume rise, J. Geophys. Res., 104, 24309–24320, doi:10.1029/1999JD900498, 1999. Guo, H., Penner, J., and Herzog, M.: Comparison of the vertical
velocity used to calculate the cloud droplet number concentra-tion in a cloud-resolving and a global climate model, in: Four-teenth ARM Science Team Meeting Proceedings, edited by: Car-rothers, D., Department of Energy, Boston, 1–6, 2004.
Scient. Onl. Lett. Atmos., 5, 172–175, doi:10.2151/sola.2009-044, 2009.
Hauck, C., Barthlott, C., Krauss, L., and Kalthoff, N.: Soil mois-ture variability and its influence on convective precipitation over complex terrain, Q. J. Roy. Meteorol. Soc., 137, 42–56, doi:10.1002/qj.766, 2011.
Herzog, M., Graf, H.-F., Textor, C., and Oberhuber, J. M.: The ef-fect of phase changes of water on the development of volcanic plumes, J. Volcanol. Geoth. Res., 87, 55–74, doi:10.1016/S0377-0273(98)00100-0, 1998.
Herzog, M., Oberhuber, J. M., and Graf, H.-F.: A prognos-tic turbulence scheme for the nonhydrostaprognos-tic plume model ATHAM, J. Atmos. Sci., 60, 2783–2796, doi:10.1175/1520-0469(2003)060<2783:APTSFT>2.0.CO;2, 2003.
Hohenegger, C., Brockhaus, P., Bretherton, C. S., and Schär, C.: The soil moisture–precipitation feedback in simulations with ex-plicit and parameterized convection, J. Climate, 22, 5003–5020, doi:10.1175/2009JCLI2604.1, 2009.
Immerzeel, W. W., van Beek, L. P. H., and Bierkens, M. F. P.: Cli-mate change will affect the Asian water towers, Science, 328, 1382–1385, doi:10.1126/science.1183188, 2010.
Kang, S., Xu, Y., You, Q., Flügel, W.-A., Pepin, N., and Yao, T.: Review of climate and cryospheric change in the Tibetan Plateau, Environ. Res. Lett., 5, 015101, doi:10.1088/1748-9326/5/1/015101, 2010.
Kirshbaum, D. J.: Cloud-resolving simulations of deep convec-tion over a heated mountain, J. Atmos. Sci., 68, 361–378, doi:10.1175/2010JAS3642.1, 2011.
Kirshbaum, D. J. and Durran, D. R.: Factors governing cellular con-vection in orographic precipitation, J. Atmos. Sci., 61, 682–698, doi:10.1175/1520-0469(2004)061<0682:FGCCIO>2.0.CO;2, 2004.
Kracher, D., Mengelkamp, H.-T., and Foken, T.: The residual of the energy balance closure and its influence on the results of three SVAT models, Meteorol. Z., 18, 647–661, doi:10.1127/0941-2948/2009/0412, 2009.
Kurita, N. and Yamada, H.: The role of local moisture recycling evaluated using stable isotope data from over the middle of the Tibetan Plateau during the monsoon season, J. Hydrometeorol., 9, 760–775, doi:10.1175/2007JHM945.1, 2008.
Kurosaki, Y. and Kimura, F.: Relationship between topography and daytime cloud activity around Tibetan Plateau, J. Meteorol. Soc. Jpn., 80, 1339–1355, 2002.
Kuwagata, T., Numaguti, A., and Endo, N.: Diurnal variation of wa-ter vapor over the central Tibetan Plateau during summer, J. Me-teorol. Soc. Jpn., 79, 401–418, doi:10.2151/jmsj.79.401, 2001. Langmann, B., Herzog, M., and Graf, H.-F.: Radiative forcing of
climate by sulfate aerosols as determined by a regional circula-tion chemistry transport model, Atmos. Environ., 32, 2757–2768, doi:10.1016/S1352-2310(98)00028-4, 1998.
Li, M., Ma, Y., Hu, Z., Ishikawa, H., and Oku, Y.: Snow distri-bution over the Namco lake area of the Tibetan Plateau, Hy-drol. Earth Syst. Sci., 13, 2023–2030, doi:10.5194/hess-13-2023-2009, 2009.
Liang, X.-Z. and Wang, W.-C.: Associations between China mon-soon rainfall and tropospheric jets, Q. J. Roy. Meteorol. Soc., 124, 2597–2623, doi:10.1002/qj.49712455204, 1998.
Liu, J., Kang, S., Gong, T., and Lu, A.: Growth of a high-elevation large inland lake, associated with climate change and permafrost
degradation in Tibet, Hydrol. Earth Syst. Sci., 14, 481–489, doi:10.5194/hess-14-481-2010, 2010.
Ma, Y., Wang, Y., Wu, R., Hu, Z., Yang, K., Li, M., Ma, W., Zhong, L., Sun, F., Chen, X., Zhu, Z., Wang, S., and Ishikawa, H.: Recent advances on the study of atmosphere–land interaction ob-servations on the Tibetan Plateau, Hydrol. Earth Syst. Sci., 13, 1103–1111, doi:10.5194/hess-13-1103-2009, 2009.
Mauder, M. and Foken, T.: Documentation and instruction man-ual of the eddy covariance software package TK2, Arbeitsergeb-nisse 26, University of Bayreuth, Bayreuth, 2004.
Mauder, M. and Foken, T.: Documentation and Instruction Manual of the Eddy-Covariance Software Package TK3, Arbeitsergeb-nisse 46, University of Bayreuth, Bayreuth, 2011.
Maussion, F., Scherer, D., Finkelnburg, R., Richters, J., Yang, W., and Yao, T.: WRF simulation of a precipitation event over the Tibetan Plateau, China – an assessment using remote sensing and ground observations, Hydrol. Earth Syst. Sci., 15, 1795–1817, doi:10.5194/hess-15-1795-2011, 2011.
Maussion, F., Scherer, D., Mölg, T., Collier, E., Curio, J., and Finkelnburg, R.: Precipitation seasonality and variability over the tibetan plateau as resolved by the High Asia Reanalysis, J. Cli-mate, 27, 1910–1927, doi:10.1175/JCLI-D-13-00282.1, 2014. Mlawer, E. J., Taubman, S. J., Brown, P. D., Iacono, M. J.,
and Clough, S. A.: Radiative transfer for
inhomoge-neous atmospheres: RRTM, a validated correlated-k model for the longwave, J. Geophys. Res., 102, 16663–16682, doi:10.1029/97JD00237, 1997.
Molnar, P., Boos, W. R., and Battisti, D. S.: Orographic controls on climate and paleoclimate of Asia: thermal and mechanical roles for the Tibetan Plateau, Annu. Rev. Earth Pl. Sc., 38, 77–102, doi:10.1146/annurev-earth-040809-152456, 2010.
Mügler, I., Gleixner, G., Günther, F., Mäusbacher, R., Daut, G., Schütt, B., Berking, J., Schwalb, A., Schwark, L., Xu, B., Yao, T., Zhu, L., and Yi, C.: A multi-proxy approach to reconstruct hydro-logical changes and Holocene climate development of Nam Co, Central Tibet, J. Paleolimnol., 43, 625–648, doi:10.1007/s10933-009-9357-0, 2010.
Ni, J.: Impacts of climate change on Chinese ecosystems: key vul-nerable regions and potential thresholds, Reg. Environ. Change, 11, 49–64, doi:10.1007/s10113-010-0170-0, 2011.
Oberhuber, J. M., Herzog, M., Graf, H.-F., and Schwanke, K.: Vol-canic plume simulation on large scales, J. Volcanol. Geoth. Res., 87, 29–53, doi:10.1016/S0377-0273(98)00099-7, 1998. Pal, J. S. and Eltahir, E. A. B.: Pathways relating soil
mois-ture conditions to fumois-ture summer rainfall within a model of the land–atmosphere system, J. Climate, 14, 1227–1242, doi:10.1175/1520-0442(2001)014<1227:PRSMCT>2.0.CO;2, 2001.
Pan, Z., Takle, E., Segal, M., and Turner, R.: Influences of model parameterization schemes on the response of rainfall to soil moisture in the central United States, Mon. Weather Rev., 124, 1786–1802, doi:10.1175/1520-0493(1996)124<1786:IOMPSO>2.0.CO;2, 1996.
Patton, E. G., Sullivan, P. P., and Moeng, C.-H.: The influence of idealized heterogeneity on wet and dry planetary boundary lay-ers coupled to the land surface, J. Atmos. Sci., 62, 2078–2097, doi:10.1175/JAS3465.1, 2005.


![Figure 6. Moisture variables over time and averaged for Namand 2.0[–];tial evaporation [mm] andCo Basin for cases PWP, 0.5 × FC, 0.75 × FC, 1.0 × FC, 1.5 × FC × FC on 17 July 2012: (a) soil moisture in terms of FC (b) integrated evapotranspiration [mm]; (c) integrated poten- (d) integrated evaporation from Nam CoLake [mm].](https://thumb-us.123doks.com/thumbv2/123dok_us/9255327.994183/9.612.49.286.64.318/moisture-variables-evaporation-integrated-evapotranspiration-integrated-integrated-evaporation.webp)

![Figure 10. Temporal development of simulated Convective Avail-2.0able Potential Energy (CAPE, [J kg−1]) within the Nam Co Lakebasin for cases PWP, 0.5 × FC, 0.75 × FC, 1.0 × FC, 1.5 × FC and × FC on 17 July 2012.](https://thumb-us.123doks.com/thumbv2/123dok_us/9255327.994183/12.612.70.522.65.383/figure-temporal-development-simulated-convective-potential-energy-lakebasin.webp)
