www.hydrol-earth-syst-sci.net/19/4307/2015/ doi:10.5194/hess-19-4307-2015
© Author(s) 2015. CC Attribution 3.0 License.
Historical changes in frequency of extreme floods in Prague
L. Elleder
Czech Hydrometeorological Institute, Prague, Czech Republic
Correspondence to: L. Elleder ([email protected])
Received: 22 December 2014 – Published in Hydrol. Earth Syst. Sci. Discuss.: 4 February 2015 Revised: 31 July 2015 – Accepted: 9 September 2015 – Published: 23 October 2015
Abstract. This study presents a flood frequency analysis for the Vltava River catchment using a major profile in Prague. The estimates of peak discharges for the pre-instrumental period of 1118–1824 based on documentary sources were carried out using different approaches. 187 flood peak dis-charges derived for the pre-instrumental period augmented 150 records for the instrumental period of 1825–2013. Flood selection was based onQ10criteria. Six flood-rich periods in total were identified for 1118–2013. Results of this study cor-respond with similar studies published earlier for some cen-tral European catchments, except for the period around 1750. Presented results indicate that the territory of the present Czech Republic might have experienced extreme floods in the past, comparable – with regard to peak discharge (higher than or equal to Q10) and frequency – to the flood events recorded recently.
1 Introduction
Research of historic floods significantly enhances our abil-ity to better understand the behaviour of recent flood events in the context of global environmental change. Numerous studies have focused on this issue in the last 2 decades (e.g., Brázdil et al., 2006b; Glaser et al., 2010). The augmenta-tion of systematic hydrological series by interpreted historic records to provide a better and more accurate estimation of hydrological parameters is an important task. Flood fre-quency analysis (FFA) appears to be a real challenge, par-ticularly for limited data sets as indicated for example by Mudelsee et al. (2003) and Stedinger and Cohn (1986). In this study, the estimated flood discharges are used for identi-fication of flood-rich periods.
In the Czech Republic, four extreme summer floods were recorded within the last 15 years (1997, 2002, 2010, and 2013). Two of these were classified as 500-year or even 1000-year events (Blöschl et al., 2013; Hladný et al., 2004); two out of the four stroke the Vltava River catchment. Taking into account the entire region of central Europe, further ex-treme summer floods can be added: in the Alps in 2005, and in Slovakia and Poland in 2010. An interesting question thus emerges as to whether there is an analogy with a similar fre-quency of important or extreme floods in the past. The aim of this contribution is to answer two scientific questions:
1. Has the territory of the present Czech Republic experi-enced four summer extreme flood events within a mere 15-year period earlier in history?
Table 1. Important data on floods in the Elbe catchment. Values for major profiles are in bold.
Water gauge Brandýs n. L. C. Budˇejoviceˇ Beroun Písek Praha Dˇeˇcín
River Elbe Vltava Berounka Otava Vltava Elbe
A [km2] 13 109 2850 8286 2913 26 730 51 104
Qa[m3s−1] 99 27.6 35.6 201 145 309
Q2[m3s−1] 572 572 403 300 1220 1720
Q5[m3s−1] 754 350 615 300 1770 2300
Q10[m3s−1] 895 452 799 394 2230 2760
Q50[m3s−1] 1230 751 1310 680 3440 3900
Q100[m3s−1] 1390 908 1560 837 4020 4410
A: catchment area.
Figure 1. The Vltava River catchment. The major tributaries and sites with records of historic floods and flood marks are highlighted.
essential for the examination of historical floods. According to the facts above, the Vltava River floods significantly in-fluence the Elbe River floods, at least up to Torgau (before confluence with the Mulde and Saale River and Magdeburg) in Germany. There is a strong association between the peak discharges in Prague and the Elbe profiles in northern Bo-hemia, and in Saxony – Pirna, Dresden, and Meissen (Elleder et al., 2013). A crucial issue for the presented study is that the flood marks and records of historic floods (Fig. 1) going back to 1432 are available for these sites (Brázdil et al., 2005; Fügner, 2007). In this study, Prague represents the major pro-file, while other profiles were used to supplement it, and for verification of the final estimates.
2 Methods 2.1 Input data
For the Vltava River catchment, 161 flood cases for the pe-riod between 1118 and 1824, when the regular daily wa-ter level measurements began, are available in Brázdil et al. (2005), denoted as set B further in this study.
The most reliable 18 cases associated with summer floods are related to the flood marks and original Prague wa-ter gauge denoted as “the Bearded Man”, used since 1481 (Elleder, 2003).
1890 rating curve validity (Richter, 1893). Water levels and peak discharges for Prague after 1954 are in the Czech Hy-drometeorological Institute database, concurrently in sim-ulation without the influence of the Vltava River dams (Hladný et al., 2004). The 2012 flood, with peak discharge of 5160 m3s−1, is the most important case over the instrumental period (Hladný et al., 2004). Interestingly, the flood of July 1432 was likely even more important (Elleder, 2010b). For other significant historic floods – bigger than Q50 – in the Vltava River catchment, Brázdil et al. (2005) published brief descriptions. Detailed papers on Czech floods, though most of them only in Czech, were published. Those available in English are only for the 1432 flood (Brázdil et al., 2006a), 1784 flood (Munzar et al., 2005), and 1830 (Munzar, 2000). Regretfully, the extreme flood cases, such as 1501, 1655, 1675, 1682, 1712, 1736, 1771, 1799, and 1824, have not been evaluated so far. For archiving of documentary sources related to floods over the Czech territory, the author has been developing a private relation database system “Krol-mus” since 2000.
2.2 Major Vltava River profile in Prague, its changes over time and estimation of maximum water levels Regarding the specific conditions of the Vltava River catch-ment, particularly in Prague, it was advantageous to use the estimated peak discharges. This approach enabled the author to use simple hydrological balance for filling and checking the final data set.
[image:3.612.315.535.96.200.2]The major Vltava River profile for Prague until 1824 was the monastery of the Knights of the Cross with the Red Star past the Charles Bridge; after 1824 with the beginning of the systematic water level measurements it was the Old Town Mills profile upstream of the Charles Bridge. An overview of the most important changes of floodplain and documen-tary sources available was presented by Elleder et al. (2013). The entire period under review, 1118–2013, has been di-vided into seven periods of more or less homogenous to-pography, with respect to both the reliability of input data and changes in the area near the major profile (Historical Ur-banization Stage, HUS further in the text). The least reliable data are those relating to 1118–1350 (HUS1). After the con-struction of the new city walls (1250–1300) and reconstruc-tion of the city, the Old Town terrain was more or less sta-bilized (Hrdliˇcka, 2000). In 1351–1480 (HUS2) some floods are recorded as related to important town buildings (Table 2). During this period, the number and height of Prague weirs were fixed. In 1481–1780 (HUS3) the records of water levels are available. Since 1481 these are related to the “Bearded Man” water gauge (Elleder, 2003, 2010b, 2013). Since 1501 flood marks started to appear, but those from 1501 and 1655 were destroyed, and currently flood marks since 1675 are preserved (Brázdil et al., 2005). Changes in floodplain be-tween the 16th and the mid 19th century were minor (Elleder et al., 2013). The first modern water gauge in Prague was
Table 2. Selected important sites (water level indicators) with rela-tions between water levels and peak discharges.
Site Rec. H Q
interval [cm] [m3s−1]
Old Town mill Q10 270 2200
Nunnery of St. Ann Q10–20 250–320 2200–2500
St.Valentine – floor (Val) Q10–20 300 2400
St. Linhart (Li) Q50 >400 >3500
St. Giles (Ag) Q100 >480 >4100
St. Nicholas (Ni) Q100 >500 >4500
Old Town Square (OTS) > Q100 >580 >5000
set up in 1781 (Brázdil et al., 2005; Elleder, 2010b). Sys-tematic records date back to 1825. The next 60-year period of 1781–1843 (HUS4) until the construction of the Vltava River embankment is used for calibration of the relation be-tween measured water stages during flood events and flood impacts, such as the flooded area (Elleder, 2010b). For simi-lar relations applicable for the HUS3 period it is possible to derive for flood damages and the Vltava River behaviour dur-ing ice-jammdur-ing. For the next period of 1844–1904 (HUS5), when the Vltava River embankment construction was under-taken, a rating curve is available. In 1904–1926 (HUS6a) the inundated area of the Old Town was raised to the em-bankment. In the next period 1927–1953 (HUS6b) no ma-jor changes occurred until construction of the Vltava River cascade dam. Construction of the Vltava River dam cascade in 1954–1961 resulted in a crucial change of the hydrolog-ical regime (Kašpárek and Bušek, 1990). The current pe-riod 1954–2013 (HUS7) has been affected by implementa-tion of the cascade. Until mobile dikes were put into op-eration (2000–2013), no major changes were undertaken in Prague.
2.3 Peak discharge estimates based on hydraulic calculation
mostly for evidence of major floods equal or higher toQ50 (before 1481) andQ10(starting from 1481).
2.4 Rating curves, ice jamming and other interpreted data from supporting profiles
Relations between water stage or peak discharge and impacts relevant for HUS5 and HUS6 periods (Elleder, 2010b) were applied for the interpretation of historic floods. The rating curve for 1880–1890 (Richter, 1893) was used for HUS3 floods – events with a fairly reliable documented water level. The map presenting isolines for different water levels in Prague (Elleder, 2010a) was used for interpretation of flood-ing of different sites or buildflood-ings in floodplain of Prague.
For winter floods, a problematic relation between water level and discharge due to ice jamming is to be accounted for. It is necessary to distinguish between the flood caused by ice jam making a barrier, and the flood caused by an increase of discharge (Beltaos, 2008). No case, nevertheless, with a higher water level due to ice jamming, as compared to subse-quent water level due to flood discharge, is known for Prague. For discharge higher than or equal to Q10, the discharge was always sufficient for an ice barrier release. This holds for the 1784 February flood (Elleder, 2010a), and also for all recorded winter floods during 1800–1850 (Fritsch, 1851). It is evident from the reconstructed hydrographs for winter floods in 1830, 1845, 1862, 1876 (Elleder, 2010a, b). Water levels resulting from ice jam reached merely 100–250 cm in contrast to subsequent discharge floods with recorded water levels of 350–550 cm. It is particularly true for the Prague profile, but does not hold, in any case, for supporting profiles in Dˇeˇcín, Dresden, and Meissen. The only exceptions might have been during HUS1 and HUS2 due to different condi-tions before the Charles bridge construction. As an example, the February 1342 flood which destroyed former and smaller Judith bridge across the Vltava River can be mentioned.
Supporting profiles in the upper Vltava River ( ˇCeské Budˇejovice, Beroun, Písek) as mentioned for example by Elleder (2008) were used for providing a balance of esti-mated discharges in the upper Vltava River, while support-ing profiles downstream (Litomˇeˇrice, Dˇeˇcín, Pirna, Dresden, Meissen) were used for regression estimates published ear-lier by Elleder et al. (2013). This approach enabled the check-ing and specification of not only estimated discharges, but also the time of flooding in Prague. In some cases, this ap-proach facilitated even the filling in of the missing values as an for example for 1434, 1531, 1775.
The credibility of discharges estimated by this approach above is undoubtedly lower than discharges derived from au-thentic description and records of floods in Prague.
2.5 Selection of floods
In the framework of the analysis, two approaches are to be distinguished: annual maximum flood (AMF further in the text), and peaks over threshold (POT further in the text) ap-proach.
The original B set including 161 recorded Vltava floods was augmented by 23 flood events. The results of my hy-drological interpretation of the augmented B set are pre-sented for all floods during 1118–2013 (Fig. 2). For further FFA only values higher or equal toQ2were considered. The floods lower thanQ2, recorded mostly for the Vltava River in ˇCeské Budˇejovice, without other supporting material for other tributaries were excluded. Final set for FFA included 176 flood events (123 events before 1825). The entire his-torical set (1118–1824) including detailed information was presented earlier by Elleder (2010b).
Set of estimated maximal water levels and peak dis-charges (equal or greater thenQ2)including POTQ10 for pre-instrumental and early instrumental period 1118–1824 is presented in the Supplement.
A perception threshold for recognizing an event as a flood, and for drawing a flood mark, a discharge aroundQ10 ble 1) was generally accepted in Prague until 1781 (Ta-bles 2, 3). That is the reason for establishingQ10as a thresh-old for denoting the real extreme flood events, and the selec-tion of such events is labelled POTQ10.
3 Results and discussion
3.1 Frequency of floods over the centuries
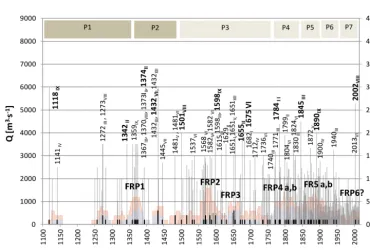
Figure 2. Frequency of floods in Prague over the centuries.
Figure 3. Final time series presenting running 31-year frequencies in summer and winter floods in Prague with identification of flood-rich periods, the extreme floods are in bold.
3.2 Periods with high flood frequency within a European context
Figure 3 presents an overview of about 300 maximal an-nual peak discharges in Prague (AMF, according to Elleder, 2010b). For more accurate identification of periods with high flood frequencies, a 31-year running sum was used. The ex-ceedance of POTQ10 defines flood-rich periods (FRP, fur-ther in the text). Six periods FRP1–6 with two sub-periods (FRP4a, b and FRP5a, b), with minimal overlap with respect toQ50–Q500occurrence, were identified in total. It was suit-able to delineate the two sub-periods as they differed in the flood character. The 1780s (FRP4a) were specific for major
winter flood events and impact of Laki eruptions in 1783– 1785. The FRP4b sub-period was in contrast characterized by major summer floods (1804 and 1824) and significant droughts (1811, 1823). Similar reasons hold for FRP5, in which summer floods clearly prevail in FRP4b.
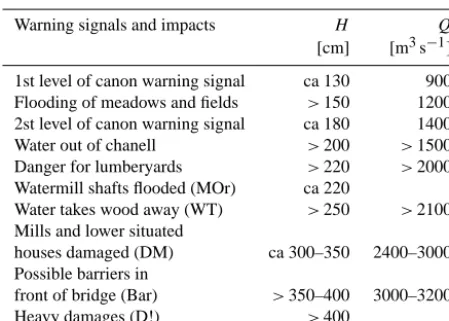
[image:5.612.112.482.268.518.2]Table 3. Selected important impacts with relations between water levels and peak discharges.
Warning signals and impacts H Q
[cm] [m3s−1]
1st level of canon warning signal ca 130 900 Flooding of meadows and fields >150 1200 2st level of canon warning signal ca 180 1400 Water out of chanell >200 >1500 Danger for lumberyards >220 >2000 Watermill shafts flooded (MOr) ca 220
Water takes wood away (WT) >250 >2100 Mills and lower situated
houses damaged (DM) ca 300–350 2400–3000 Possible barriers in
front of bridge (Bar) >350–400 3000–3200 Heavy damages (D!) >400
Some of the POTQ10 floods recorded in the Vltava River in Prague were part of more extensive events affecting a jor part of central Europe as well. If at least two or three ma-jor catchments out of five (the Elbe, Danube, Oder, Wesser, Warta) were simultaneously struck, these events can be la-belled as Central European Floods (CEF, further in the text). An example of such a CEF is the 1374 flood (FRP1), which is recorded, apart from the Vltava River, also in the Saale catch-ment (Deutsch and Portge, 2003), Danube catchcatch-ment (Kiss, 2011) and the Rhine catchment (Herget and Meurs, 2010). More additional information is needed for the winter flood of 1367 in Transylvania (Kiss, 2011) or in the Hornád River basin in 1568 (Pekárová et al., 2011). Synchronic winter floods (1655, 1682, 1784, 1799, 1862, 1876) were recorded by flood mark on the Main (Eibelstadt, Frankfurt am Main, etc.), the Danube (1682, 1784, 1799, 1830, 1862), and the Rhine (1651, 1784, 1799). For summer floods, an association with the Danube and Oder catchments is more common. Fre-quently, the Alpine tributaries of the Danube – the Inn, Enns, Traun – or the Danube itself between Passau and Vienna (1501, 1569, 1598, 1890, 2002, 2013) are involved. Flood marks of these are found at numerous sites (Linz, Schärd-ing, Burghausen, Steyer). Synchronic floods with the Vltava River for some Oder tributaries (Nysa Łu˙zycka [Lausitzer Neiße], Kwisa, Bóbr, Kaczawa, and Nysa Klodzka) for 1359, 1387, 1432, 1501, 1563, 1564, 1567, 1569 are presented by Girgus and Strupczewski (1965).
In cases when other catchments (the Seine, Loire, Maas) were also affected, the acronym WCEF (West-Central Eu-ropean flood) is used. These are, for example, 1651, 1658, 1740, 1784, and 1799 winter floods, as commented in detail earlier by Elleder (2010a) for Cologne, Dresden, Paris, and Vienna.
The overview of the identified periods with high flood fre-quencies with relevant flood events is presented below.
3.2.1 Period FRP1 (1350–1390), 7 flood events/40 years It includes summer floods of 1359 (CEF), 1370, and 1387 (CEF) and winter floods of 1367, 1364, 1373, and 1374 (CEF).
3.2.2 Period FRP2 (1560–1600), 10 AMF (12 in total) flood events/40 years
Summer floods prevail in 1564, 1567, 1568, 1569 (CEF), 1575, 1582, 1587, and 1598 (CEF). Winter floods in 1570, and 1566 (CEF). The type of the 1575 flood is not known.
3.2.3 Period FRP3 (1650–1685), 6 AMF flood events/35 years
Winter floods prevail in 1651 (WCEF), 1655 (CEF), and 1682 (CEF). Flood in 1658 (WCEF) was recorded for Dres-den and Paris (Elleder, 2010a). It is unclear, however, if the high peak discharge was not due to ice jamming. Summer floods in 1651 and 1675 have not been mentioned so far out-side of the Czech lands.
3.2.4 Period FRP4a (1770–1800), 6 flood events/35 years
Winter floods prevail in 1770, 1771, 1782, 1784 (WCEF), 1786, 1799 (WCEF).
3.2.5 Period FRP4b (1804–1830), 6 flood events/30 years
Winter floods in 1809, 1810, 1827, 1830 (CEF), and summer floods in 1804 and 1824.
3.2.6 Period FRP5a (1845–1880), 5 flood events/35 years
Winter floods prevail in 1845 (CEF), 1862 (CEF), 1865, and 1876 (CEF). The summer flood of 1872 was a flash flood with extreme intensity. This flood is related to the floods on the upper Rhine and Po tributaries. This period includes a catastrophic flood on the Elbe River in February 1846, and a no less deleterious flood in August 1858.
3.2.7 Period FRP5b (1880–1920), 6 flood events/40 years
3.2.8 Period FRP6 (1994–?), 3 flood events/14 years So far summer floods have prevailed in 2002 (CEF) and 2013 (CEF), after simulation (removing of the Vl-tava dam cascade influence), also the 2006 flood can be included (http://voda.chmi.cz/pov13/DilciZprava_DU_3_1_ cast1-VyznamnaVD-final.pdf).
The flood periods identified correspond, more or less, with similar periods for central Europe published earlier. The pe-riod corresponding with FRP1 was reported, for example, for the Isar River (Böhm and Wetzel, 2006), the Pegnitz, and the Rhine downstream of the confluence with the Mosela (Glaser et al., 2004).
Schmocker-Fackel and Naef (2010) assessed the flood fre-quency in 14 catchments across Switzerland. This was fur-ther extended by Böhm et al. (2014), who studied in more de-tail Bavarian Fore-Alps. Flood-rich periods in central Euro-pean catchments (Glaser and Stangl, 2003) correspond with FRP2–FRP4. This is not a surprising result, as the major floods in the Vltava River catchment were obviously part of extended CEF (likely more often than stated above), rarely of WCEF. The records are mostly lacking, however.
Results of this study show a minor peak around 1440– 1450, which was recorded also in the Pegnitz River catch-ment (Glaser et al., 2004). This peak in Prague is asso-ciated particularly with three extreme floods in 1432, and with 1434. Interestingly, one of these, the flood of August 1432 is comparable with the extreme 2002 flood (Brázdil et al., 2006a; Elleder, 2010b).
There are also some discrepancies between the results of the presented study and results published for other catch-ments. Surprisingly, one of the most prominent flood-rich periods in the second half of the 16th century (FRP2) differs from the Isar and Lech rivers catchments (Böhm and Wetzel, 2006), which are, with respect to geography, very similar to the Vltava River catchment. Nevertheless, in the very next Danube tributaries – the Traun and Enns River catchments – flood events parallel to the Vltava River catchment were identified (Rohr, 2007).
Identified flood-rich periods correspond with decadal fre-quencies for Prague (Brázdil et al., 2005), except for the period around 1750. This discrepancy is closely related to POTQ10 selection. If the criteria for selection are strictly adhered to, only floods from 1712, 1734, and 1736 may be identified. For this reason, the peak around 1750 is re-duced. Nevertheless, in this period also a fairly high num-ber of summer floods with estimated peak discharge ofQ5– Q10 (1751, 1755, and 1757), was recorded. If the peak dis-charge threshold was lower thanQ10, the peak around 1750 would be higher corresponding more to the results of Brázdil et al. (2005), whose criteria of flood selection wasQ2.
With regard to flood frequency across the entire area of Central Europe, the present flood-rich period began around 1994. Major floods were recorded in 1994, and 1995 (the Rhine River: Engel, 1997), 1997 (the Oder River:
Kundzewicz, 1999), 2002 (the Elbe and Danube Rivers: Hladný et al., 2004), 2005 (Upper Rhine and Danube tribu-taries: Beniston, 2006), 2010 (the Oder and Vistula Rivers) and 2013 (the Elbe, Danube, and Oder Rivers: Blöschl et al., 2013). This makes six or seven major floods over 20 years, including one large-scale event in the vast re-gion between the Rhine and Vistula Rivers. For such events, however, no comparable period was found in the last 100– 200 years of the instrumental period. This reason further en-hances an interest in examining the pre-instrumental period in search for an analogy with recent records.
4 Conclusions
The presented set of estimated flood peak discharges for Prague specifies results of previous studies. Peak discharge estimates made it possible to utilize also the data from the tributaries, and profiles situated downstream of the exam-ined river profile. In contrast, some discharges lower thanQ2 were excluded. That implies that the final set used for this study somewhat differed from data used for flood frequency analysis for the Vltava River catchment earlier (Brázdil et al., 2005).
In total, five historical periods with higher than POTQ10 flood frequency were identified. The time span for each of these five periods was some 35–40 years. Results of this study clearly show that POTQ10 flood is likely to occur 6– 12 times in a period of higher flood frequency, which means every third (in the 16th century) to eighth (in the 19th cen-tury) year on average. Additionally, during the current pe-riod, in the Vltava River catchment we have recorded three major floods within 12 years (2002, 2006, and 2013), which means one in 4 years on average.
To summarize: the results of the presented analysis indi-cate that the territory of the present Czech Republic might have experienced in the past extreme floods comparable, with regard to peak discharge (POTQ10) and frequency, to flood events recorded recently. With respect to Central Europe con-sidered as a whole, the existence of a similar period can be fairly reasonably assumed at least for the 16th century. It cannot be excluded, however, that one or even several more periods of extreme floods over a relatively short time span, occurred in the past. As a matter of fact, the historical data available presently do not allow an unambiguous conclusion on this issue.
The results of this study clearly show that currently avail-able historical data do not allow for deriving detailed conclu-sions on flood frequency in Central Europe. Further analysis of single flood events for the whole affected area (such as in Brázdil et al., 2010; Munzar et al., 2008, 2010) are urgently needed to be more certain in this aspect.
Acknowledgements. The author thanks his colleague Jolana Šírová
for preparing Fig. 1. The valuable comments of the three reviewers and proofreading by Sharon King are highly appreciated.
Edited by: G. Blöschl
References
Bayliss, A. C. and Reed, D. W.: The use of historical flood fre-quency estimation, CEH, Wallingford, UK, 2001.
Beltaos, S.: Progress in the study and management of river ice jams, Cold Reg. Sci. Technol., 51, 2–19, 2008.
Beniston, M.: August 2005 intense rainfall event in Switzer-land: not necessarily an analog for strong convective events in a greenhouse climate, Geophys. Res. Let., 33, L05701, doi:10.1029/2005GL025573, 2006.
Blöschl, G., Nester, T., Komma, J., Parajka, J., and Perdigão, R. A. P.: The June 2013 flood in the Upper Danube Basin, and comparisons with the 2002, 1954 and 1899 floods, Hy-drol. Earth Syst. Sci., 17, 5197–5212, doi:10.5194/hess-17-5197-2013, 2013.
Böhm, O. and Wetzel, K.-F.: Flood history of the Danube tributaries Lech and Isar in the Alpine foreland of Germany, Hydrolog. Sci. J., 51, 784–798, 2006.
Böhm, O., Jacobeit, J., Glaser, R., and Wetzel, K.-F.: Flood history of the Bavarian Alpine Foreland since the late Middle Ages in the context of internal and external climate forcing factors, Hydrol. Earth Syst. Sci. Discuss., 11, 7409–7440, doi:10.5194/hessd-11-7409-2014, 2014.
Brázdil, R., Glaser, R., Pfister, C., Dobrovolný, P., Antoine, J.-M., Barriendos, M., Camuffo, D., Deutsch, M., Enzi, S., Guidoboni, E., Kotyza, O., and Sanchez Rodrigo, F.: Flood events of selected European rivers in the sixteenth century, Climatic Change, 43, 239–285, 1999.
Brázdil, R., Dobrovolný, P., Elleder, L., Kakos, V., Kotyza, O., Kveton, V., Macková, J., Müller, M., Štekl, J., Tolasz, R., and Valášek, H.: Historical and Recent Floods in the Czech Republic, Masaryk University/Czech Hydrometeorological Institut, Brno, Prague, 2005.
Brázdil, R., Kotyza, O., and Dobrovolný, P.: July 1432 and Au-gust 2002 – two millennial floods in Bohemia?, Hydrolog. Sci. J., 51, 848–861, 2006a.
Brázdil, R., Kundzewicz, Z. W., and Benito, G.: Historical hydrol-ogy for studying flood risk in Europe, Hydrolog. Sci. J., 51, 739– 764, 2006b.
Brázdil, R., Demarée, G. R., Deutsch, M., Garnier, E., Kiss, A., Luterbacher, J., Macdonald, N., Rohr, C., Dobrovolný, P., Koláˇr, P., and Chromá, K.: European floods during the winter 1783/1784: scenarios of an extreme event during the “Little Ice Age”, Theor. Appl. Climatol., 100, 163–189, 2010.
Chow, V. T.: Open Channel Hydraulics, McGraw-Hill, New York, 1959.
Deutsch, M. and Pörtge, K. H.: Hochwasserereignisse in Thürin-gen, Ministerium für Landwirtschaft, Naturschutz und Umwelt, Freistaat Thüringen, Jena, 2003.
Elleder, L.: Pražský Bradáˇc, jeho stáˇrí, úˇcel a historie, Historica Pra-gensia, 1, 301–333, 2003 (in Czech).
Elleder, L.: Flood Frequency and Seasonality in the Sazava River Catchment Based on Historical Cases, Acta Universitas Caroli-nae Geographica, 15–28, 2008.
Elleder, L.: Reconstruction of the 1784 flood hydrograph for the Vltava River in Prague, Czech Republic, Global Planet. Change, 70, 117–124, 2010a.
Elleder, L.: Využitelnost proxydat v hydrologii: rekonstrukce ˇrady kulminaˇcních pr˚utok˚u Vltavy v Praze pro období 1118–2002 (Utilization of proxy-data in hydrology – reconstruction of peak discharge record from 1118–2002), PhD thesis, Praha, 150 pp., 2010b (in Czech).
Elleder, L., Herget, J., Roggenkamp, T., and Nießen, A.: Historic floods in the city of Prague – reconstruction of peak discharges, Hydrol. Res., 44, 202–214, 2013.
Engel, H.: The flood events of 1993/1994 and 1995 in the Rhine River basin, in: Destructive Water: Water-Caused Natural Dis-asters, their Abatement and Control, IAHS Publication no. 239, edited by: Leavesly, G. H., Lins, H. F., Nobilis, F., Parker, R. S., Schneider, V. R., and Van de Ven, F. H. M., IAHS Press, Walling-ford, UK, 1997.
Fritsch, K.: Über die constanten Verhältnisse des Wasserstandes und der Beeisung der Moldau bei Prag so wie die Ursachen von welchen dieselben abhängig sind nach mehrjährigen Beobach-tungen, Sitzugsberichten Akademie der Wissenschaften, 156– 192, 1851.
Fügner, D.: Historische Hochwasser-Marken des Elbestromes, BMBF-Projekt: “Integration von historischen und hydrolo-gisch/hydraulischen Analysen zur Verbesserung der regionalen Gefährdungsabschätzung und zur Erhöhung des Hochwasserbe-wusstseins”, BTU Cottbus, Cottbus, 2007.
Girgus, R. and Strupczewski, W.: Wyj ˛atki ze ´zródełhistorycznych o nadzwyczajnych zjawiskach hydrologiczno-meteorologicznych na ziemiach polskich w wiekach od X do XVI (Excerptions of the historical sources of extraordinary hydro – meteorological phenomena in Poland in 10–16 century), Wydawnictwa Komu-nikacji i Ł ˛aczno´sci, Warszawa, 1965 (in Polish).
Glaser, R. and Stangl, H.: Historical floods in the Dutch Rhine Delta, Nat. Hazards Earth Syst. Sci., 3, 605–613, doi:10.5194/nhess-3-605-2003, 2003.
Glaser, R., Stangel, H., and Lang, M.: Floods in Central Europe since AD 1300 and their regional context, Houille Blanche, 5, 43–48, 2004.
Glaser, R., Riemann, D., Schönbein, J., Barriendos, M., Brázdil, R., Bertolin, C., Camuffo, D., Deutsch, M., Dobrovolný, P., van En-gelen, A., Enzi, S., Halícková, M., Koenig, S. J., Kotyza, O., Li-manówka, D., Macková, J., Sghedoni, M., Martin, B., and Him-melsbach, I.: The variability of European floods since AD 1500, Climatic Change, 101, 235–256, 2010.
Herget, J. and Meurs, H.: Reconstructing peak discharges for his-toric flood levels in the city of Cologne, Germany, Global Planet. Change, 70, 108–116, 2010.
Herget, J., Roggenkamp, T., and Krell, M.: Estimation of peak dis-charges of historical floods, Hydrol. Earth Syst. Sci., 18, 4029– 4037, doi:10.5194/hess-18-4029-2014, 2014.
Hladný, J., Krátká, M., and Kašpárek, L. (Eds.): August 2002 catas-trophic flood in the Czech Republic, Ministry of Environment of the Czech Republic, Prague, 2004.
Eu-ropean Culture, International Symposium ICOMOS, 16–19 May 2000, Prague, 49–53, 2000 (in Czech).
Kašpárek, L. and Bušek, M.: Vliv vltavské kaskády na povodˇnový režim Vltavy v Praze, Vodní hospodáˇrství, 7, 280–286, 1990 (in Czech).
Kiss, A.: Floods and long-term water-level changes in medieval Hungary, PhD thesis, Central European University, Budapest, 2011.
Kundzewicz, Z. W.: The great flood of 1997 in Poland, Hydrolog. Sci. J., 44, 855–870, 1999.
Mudelsee, M., Börngen, M., Tetzlaff, G., and Grünewald, U.: No upward trends in the occurrence of extreme floods in central Eu-rope, Nature, 425, 166–169, 2003.
Munzar, J.: Floods in Central Europe after the exceedingly severe winter season 1829/1830, Moravian Geographical Reports, 8, 45–57, 2000.
Munzar, J., Elleder, L., and Deutsch, M.: The catastrophic flood in February/March 1784 – a natural disaster of European scope, Moravian Geographical Reports, 13, 8–24, 2005.
Munzar, J., Ondráˇcek, S., Elleder, L., and Sawicki, K.: Disastrous floods in central Europe at the end of July 1897 and lessons learnt, Moravian Geographical Reports, 16, 27–40, 2008. Munzar, J., Deutsch, M., Ondráˇcek, S., and Kallabová E.: Examples
of great cross-border floods in Central Europe and lessons learnt (case studies of floods from September and November 1890 on the occasion of their 120th anniversary), Moravian Geographical Reports, 18, 21–29, 2010.
Novotný, J.: Dvˇe stoleté hydrologické ˇrady pr˚utokové na ˇceských ˇrekách (Two hundred year hydrological records for the Czech rivers), Sborník prací, Hydrometeorologický ústav, Praha, 1963 (in Czech).
Pekárová, P., Škoda, P., Majerˇcáková, O., and Miklánek, P.: Výz-namné povodne na území Slovenska v minulosti (Important floods in Slovakia in the past), Acta Hydrologica Slovaca, 12, 65–73, 2011 (in Slovak).
Richter, J.: Zp˚usob pˇredchozích výpoˇct˚u stav˚u vody hoˇreního Labe (Method for water level forecast for the upper Elbe catchment), Technická kanceláˇr rady zemˇedˇelské, Praha, 1893 (in Czech and German).
Roggenkamp, T. and Herget, J.: Reconstructing peak discharges of historic floods of the River Ahr – Germany, Erdkunde, 68, 49–59, 2014.
Rohr, Ch: Extreme Naturereignisse im Ostalpenraum. Natur-erfahrung im Spätmittelalter und am Beginn der Neuzeit, Böhlau, Köln, 2007.
Schmocker-Fackel, P. and Naef, F.: Changes in flood frequencies in Switzerland since 1500, Hydrol. Earth Syst. Sci., 14, 1581–1594, doi:10.5194/hess-14-1581-2010, 2010.