Hydrol. Earth Syst. Sci., 17, 1445–1453, 2013 www.hydrol-earth-syst-sci.net/17/1445/2013/ doi:10.5194/hess-17-1445-2013
© Author(s) 2013. CC Attribution 3.0 License.
EGU Journal Logos (RGB)
Advances in
Geosciences
Open Access
Natural Hazards
and Earth System
Sciences
Open AccessAnnales
Geophysicae
Open AccessNonlinear Processes
in Geophysics
Open AccessAtmospheric
Chemistry
and Physics
Open AccessAtmospheric
Chemistry
and Physics
Open Access DiscussionsAtmospheric
Measurement
Techniques
Open AccessAtmospheric
Measurement
Techniques
Open Access DiscussionsBiogeosciences
Open Access Open Access
Biogeosciences
DiscussionsClimate
of the Past
Open Access Open Access
Climate
of the Past
Discussions
Earth System
Dynamics
Open Access Open Access
Earth System
Dynamics
DiscussionsGeoscientific
Instrumentation
Methods and
Data Systems
Open Access
Geoscientific
Instrumentation
Methods and
Data Systems
Open Access DiscussionsGeoscientific
Model Development
Open Access Open Access
Geoscientific
Model Development
DiscussionsHydrology and
Earth System
Sciences
Open AccessHydrology and
Earth System
Sciences
Open Access DiscussionsOcean Science
Open Access Open Access
Ocean Science
DiscussionsSolid Earth
Open Access Open Access
Solid Earth
DiscussionsThe Cryosphere
Open Access Open Access
The Cryosphere
DiscussionsNatural Hazards
and Earth System
Sciences
Open Access
Discussions
Statistical analysis of error propagation
from radar rainfall to hydrological models
D. Zhu1, D. Z. Peng2, and I. D. Cluckie1
1Department of Civil Engineering, Swansea University, Swansea, UK 2College of Water Sciences, Beijing Normal University, Beijing, China Correspondence to: D. Z. Peng ([email protected])
Received: 6 August 2012 – Published in Hydrol. Earth Syst. Sci. Discuss.: 10 September 2012 Revised: 22 March 2013 – Accepted: 25 March 2013 – Published: 17 April 2013
Abstract. This study attempts to characterise the manner with which inherent error in radar rainfall estimates input influence the character of the stream flow simulation un-certainty in validated hydrological modelling. An artificial statistical error model described by Gaussian distribution was developed to generate realisations of possible combi-nations of normalised errors and normalised bias to reflect the identified radar error and temporal dependence. These realisations were embedded in the 5 km/15 min UK Nimrod radar rainfall data and used to generate ensembles of stream flow simulations using three different hydrological models with varying degrees of complexity, which consists of a fully distributed physically-based model MIKE SHE, a semi-distributed, lumped model TOPMODEL and the unit hydro-graph model PRTF. These models were built for this purpose and applied to the Upper Medway Catchment (220 km2) in South-East England. The results show that the normalised bias of the radar rainfall estimates was enhanced in the sim-ulated stream flow and also the dominate factor that had a significant impact on stream flow simulations. This prelimi-nary radar-error-generation model could be developed more rigorously and comprehensively for the error characteristics of weather radars for quantitative measurement of rainfall.
1 Introduction
Recently, the advances of radar rainfall estimates with high spatial and temporal resolution have demonstrated the prospect of improving the accuracy of rainfall inputs on which the accuracy of stream flow simulation and real-time flood forecasting through hydrological models depends.
There is a wide range of studies which have focused on using weather radars for quantitative measurement of rain-fall in various hydrological models in order to evaluate the radar performance in different hydrological applications, es-pecially in flood forecasting (Collier and Knowles, 1986; Owens, 1986; Cluckie and Owens, 1987; Cluckie et al., 1989; Bell and Moore, 1998a, b; Borga, 2001; Carpenter et al., 2001; Tachikawa et al., 2002; Hossain et al., 2004; Reichel et al., 2008; Zhu and Cluckie, 2011); in particular, the value of radar-based data from the UK Nimrod system has been highlighted repeatedly, for example, in two severe flooding events during 1998 (at Easter over the Midlands and in late October over Wales), estimates of surface rainfall de-rived from radar data provided evidence of the extent and severity of the rainfall events.
More importantly, all these radar-related errors cannot be separated from the model errors when radar rainfall estimates are inputted to the hydrological models, and therefore the added benefit of radar rainfall data was devalued. Although corresponding correction techniques can be applied to im-prove the quality of the radar rainfall estimation (Collier et al., 1983; Hardaker et al., 1995; Collier, 1996; Fulton et al., 1998; Harrison et al., 2000), the radar rainfall estimates are always at risk of being contaminated by the error from different sources due to a great deal of uncertainty.
Therefore, some studies have been conducted to analyse the impact of radar rainfall estimation errors on hydrologi-cal applications. Collier and Knowles (1986) suggested that the impact of the errors in the precipitation estimation on the rainfall-runoff process varies, in specific circumstances, the errors will be less in the flow simulation, but in other cir-cumstances, the error will be magnified. In addition, Wyss et al. (1990) argued that the errors in runoff predictions are more significantly caused by the errors introduced in the transformation of rainfall to runoff than the errors of radar-estimated precipitation input. Winchell et al. (1998) con-cluded that the errors in radar rainfall estimates can be sep-arated into two categories: the errors come from the conver-sion of reflectivity to rainfall and the errors due to the misrep-resentation of rainfall field in spatial and temporal domain. And he pointed out that infiltration-excess runoff generation is much more sensitive than saturation-excess runoff gener-ation to both types of precipitgener-ation uncertainty, and the de-crease of spatial and temporal resolution will result in the sig-nificant reduction of predicted flow in the infiltration-excess runoff model. Pessoa et al. (1993), Vieux and Bedient (1998) and Morin et al. (2005) analysed influence of various Z-R relationships upon simulated hydrographs and indicated that the differences can be significant. Borga (2002) selected dif-ferent elevation scan angles to evaluate the impact of VPR on the catchment stream flow through a lumped hydrologi-cal model. Vivoni et al. (2007) presented the propagation of radar rainfall nowcasting error to flood forecasts in the con-text of distributed hydrological simulations over a range of catchment size or scales.
The above mentioned studies have only focused on indi-vidual sources of the radar error. However, in practical ap-plications, separating and estimating the different sources of radar errors is not possible. Therefore, several researchers employed physically based simulators of radar observations to study the radar-based rainfall error structure and focused on the estimation of total radar uncertainties (Ciach et al., 2007; Habib et al., 2008; Germann et al., 2009). Krajewski et al. (1993) and Anagnostou and Krajewski (1997) proposed and extended a physically based simulator of radar observa-tions according to a two-dimensional time-space stochastic modelling of radar errors, combined with a vertical struc-ture of hydrometeors and a statistically generated drop-size distribution. Sharif et al. (2002, 2004) coupled a physics-based mesoscale atmospheric model, a three-dimensional
radar simulator, and a two-dimensional infiltration-excess hydrological model to analyse the radar beam geometric and sampling-related effects. It showed that radar-watershed-storm orientation-related errors in Horton runoff predictions increase significantly due to range effects, particularly be-yond about 80 km. However, the main limitation on the im-plementation of this approach is the requirement to have ac-cess to a dense rain gauge network that can be used to ap-proximate “true” surface rainfall (Habib et al., 2008).
The main limitations on the implementation of realistic radar error model are not only the requirement to have access to a dense rain gauge network that can be used to approx-imate “true” surface rainfall, but also the uncertainties in-duced to the spatial structure of radar rainfall field in the en-semble members, which may lead to the difficulties in inter-preting the error propagation through hydrological models.
In this study, a simplified statistical error model based on empirical random error distribution was constructed to define and quantify the errors in the radar rainfall estimates at time domain, which will certainly preserve the spatial structure of the radar rainfall field and thus is immune to the uncertain-ties that could possibly be induced to rainfall distribution in space. Additionally, in order to quantify the impact from the radar errors on the stream flow, an ensemble trial was car-ried out to measure the influence by iterating the error model and propagating all perturbed rainfall through the hydrolog-ical models, thus the characteristic of the radar error can be quantified.
Because the aim of this work is to analyse the error propa-gation of radar rainfall in the context of hydrological models, the analysed error in this study was assumed to be derived from the proposed error model only, excluding the errors contained in the raw radar rainfall and hydrological models. In order to achieve that, the original 5 km resolution radar rainfall radar rainfall data extracted from UK Nimrod sys-tem with the state-of-the-art processes by Met Office, can be considered to be “true” rainfall to generate the rainfall pertur-bation. Meanwhile, the hydrological models were assumed to be perfect models as the surrogate of the study catchment, af-ter the selected criaf-teria for model calibration and validation have been met.
The reason for those assumptions is to set up a condi-tional environment to trace the error in the rainfall through the hydrological models, without the interference of inter-nal error from the raw radar rainfall data and hydrological models. The propagation of radar rainfall estimation errors was then assessed by different hydrological models with dif-ferent rainfall-runoff mechanisms, ranging from fully dis-tributed through semi-disdis-tributed to lumped models in the Upper Medway Catchment in Kent, United Kingdom.
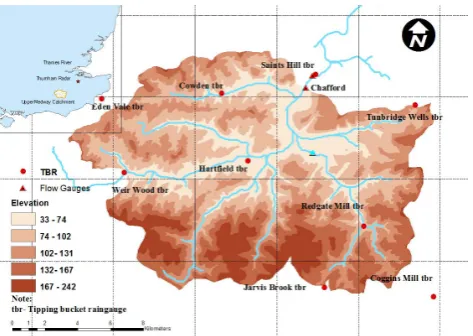
Fig. 1. Topographic and the river network map of the Upper Med-way Catchment.
to various hydrological simulations with different hydrolog-ical mechanisms has not been previously addressed in a quantitative mode, which differs from prior studies on the propagation of radar estimation errors.
2 Study area and experimental data
This hydrological experiment for radar rainfall estimation er-ror propagation took place in the Upper Medway Catchment, which is around 220 km2and located south of London; 50 km from the Thurnham Weather Radar site (see Fig. 1). The average annual rainfall and potential evapotranspiration are around 729 and 663 mm, respectively. The catchment ele-vation varies between 30 and 220 m above mean sea level and the majority of slope ranges from 2 to 8 degrees, which makes up around 70 % of the whole catchment and it sug-gests that the main scenery of the Upper Medway Catch-ment is small hills surrounding the flat, little relief low-lying area without much variation of elevation. The land use in the catchment can be simplified and described as permanent grass (over 95 %). The major soil types can be classified into two main types: silt loam and clayey silt, according to the Na-tional Soil Resources Institute (NSRI, 2006) data. The catch-ment is characterised by a mixture of permeable (chalk) and impermeable (clay) geologies and the dominant aquifers con-sist of the Ashdown Formation and the Tunbridge Wells For-mation. The saturation-excess mechanism is the major runoff generation process in the catchment.
The radar rainfall estimates used in this study were ex-tracted from the UK Nimrod composite data set, which was provided and quality controlled by the UK Met Office using the lowest available scan, and has been adjusted by available rain gauge measurement and undergone extensive process-ing to correct for various sources of radar error includprocess-ing noise, clutter, anomalous propagation, attenuation,
occulta-tion, “bright band” and orographic enhancement, etc. There-fore, the high-resolution radar composite rainfall estimates incorporate the latest UK Met Office processing algorithms to account for the different sources of errors in the estimation of precipitation using weather radars (Harrison et al., 2000), which implies that this data set is the best possible estimate of rainfall on the ground in the UK and can be used as origi-nal radar rainfall data for the perturbation process later in this study.
The hydrological data was obtained from 9 real-time TBRs (Tipping-bucket rain gauge) and resampled to 15min inter-val. The Nimrod radar rainfall data was provided by the British Atmospheric Data Centre (BADC) with 5 km/15 min resolution. Figure 1 shows the locations of the rain gauges (circles) and the discharge gauges (triangles), the rectangu-lar grid represents the 5×5 km2Cartesian national grid of the Nimrod radar data. Due to the data availability of radar rainfall, the period from July 2006 to December 2007 (18 months in total) was selected for radar-based rainfall error propagation analysis.
3 Methodology
3.1 Rainfall-runoff models
Three hydrological models with different mathematical structures and hydrological mechanisms were selected and constructed on the Upper Medway Catchment, including the physically based, fully distributed model: MIKE SHE (Abbott et al., 1986a, b; Refsgaard and Storm, 1995); the semi-distributed, lumped model: TOPMODEL (Beven and Kirkby, 1979; Beven and Freer, 2001) and the unit hydro-graph model: PRTF model (Yang and Han, 2006). All the models chosen have been widely used across the world and are representative of a set of mathematical structures that span from complex to simple and reflect a decreasing abil-ity to specifically represent the distributed (spatial) nature of the rainfall-runoff process.
The only objective of the Upper Medway models is in con-structing a surrogate of the catchment that can be used to study the error propagation from the radar rainfall estimation to the stream flow simulation by different rainfall-runoff pro-cedures, thus the model errors were not taken into account in the comparisons. The purpose of this work is to gain further insight into the interaction between radar-rainfall estimation and corresponding hydrological simulations by considering and evaluating the impact of radar rainfall estimation errors on a set of different rainfall-runoff model structures, instead of inter-comparing a set of hydrological models for a spe-cific flood event or comparing the simulation results from different radar-rainfall processing scenarios.
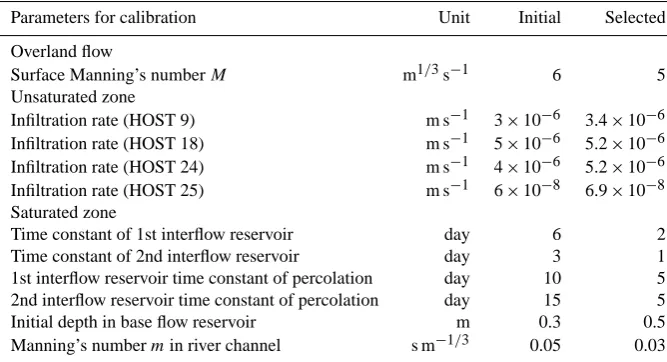
Table 1. Initial parameter values and expected ranges for MIKE SHE model.
Parameters for calibration Unit Initial Selected
Overland flow
Surface Manning’s numberM m1/3s−1 6 5
Unsaturated zone
Infiltration rate (HOST 9) m s−1 3×10⁻⁶ 3.4×10⁻⁶ Infiltration rate (HOST 18) m s−1 5×10⁻⁶ 5.2×10⁻⁶ Infiltration rate (HOST 24) m s−1 4×10⁻⁶ 5.2×10⁻⁶ Infiltration rate (HOST 25) m s−1 6×10⁻⁸ 6.9×10⁻⁸ Saturated zone
Time constant of 1st interflow reservoir day 6 2
Time constant of 2nd interflow reservoir day 3 1
1st interflow reservoir time constant of percolation day 10 5 2nd interflow reservoir time constant of percolation day 15 5
Initial depth in base flow reservoir m 0.3 0.5
Manning’s numbermin river channel s m−1/3 0.05 0.03
Table 2. Main parameter values for TOPMODEL.
Parameters for calibration Unit Value
Maximum moisture deficit SZM m 9.01×10⁻³
Lateral transmissivity when the soil is just saturatedT0 m2h−1 3.44×10⁻⁴ Time delay per unit of deficit in the unsaturated zoneTd h 2.93×10⁻³
Maximum allowable storage deficit SRmax m 0.63
estimation error ensembles, the reliability of radar rainfall detection and the model capability of simulation for radar-based rainfall storms.
MIKE SHE is a further developed hydrological modelling system based on the SHE concept, which was introduced in 1976 by three collaborating European organisations (Abbott et al., 1986). MIKE SHE is a complex deterministic model, which covers the entire hydrological system on a catchment scale (Refsgaard and Storm, 1995). The overland flow mod-ule in MIKE SHE employs a two-dimensional Saint-Venant equation to describe the water movement on the surface, and the finite difference method is used to solve this equation. The water movement through the soil profile, along with the evapotranspiration is modelled by a simplified Two-Layer ET/UZ model, which is suited to be applied to the catch-ment that has a shallow groundwater table and used in the unsaturated zone to calculate the actual evapotranspiration and the amount of water that recharges the saturated zone. The ground water flow is calculated using the linear reser-voir method and this method can be regarded as the bal-ance of the data availability of the geology, the complex-ity of the groundwater simulation and the benefit from the model simplicity.
TOPMODEL (TOPographic Model) developed a topo-graphic index to represent a dynamic saturated area of a basin (Beven and Kirkby, 1979; Beven and Freer, 2001). Since the early 1990s, TOPMODEL has been widely used because it
can provide spatially distributed hydrologic information with available input requirements (e.g. DEM data). For a DEM data grid cell,i, its topographic index, TIi, is calculated as follows:
TIi=ln ai tanβi
, (1)
whereai and tanβi are the upstream contributing area per unit contour length and the local slope at grid celli, respec-tively. The model simulates the variable source areas of the catchment, which assumes that overland flow is produced only over a small fraction of the total catchment area. The source areas that produce overland flow are those that be-come saturated during precipitation events. The dynamics of the saturated source areas is controlled by catchment to-pographical and subsurface hydraulic characteristics and the state of the catchment wetness.
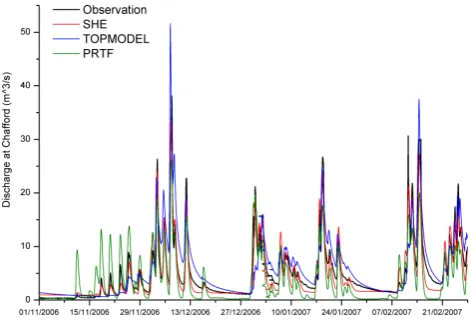
Fig. 2. Model calibration performance among MIKE SHE, TOP-MODEL and PRTF.
interpretation as forms of routing function. Mathematically it represents the simplest structure chosen to transfer the pre-cipitation information to stream flow by replicating the non-linear and time variant nature of the rainfall-runoff process and matching the model response as closely as possible to the catchment response in terms of three real-time adjust-ment factors (shape, volume and timing). The typical rainfall runoff transfer function model TF can be described by the following formula:
yt=a1yt−1+a2yt−2+ · · · +apyt−p+b0ut
+b1ut−1+b2ut−2+ · · · +bqut−q, (2) whereai,bi are the model parameters,yt andut are river flow and rainfall rate atttime, respectively, and the percent-age runoff of the process can be represented by Eq. (2). 3.2 Model parameterisation
Due to the lack of availability of radar rainfall data during the model calibration period, the model calibration and val-idation was carried out using 15 min rain gauge measure-ments and compared with 15 min observations of discharge at the catchment outlet at Chafford. The model parameterisa-tion process were performed for a 6 months period (ber 2003 to February 2004 for model calibration, Septem-ber 2006 to February 2007 for model validation), using the first 2 months as a warm-up period, and the remaining 4 months were used to evaluate model outputs.
[image:5.595.50.283.62.212.2]MIKE SHE was set up using a grid size of 100 m×100 m. The trial-and-error minimization was employed to calibrate the model. Firstly, the base flow was the main target, the rel-ative base flow controlling parameter, was set in a range and the parameters adjusted by validating the model iteratively. Secondly, the peak flow was taken into account and several sensitive parameters were selected in the calibration due to the contribution of the variability of parameters in relation to the peaks (Zhu and Cluckie, 2011). The final calibrated model parameters can be found in Table 1.
Fig. 3. Model validation performance among MIKE SHE, TOP-MODEL and PRTF.
Based on the DEM data, the topography index curve for the basin was calculated. Using TOPMODEL and the to-pography index curve to the Upper Medway Catchment, the overland flow and base flow were simulated (Beven and Kirkby, 1979; Beven and Freer, 2001; Peng and Xu, 2010), and the main parameters of TOPMODEL were listed in Table 2.
The auto calibration function was employed and the iden-tified PRTF model for the Upper Medway Catchment using effective rainfall can be written in the formation of Eq. (3) as below:
yt =2.866626yt−1−2.739182yt−2+0.872468yt−3 (3) +0.0083970ut
with time lag = 15 min and time to peak 10.799 h, whereyt andutare recorded river flow and precipitation rate att time, respectively.
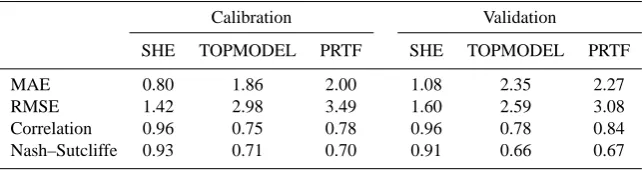
Figures 2 and 3 show the comparisons of model per-formance among MIKE SHE, TOPMODEL and PRTF in model calibration and validation period against the observa-tion stream flow at the catchment outlet (Peng and Du, 2010; Zhu and Cluckie, 2011); the corresponding statistics for all the models are listed in Table 3.
3.3 Radar rainfall error-ensemble-generation model
Table 3. Model performances in calibration and validation for the Upper Medway Catchment.
Calibration Validation
SHE TOPMODEL PRTF SHE TOPMODEL PRTF
MAE 0.80 1.86 2.00 1.08 2.35 2.27
RMSE 1.42 2.98 3.49 1.60 2.59 3.08
Correlation 0.96 0.75 0.78 0.96 0.78 0.84
Nash–Sutcliffe 0.93 0.71 0.70 0.91 0.66 0.67
was set to generate 3 different synthetic biasesσ, which were −0.3, 1(no bias) and 0.3 combined with various synthetic er-rorsηranging from 0 to 1.0 with a 0.2 increment.Eradnis the random error obtained from Gaussian distribution (Lukacs and King, 1954).
The normalised errors and normalised bias, shown in Eqs. (5) and (6) (Bringi et al., 2001), were employed to quan-titate the uncertainties in the perturbed radar rainfall data and evaluate impact simulated stream flow in this study.
NE= 1 N
N P
i=1
|Or−Op|
1 N
N P
i=1 Or
(5)
NB= 1 N
N P
i=1
(Or−Op)
1 N
N P
i=1 Or
(6)
As to quantitate the uncertainties in radar rainfall data, the ground truth data was considered to be the raw 5 km radar rainfall data obtained from Nimrod, which was represented byOrwhich is the same asR in Eq. (4), whereas the per-turbed radar rainfall dataRpin Eq. (4) is denoted byOp.
Similarly, as to quantitate the uncertainties in stream flow after error propagation through the hydrological models, the simulated results produced by the original rainfall data R in Eq. (4) are denoted by Or and the corresponding sim-ulation results triggered by the perturbation rainfallRp in Eq. (4) are represented byOp. Therefore, the values of NE and NB can be calculated for rainfall field and simulated flow, respectively.
[image:6.595.309.545.194.353.2]The synthetic error model in this study was set to run 10 times iteratively with each combined ensemble (one syn-thetic bias σ and one synthetic error η), which produced 157 perturbed radar rainfall ensemble members, thus artifi-cial noise was added to original radar rainfall for all the radar grids and varied randomly for each run during the simula-tion. Consequently, each run produced a unique combination of normalised error NE and normalised bias NB for the per-turbed rainfall and the corresponding streamflow simulation through three different hydrological models.
Fig. 4. Normalised errors distribution of perturbed rainfall and stream flow (red solid line: rainfall, orange dot line: MIKE SHE, green dot line: TOPMODEL, blue dot line: PRTF).
4 Results and discussion
The impact on rainfall and flow from model error and model bias can be seen in the contour maps in Figs. 4 and 5, which indicate how the statistical error model affects the normalised errors in rainfall and stream flow and normalised bias in rainfall and stream flow, respectively.
In Fig. 4, the ensemble normalised error in rainfall has a different distribution with the normalised error in the stream flows simulated in three models. It shows that the rainfall normalised error can trigger a range of possible correspond-ing normalised errors in stream flow. Although the maxi-mum values of the range are quite close to the rainfall nor-malised error, the minimum values of the range increase along with the enhancement of the rainfall normalised er-ror. Figure 4 also demonstrates the difference performance of ensemble simulation in three hydrological models, even though they share the similar error distribution. The prop-agated normalised errors in the distributed model (MIKE SHE) are slightly smaller than the errors produced in the lumped model, TOPMODEL. However, the normalised er-rors were constrained more in the unit hydrograph model PRTF than the other two models.
Fig. 5. Normalised bias distribution of perturbed rainfall and stream flow (red solid line: rainfall, orange dot line: MIKE SHE, green dot line: TOPMODEL, blue dot line: PRTF).
simulated in three models (see Fig. 5). It shows that if the normalised bias of the rainfall rises, the normalised bias of the stream flow would not only follow but also be enhanced, especially when the rainfall normalised bias was above zero. However, this enhancement was relatively smaller when the rainfall normalised bias was below zero. And similar to Fig. 4, the propagated bias varies among three hydrologi-cal models, the bias enhancement in MIKE SHE distributed model has less than the lumped model, TOPMODEL, but still the unit hydrograph model PRTF has the best performance on the bias control, the value of which is almost the same as the bias in the rainfall.
Additionally, the normalised errors in the stream flow were mainly influenced by the normalised bias in the rainfall as well. Generally, it was less than the normalised errors in the rainfall, when the normalised bias of the rainfall was not too high, and its value would be very similar to the absolute value of the normalised bias in the stream flow. However, when the normalised bias of the rainfall decreases below zero, the nor-malised errors in the stream flow would be narrowed, com-pared to the rainfall normalised errors, but its value was big-ger than the absolute value of the steam flow normalised bias. Regarding the different error propagation through hydro-logical models, the distributed model MIKE SHE slightly outperformed the lumped model TOPMODEL in terms of the value of normalised error and normalised bias in stream flow. However, these two criterions are more considerably constrained in the unit hydrograph model PRTF. This is ini-tially seen as a controversial conclusion but after reflec-tion it is completely justified by the analysis presented. This study also proved that the hydrological models, especially for the distributed and lumped hydrological models, which where constructed based on physical rainfall-runoff mecha-nism, act like a low-pass filter and smooth the noise of fall by averaging. Therefore, the ensemble perturbed rain-fall data has similar error propagation through the MIKE
SHE and TOPMODEL. However, the unit hydrograph model PRTF is based on transfer function, which was a pure math-ematical model of a dynamic system. The connection be-tween rainfall and runoff in this model is non-linear and time variant. Hence, the PRTF model is only sensitive to the three real-time adjustment factors (shape, volume and tim-ing), which match the model response as closely as possible to the catchment response. Therefore, the rainfall perturba-tion has less effect in this process, compared to the other two hydrological models.
5 Conclusions
A simplified statistical error model based on empirical ran-dom error distribution was constructed to define and quan-titate the errors in the radar rainfall estimates through hy-drological models with different rainfall-runoff mechanisms. The propagation of radar rainfall estimation errors was as-sessed through different hydrological models, ranging from fully distributed to semi-distributed to lumped models in the Upper Medway Catchment in Kent, United Kingdom. The implication of hydrological model structures on radar errors propagation is illustrated through the different integrative na-ture of the hydrological simulations. Overall, the conclusions made in this study are summarised as follows:
1. The normalised bias of the radar rainfall was the dom-inate factor that had a significant impact and would be enhanced by the stream flow bias.
2. The distributed model MIKE SHE and the lumped model TOPMODEL selected in this study have similar performance on the rainfall error propagation.
3. The unit hydrograph model PRTF was good at con-straining the rainfall error on the stream flow because of the simplicity of transfer function mechanism. The radar precipitation error ensemble analysis was a prelim-inary experiment regarding the issue of how much impact on simulated flow could be caused by a distributed hydrological model if the error of radar rainfall data is identified.
Although the error model is relatively simple in this study, benefits could still be expected from this paper, as the pro-posed error model has preserved the spatial structure of the radar rainfall field, but effectively reflect error distribution in time domain, which provide a different insight to study error propagation. The simulation results can be interpreted and referred in further studies.
which differs from prior studies on the propagation of radar estimation errors.
Nevertheless, more effort could be made to further re-search this issue and one of the alternatives is to add the noise to the radar signals in a “radar” way, which means not every radar grid shares the same error, but depends on the source of the noise during the forecasting. An example is clutter that could be added into the radar image to see the distribution of the error in the forecast rainfall or attenuation could be used to examine the influence under different error magni-tudes. The model could then tell how much influence the error caused to the flow, which could give some indication on how to deal with the radar rainfall data errors, especially when some of these errors are inevitable.
Acknowledgements. This study is financially supported by the National Natural Science Foundation (50909003), the Scientific Research Foundation for the Returned Overseas Chinese Scholars, State Education Ministry, China and the FRMRC (Flood Risk Management Research Consortium), UK. We also thank the help of Rico-Ramirez from University of Bristol and support of Environment Agency, Danish Hydraulic Institute (DHI), Met Office, BADC and OS/EDINA.
Edited by: A. Shamseldin
References
Abbott, M. B., Bathurst, J. C., Cunge, J. A., O’Connell, P. E., and Rasmussen, J.: An introduction to the European Hydrological System – Syst`eme Hydrologique Europ´een, “SHE”, 1: History and philosophy of a physically–based, distributed modeling sys-tem, J. Hydrol., 87, 45–59, 1986a.
Abbott, M. B., Bathurst, J. C., Cunge, J. A., O’Connell, P. E., and Rasmussen, J.: An introduction to the European Hydrological System – Syst`eme Hydrologique Europ´een, “SHE”, 2: Structure of a physically–based, distributed modeling system, J. Hydrol., 87, 61–77, 1986b.
Anagnostou, E. N. and Krajewski, W. F.: Simulation of radar reflec-tivity fields: algorithm formulation and evaluation, Water Resour. Res., 33, 1419–1429, 1997.
Battan, L. J.: Radar observation of the atmosphere, The University of Chicago Press, 1973.
Bell, V. A. and Moore, R. J.: A grid-based distributed flood fore-casting model for use with weather radar data: Part 1. Formula-tion, Hydrol. Earth Syst. Sci., 2, 265–281, doi:10.5194/hess-2-265-1998, 1998a.
Bell, V. A. and Moore, R. J.: A grid-based distributed flood forecast-ing model for use with weather radar data: Part 2. Case studies, Hydrol. Earth Syst. Sci., 2, 283–298, doi:10.5194/hess-2-283-1998, 1998b.
Beven, K. J. and Freer, J.: A dynamic TOPMODEL, Hydrol. Pro-cess., 15, 1993–2011, 2001.
Beven, K. J. and Kirkby, M. J.: A physically based variable con-tributing area model of basin hydrology, Hydrol. Sci. B., 24, 43– 69, 1979.
Borga, M.: Use of radar rainfall estimates in rainfall-runoff model-ing: an assessment of predictive uncertainty. Fifth International Symposium on Hydrological Applications of Weather Radar-Radar Hydrology, Japan, 451–456, 2001.
Borga, M.: Accuracy of radar rainfall estimates for stream flow sim-ulation, J. Hydrol., 267, 26–39, 2002.
Bringi, V. N., Huang, G. J., Chandrasekar, V., and Keenan, T. D.: An areal rainfall estimator using differential propagation phase: evaluation using a c-band radar and a dense gauge network in the tropics, J. Atmos. Oceanic Technol., 18, 1810–1818, 2001. Browning, K. A.: Meteorological applications of radar, Rep. Prog.
Phys., 41, 763–801, 1978.
Carpenter, T. M., Georgakakos, K. P., and Sperfslagea, J. A.: On the parametric and nexrad-radar sensitivities of a distributed hydro-logic model suitable for operational use, J. Hydrol., 253, 169– 193, 2001.
Ciach, G. J., Krajewski, W. F., and Villarini, G.: Product-error-driven uncertainty model for probabilistic quantitative precipita-tion estimaprecipita-tion with NEXRAD data, J. Hydrometeorol., 8, 1325– 1347, 2007.
Cluckie, I. D. and Owens, M. D.: Real-time rainfall-runoff models and use of weather radar information. Weather Radar and Flood Forecasting, John Wiley & Sons, 1987.
Cluckie, I. D., Yu, P., and Tilford, K.: Real-time forecasting: model structure and data resolution, Weather Radar Networking, Brus-sels, Belgium, 1989.
Collier, C. G.: Applications of weather radar systems, Praxis Pub-lishing Ltd, 1996.
Collier, C. G. and Knowles, J. M.: Accuracy of rainfall estimates by radar, part iii: application for short-term flood forecasting, J. Hydrol., 83, 237–249, 1986.
Collier, C. G., Larke, P. R., and May, B. R.: A weather radar correc-tion procedure for real-time estimacorrec-tion of surface rainfall, Q. J. Roy. Meteorol. Soc., 109, 589–608, 1983.
Duncan, M. R., Austin, B., Fabry, F., and Austin, G. L.: The effect of gauge sampling density on the accuracy of streamflow prediction for rural catchments, J. Hydrol., 142, 445–476, 1993.
Fabry, F., Austin, G. L., and Tees, D.: The accuracy of rainfall esti-mates by radar as a function of range, Q. J. Roy. Meteorol. Soc., 118, 435–453, 1992.
Fabry, F., Bellon, A., Duncan, M. R., and Austin, G. L.: High reso-lution rainfall measurements by radar for very small basins: the sampling problem re-examined, J. Hydrol., 161, 415–428, 1994. Fulton, R. A., Breidenbach, J. P., Seo, D. J., Miller, D. A., and Ban-non, T.: The wsr-88d rainfall algorithm, Weather Forecast., 13, 377–395, 1998.
Germann, U., Berenguer, M., Sempere-Torres, D., and Zappa, M.: REAL – Ensemble radar precipitation estimation for hydrology in a mountainous region, Q. J. Roy. Meteorol. Soc., 135, 445– 456, 2009.
Habib, E., Aduvala, A. V., and Meselhe, E. A.: Analysis of radar-rainfall error characteristics and implications for streamflow sim-ulation uncertainty, Hydrolog. Sci. J., 53, 568–587, 2008. Hardaker, P. J., Holt, A. R., and Collier, C. G.: A melting-layer
model and its use in correcting for the bright band in single-polarization radar echoes, Q. J. Roy. Meteorol. Soc., 121, 495– 525, 1995.
correction techniques, Meteorol. Appl., 7, 135–144, 2000. Harrold, T. W., English, E. J., and Nicholass, C. A.: The accuracy
of radar derived rainfall measurements in hilly terrain, Q. J. Roy. Meteorol. Soc., 100, 331–350, 1974.
Hossain, F., Anagnostou, E. N., Dinku, T., and Borga, M.: Hydro-logical model sensitivity to parameter and radar rainfall estima-tion uncertainty, Hydrol. Process., 18, 3277–3291, 2004. Kitchen, M.: Towards improved radar estimates of surface
precipi-tation rate at long range, Q. J. Roy. Meteorol. Soc., 123, 145–163, 1997.
Krajewski, W. F. and Smith, J. A.: Radar hydrology: rainfall esti-mation, Adv. Water. Resour., 25, 1387–1394, 2002.
Krajewski, W. F., Raghavan, R., and Chandrasekar, V.: Physically based simulation of radar rainfall data using a space-time rainfall model, J. Appl. Meteor., 32, 268–283, 1993.
Lukacs, E. and King, E. P.: A property of normal distribution, The Annals of Mathematical Statistics, 25, 389–394, 1954.
Morin, E., Maddox, R. A., Goodrich, D., and Sorooshian, S.: Radar Z-R relationship for summer monsoon storms in Arizona, Weather Forecast., 20, 672–679, 2005.
National Soil Resources Institute: NSRI soil data structures and re-lationships, Cranfield University, 2006.
Owens, M. D.: Real-time flood forecasting using weather radar data, Ph. D. Thesis, University of Salford, UK, 1986.
Peng, D. Z. and Du, Y.: Comparative analysis of several Lhasa River basin flood forecast models in Yarlung Zangbo River, iCBBE 2010, Chengdu, China, 2010.
Peng, D. Z. and Xu, Z. X.: Simulating the impact of climate change on stream flow in the Tarim River basin by using a modified semi-distributed monthly water balance model, Hydrol. Process., 24, 209–216, 2010.
Pessoa, M. L., Bras, R. L., and Williams, E. R.: Use of weather radar for flood forecasting in the Sieve River basin: a sensitivity analysis, J. Appl. Meteor., 32, 462–475, 1993.
Probert-Jones, J. R.: The radar equation in meteorology, Q. J. Roy. Meteorol. Soc., 88, 485–495, 1962.
Refsgaard, J. C. and Storm, B.: MIKE SHE, in: Computer Models of Watershed Hydrology, edited by: Singh, V. P., Water Resources Publications, Highlands Ranch, 809–846, 1995.
Reichel, F. V., Hans-Reinard, S. K., Cluckie, I. D., and Rico-Ramirez, M. A.: Radar-based flood forecasting for the Upper Medway Catchment in the UK, Proceedings of the Institution of Civil Engineers-Water Management, 2008.
Rico-Ramirez, M. A., Cluckie, I. D., Shepherd, G., and Pallot, A.: A high-resolution radar experiment on the island of Jersey, Me-teorol. Appl., 14, 117–129, 2007.
Sharif, H. O., Ogden, F. L., Krajewski, W. F., and Xue, M.: Numeri-cal simulations of radar rainfall error propagation, Water Resour. Res., 38, 1140, doi:10.1029/2001WR000525, 2002.
Sharif, H. O., Ogden, F. L., Krajewski, W. F., and Xue, M.: Statis-tical analysis of radar rainfall error propagation, J. Hydrometeo-rol., 5, 199–212, 2004.
Tachikawa, Y., Vieux, B. E., Georgakakos, K. P., and Nakakita, E.: Weather Radar Information and Distributed Hydrological Model, IAHS Publication, 2002.
Vieux, B. E. and Bedient, P. B.: Estimation of rainfall for flood pre-diction from WRS-88D reflectivity: a case study, 17–18 October 1994, Weather Forecast., 13, 407–415, 1998.
Vivoni, E. R., Entekhabi, D., and Hoffman, R. N.: Error propaga-tion of radar rainfall nowcasting fields through a fully distributed flood forecasting model, J. Appl. Meteor. Climatol., 46, 932–940, 2007.
Wilson, J. W. and Brandes, E. A.: Radar measurement of rainfall – a summary, B. Am. Meteorol. Soc., 60, 1048–1058, 1979. Winchell, M., Gupta, H. V., and Sorooshian, S.: On the
simula-tion of infiltrasimula-tion and saturasimula-tion-excess runoff using radar-based rainfall estimates: effects of algorithm uncertainty and pixel ag-gregation, Water Resour. Res., 34, 2655–2670, 1998.
Wyss, J., Williams, E. R., and Bras, R. L.: Hydrologic modeling of New England basins using radar rainfall data, J. Geophys. Res., 95, 2143–2152, 1990.
Yang, Z. and Han, D.: Derivation of unit hydrograph using a transfer function approach, Water Resour. Res., 42, W01501, doi:10.1029/2005WR004227, 2006.