THRUST FORCE, SURFACE ROUGHNESS AND OVALITY
PREDICTION BY RSM IN DRILLING OF ALUMINIUM
BASED METAL MATRIX COMPOSITES
Senthil Babu S.1 and Vinayagam B. K.2
1Valliammai Engineering College, SRM University, Chennai, India
2Department of Mechanical Engineering, SRM University, Chennai, India
E-Mail: [email protected]
ABSTRACT
Drilling is one of the most economical and widely used conventional machining processes for making holes during assembly operations. Predictions of cutting forces and the quality of drilled holes for any set of cutting parameters are essential in optimal design and manufacturing of products. In this paper, thrust force and drilled hole surface characteristics during drilling of Al/SiC metal matrix composites using high speed steel have been studied. The thrust force is measured using drill tool dynamometer, drilled hole surface roughness using Sufcom- surface measuring instrument and ovality of the hole using profile projector. Linear regression equations are developed using Response surface methodology with an objective to establish a correlation between the selected drilling parameters with the quality characteristics of the drilled holes. The predicted values are compared with experimental data and are found to be in good agreement.
Keywords: ovality, RSM, metal matrix composites, ANOVA, surface roughness, thrust force.
INTRODUCTION
Metal matrix composites are unique material fabricated by reinforcement of ceramic particles in to a tough metal matrix. In the last few decades, research has shifted towards composite materials to meet the global demand for high strength to weight ratio, good performance, ecofriendly, corrosion and wear resistant materials [1]. But composites are not easy to drill as compared to conventional materials. Drilling is most widely used for joining different materials, due to the economic reason and applicability. Generally, the metal matrix composites contain Silicon carbide in particulate form. So, the cutting tool must be able to drill the composites with good quality. Also, the understanding of relationship among the various cutting parameters became necessary to identify the important parameters that influence the quality of drilling [2]. There are many factors that influence the quality of drilled holes in metal matrix composites. Most important factors among them are cutting parameters (Cutting speed and feed rate) and cutting configurations (Drill tool, tool diameter and tool geometry) [3] [4].
Yahya Altunpak et al. [4] carried out an
experimental study on the drilling characteristics of Al/SiC/Gr hybrid metal matrix composites. P. Kishore Kumar et al. [5] carried out an investigation on the influence of thrust force and torque in drilling processes of Aluminum 6061-T6 alloy. A. Muniaraj et al. [6] carried
out a study on the Influence of drilling parameters on thrust force in drilling of Al/Sic/Gr hybrid metal matrix composites. A. TASKESEN et al. [7] carried out an
analysis for optimization of drilling parameters for tool
wear and hole dimensional accuracy in and Aluminium based metal matrix composites.
The aim of this paper is to analyze the cutting parameters (Cutting speed and feed rate) and cutting configurations (Tool diameter) on thrust force, surface roughness of the drilled hole and ovality of the drilled hole in drilling of Al-10%/SiC metal matrix composites by HSS drill of 5 mm, 7.5 mm and 10 mm diameter with different spindle speed and feed conditions. Taguchi’s L27 orthogonal array is used for conducting the experiments. The experimental results are analysed by response surface methodology using the software design expert version 7.0.0 and the prediction model is compared with the experimental results.
EXPERIMENTAL WORK
Composite specimen preparation
slurry was then poured into a preheated cast ion permanent mould. The solidified casting obtained after cooling is used as the test specimen.
Test set up and drilling process
The drilling tests are performed on Taiwan made ARIX-CNC vertical machining centre. Coolant was not used in all of the drilling tests. The dimensions of the work piece samples used for conducting the experiments were 100 mm×100 mm×10 mm. The machining parameters and types of drills are given in Table-1.
The Kirsler dynamometer is used to record the thrust force in the drilling of hybrid MMCs [8]. The dynamometer is connected to a 3-channel charge amplifier type through a connecting cable, which in turn is connected to the PC with a 37-pin cable from the A/D board. The thrust force from the dynamometer was amplified and fed through a data-acquisition system for electronic storage. The data-acquisition System is based on the dynaware software.
The surface roughness of the work piece hole was measured by using Kosaka - Surfcoder SE700 a surface roughness measuring instrument. The surface roughness was measured parallel to each hole axis [9] from various points and the average values of the measurements were evaluated and considered for analysis.
Ovality is one of the most important parameter to check hole quality performance. It is defined as a two
dimensional geometric tolerance that controls how much a feature can deviate from a perfect circle [10]. Measurement of Ovality is done by profile projector.
Response surface methodology
Response surface methodology (RSM) is a collection of experimental strategies, statistical and mathematical techniques that are useful for the analysis of problems in which the response of interest is influenced by various parameters and the objective is quality improvement and to minimize the response [11]. In response surface methodology, the quantitative relationship between the response of interest and the independent process variables is represented as follows R = Φ (f, s, d)
Where R is the response of interest, Φ is the response function, f is feed rate in mm/rev, s is spindle speed in rpm and d is the drill tool diameter in mm [12].
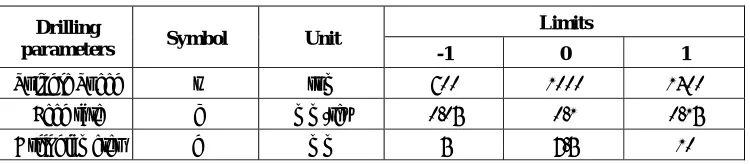
[image:2.612.120.495.436.518.2]The working range of factors was set at five levels. The selected factors and their levels are shown in Table [13]. Analysis of variance is a statistical analysis method that describes about the nature of data. It is a method of portioning variability into identifiable sources of variations and the associated degrees of freedom in the experiment [14].
Table-1. Drilling parameters and limits. Drilling
parameters Symbol Unit
Limits
-1 0 1
Spindle Speed s rpm 600 1000 1400
Feed rate f mm/rev 0.05 0.1 0.15
Drill diameter d mm 5 7.5 10
RESULTS AND DISCUSSIONS
The experiments are planned to conduct as per L27 Orthogonal Array. Table chosen based on Taguchi’s quality design method (Table-2). The Response Surface Methodology was performed to predict the thrust force,
Table-2. L27 Orthogonal array for MMC (Al6061 + 10% SiC) drilling with HSS tool.
Group No.
Drilling parameter Responses
Diameter of drill (mm)
Speed
(rpm) Feed rate (mm/rev) force Thrust (N)
Surface roughness
(µm)
Ovality (%)
1 1 1 1 158.569 5.72 2.3
2 1 1 2 185.913 5.8 0.1
3 1 1 3 224.731 7.26 1.5
4 1 2 1 122.192 7.07 1.4
5 1 2 2 121.704 5.46 1.3
6 1 2 3 147.461 9.37 0.3
7 1 3 1 109.619 5.61 0.5
8 1 3 2 112.915 5.92 0.2
9 1 3 3 117.065 5.68 0.2
10 2 1 1 217.59 5.8 1.9
11 2 1 2 270.736 5.53 0.71
12 2 1 3 294.97 6.96 1.2
13 2 2 1 185.937 7.42 1.3
14 2 2 2 211.807 5.83 1.06
15 2 2 3 238.062 8.5 1.35
16 2 3 1 161.334 6.41 1.02
17 2 3 2 196.54 6.09 0.63
18 2 3 3 201.468 6.17 0.95
19 3 1 1 254.579 3.22 2.1
20 3 1 2 351.936 5.04 1.2
21 3 1 3 369.324 5.67 1.4
22 3 2 1 227.905 4.3 1.85
23 3 2 2 314.209 8.63 1.6
24 3 2 3 330.444 6.53 1.4
25 3 3 1 199.684 3.13 0.72
26 3 3 2 272.433 4.82 1.06
27 3 3 3 297.772 4.34 0.87
From the ANNOVA table for thrust force, Table-3, it is clear that the F value of 102.5 and the value of Prob > F is less than 0.0001which indicates that the terms in the model are significant. The "R-Squared" value is 0.9819 which is in reasonable agreement. From the Table, it is concluded that the factors d, s, f and their interactions have significant effect on the thrust force. The final regression equation in terms of coded factors is given below.
Thrust Force = +220.57 + 73.23 * d -36.64 * s + 32.44 * f + 1.97 * d * s + 18.04 * d * f - 9.38 * s * f - 2.14 * d2 + 10.99 * s2 - 12.09 * f2
The ANNOVA Table for Surface roughness, Table-4, shows that the F value of 3.31 and the value of Prob > F is less than 0.0161 which indicates that the terms in the model are significant and in the ANNOVA table for ovality, Table-5, the F value is 3.79 and the value of Prob > F is less than 0.011 which indicates that the terms in the model are significant. The final regression equation in terms of coded factors for surface roughness is given as
The final regression equation in terms of coded
factors for ovality of the drilled hole is given as Ovality = +1.12 + 0.24 * d - 0.35 * s - 0.22 * f + 0.079 * d * s + 0.100 * d * f + 0.16 * s * f.
Table-3. ANNOVA table for thrust force.
Source Sum of
squares df
Mean square
F Value
p-value Prob > F
Model 1.463E+005 9 16251.92 102.50 < 0.0001 significant A-Tool
Diameter 96524.02 1 96524.02 608.79 < 0.0001 B-Speed 24164.67 1 24164.67 152.41 < 0.0001 C-Feed rate 18940.29 1 18940.29 119.46 < 0.0001
AB 46.67 1 46.67 0.29 0.5945
AC 3905.84 1 3905.84 24.63 0.0001
BC 1056.92 1 1056.92 6.67 0.0194
A^2 27.35 1 27.35 0.17 0.6831
B^2 724.07 1 724.07 4.57 0.0474
C^2 877.49 1 877.49 5.53 0.0310
Residual 2695.37 17 158.55 Cor Total 1.490E+005 26
Table-4. ANNOVA table for surface roughness.
Source Sum of
squares df
Mean square
F Value
p-value Prob > F
Model 35.46 9 3.94 3.31 0.0161 significant
A-Tool
Diameter 8.28 1 8.28 6.97 0.0172
B-Speed 0.44 1 0.44 0.37 0.5488
C-Feed rate 7.74 1 7.74 6.51 0.0207
AB 4.083E-004 1 4.083E-004 3.434E-004 0.9854
AC 0.33 1 0.33 0.27 0.6069
BC 1.41 1 1.41 1.18 0.2918
A^2 3.55 1 3.55 2.99 0.1020
B^2 13.55 1 13.55 11.40 0.0036
C^2 0.16 1 0.16 0.13 0.7200
Residual 20.21 17 1.19
Table-5. ANNOVA table for ovality.
Source Sum of
squares df
Mean square
F value
p-value Prob > F
Model 4.63 6 0.77 3.79 0.0110 significant
A-Tool
Diameter 1.08 1 1.08 5.28 0.0325
B-Speed 2.18 1 2.18 10.69 0.0038
C-Feed rate 0.85 1 0.85 4.19 0.0540
AB 0.075 1 0.075 0.37 0.5502
AC 0.12 1 0.12 0.59 0.4517
BC 0.33 1 0.33 1.60 0.2198
Residual 4.07 20 0.20
Cor Total 8.70 26
Table-6. Predicted results vs experimental results.
Group No.
Drilling parameter
(Coded factors) Responses
Drill dia
(mm) Speed (rpm) Feed rate (mm/rev)
Thrust force
(N) Surface roughness (µm) Ovality (%)
Expt Pred Expt Pred Expt Pred
1 1 1 1 158.569 158.93 5.72 5.314 2.3 1.816
2 1 1 2 185.913 194.8 5.8 5.984 0.1 0.976
3 1 1 3 224.731 206.49 7.26 6.974 1.5 0.856
4 1 2 1 122.192 118.71 7.07 7.000 1.4 1.477
5 1 2 2 121.704 145.2 5.46 7.330 1.3 0.797
6 1 2 3 147.461 147.51 9.37 7.980 0.3 0.837
7 1 3 1 109.619 100.47 5.61 5.686 0.5 0.638
8 1 3 2 112.915 117.58 5.92 5.676 0.2 0.118
9 1 3 3 117.065 110.51 5.68 5.986 0.2 0.318
10 2 1 1 217.59 214.29 5.8 5.240 1.9 1.89
11 2 1 2 270.736 268.2 5.53 6.080 0.71 1.15
12 2 1 3 294.97 297.93 6.96 7.240 1.2 1.13
13 2 2 1 185.937 176.04 7.42 6.920 1.3 1.63
14 2 2 2 211.807 220.57 5.83 7.420 1.06 1.05
15 2 2 3 238.062 240.92 8.5 8.240 1.35 1.19
16 2 3 1 161.334 159.77 6.41 5.600 1.02 0.87
17 2 3 2 196.54 194.92 6.09 5.760 0.63 0.45
18 2 3 3 201.468 205.89 6.17 6.240 0.95 0.75
19 3 1 1 254.579 265.37 3.22 3.626 2.1 1.938
20 3 1 2 351.936 337.32 5.04 4.636 1.2 1.298
21 3 1 3 369.324 385.09 5.67 5.966 1.4 1.378
22 3 2 1 227.905 229.09 4.3 5.300 1.85 1.757
23 3 2 2 314.209 291.66 8.63 5.970 1.6 1.277
24 3 2 3 330.444 330.05 6.53 6.960 1.4 1.517
25 3 3 1 199.684 214.79 3.13 3.974 0.72 1.076
26 3 3 2 272.433 267.98 4.82 4.304 1.06 0.756
The predicted results were discussed through the Table-6 with experimental validation. The error obtained during this analysis was very less and so it was considered as acceptable model.
Figure-1. Thrust force predicted vs experimental. The experimental values and predicted values for thrust force, surface roughness and ovality were plotted in the following graphs.
Figure-2. Surface roughness - predicted vs experimental.
Figure-3. Ovality - predicted vs experimental.
Figure-4. Estimated 3D response surface plot for thrust force at a feed rate of 0.15mm/rev.
Figure-5. Estimated 3D response surface plot for thrust force at a feed rate of 0.05mm/rev.
Figure-6. Estimated 3D response surface plot for roughness at a feed rate of 0.15mm/rev.
Design-Expert® Software Force
369.324
109.619
Force = 369.324 Std # 21 Run # 21 X1 = A: Tool Diameter = 10.00 X2 = B: Speed = 600.00 Actual Factor C: Feed rate = 0.15
5.00 6.25
7.50 8.75
10.00
600.00 800.00 1000.00 1200.00 1400.00
110 180 250 320 390
F
o
rc
e
A: Tool Diameter B: Speed
Design-Expert® Software
Force
369.324
109.619
Force = 109.619 Std # 7 Run # 7 X1 = A: Tool Diameter = 5.00 X2 = B: Speed = 1400.00
Actual Factor C: Feed rate = 0.05
5.00 6.25
7.50 8.75
10.00
600.00 800.00 1000.00 1200.00 1400.00
100 142.5 185 227.5 270
Fo
rc
e
A: Tool Diameter B: Speed
Design-Expert® Software Roughness
9.37
3.13 Roughness = 9.37 Std # 6 Run # 6 X1 = A: Tool Diameter = 5.00 X2 = B: Speed = 1000.00 Actual Factor C: Feed rate = 0.15
5.00 6.25
7.50 8.75
10.00
600.00 800.00 1000.00 1200.00 1400.00
4.2 5.5 6.8 8.1 9.4
R
o
u
ghne
ss
Figure-7. Estimated 3D response surface plot for roughness at a feed rate of 0.05mm/rev.
Figure-8. Estimated 3D response surface plot for ovality at a feed rate of 0.15mm/rev.
Figure-9. Estimated 3D response surface plot for ovality at a feed rate of 0.05mm/rev.
Figures 4 and 5 illustrate the surface plot for thrust force by varying the two variables, Spindle speed
and diameter of the drill by keeping the feed as constant. Similarly Figures 6 and 7 illustrate the surface plot for roughness and Figures 8 and 9 for ovality.
From the Figures 10, 11 and 12 it is clear that, as the drill diameter and feed rate increases the drilling force also increased, but spindle speed is having negative effect on thrust force.
The effect of these parameters on roughness of the drilled hole surface is shown in Figures 13, 14 and 15. It indicates that the effect of spindle speed on roughness is very less. But as the drill diameter increases, the roughness value decreased and the feed rate is having positive effect on roughness, that is, the roughness value increased along with feed rate.
Effect of the drilling parameters on ovality is shown in Figures 16, 17 and 18. Increasing spindle speed and feed rate decrease the percentage of ovality, but the drill diameter increases the ovality of the drilled hole.
Figure-10. Effect of tool diameter on thrust force at constant speed and feed rate.
Figure-11. Effect of speed on thrust force at constant tool diameter and feed rate.
Design-Expert® Software Roughness
9.37
3.13 X1 = A: Tool Diam eter X2 = B: Speed Actual Factor C: Feed rate = 0.05
5.00 6.25 7.50 8.75 10.00 600.00 800.00 1000.00 1200.00 1400.00 3.1 4.2 5.3 6.4 7.5 R o ug hn es s
A: Tool Diameter B: Speed
Design-Expert® Software Ovality
2.3
0.1
X1 = A: Tool Diameter X2 = B: Speed Actual Factor C: Feed rate = 0.15
5.00 6.25 7.50 8.75 10.00 600.00 800.00 1000.00 1200.00 1400.00 0.2 0.525 0.85 1.175 1.5 O v a lit y
A: Tool Diameter B: Speed
Design-Expert® Software Ovality
2.3
0.1
Ovality = 2.3 Std # 1 Run # 1 X1 = A: Tool Diameter = 5.00 X2 = B: Speed = 600.00 Actual Factor C: Feed rate = 0.05
5.00 6.25 7.50 8.75 10.00 600.00 800.00 1000.00 1200.00 1400.00 0.5 0.95 1.4 1.85 2.3 O v al it y
A: Tool Diameter B: Speed
Design-Expert® Software Force
Design Points
X1 = A: Tool Diameter Actual Factors B: Speed = 1000.00 C: Feed rate = 0.10
5.00 6.25 7.50 8.75 10.00
100 167.5 235 302.5 370
A: Tool Diameter
Fo rc e One Factor Design-Expert® Software Force Design Points
X1 = B: Speed Actual Factors A: Tool Diameter = 7.50 C: Feed rate = 0.10
Figure-12. Effect of feed rate on thrust force at constant speed and tool diameter.
Figure-13. Effect of tool diameter on roughness at constant speed and feed rate.
Figure-14. Effect of speed on roughness at constant feed rate and tool diameter.
Figure-15. Effect of feed rate on roughness at constant speed and tool diameter.
Figure-16. Effect of tool diameter on ovality at constant speed and feed rate.
Figure-17. Effect of speed on ovality at constant feed rate and tool diameter.
Design-Expert® Software Force
Design Points
X1 = C: Feed rate Actual Factors A: Tool Diam eter = 7.50 B: Speed = 1000.00
0.05 0.07 0.10 0.13 0.15
100 167.5 235 302.5 370
C: Feed rate
Fo
rc
e
One Factor
2 2
Design-Expert® Software Roughness
Design Points
X1 = A: Tool Diam eter Actual Factors B: Speed = 1000.00 C: Feed rate = 0.10
5.00 6.25 7.50 8.75 10.00
3.1 4.675 6.25 7.825 9.4
A: Tool Diameter
Rou
g
hn
es
s
One Factor
Des ign-Expert® Software Roughness
Des ign Points
X1 = B: Speed Actual Factors A: Tool Diameter = 7.50 C: Feed rate = 0.10
600.00 800.00 1000.00 1200.00 1400.00 3.1
4.675 6.25 7.825 9.4
B: Speed
R
o
u
ghne
s
s
One Factor
Design-Expert® Software Roughness
Design Points
X1 = C: Feed rate Actual Factors A: Tool Diameter = 7.50 B: Speed = 1000.00
0.05 0.07 0.10 0.13 0.15
3.1 4.675 6.25 7.825 9.4
C: Feed rate
Rou
g
hn
es
s
One Factor
Design-Expert® Software Ovality
Des ign Points
X1 = A: Tool Diameter Actual Factors B: Speed = 1000.00 C: Feed rate = 0.10
5.00 6.25 7.50 8.75 10.00
0.1 0.65 1.2 1.75 2.3
A: Tool Diameter
Ov
al
it
y
One Factor
Design-Expert® Software Ovality
Design Points
X1 = B: Speed Actual Factors A: Tool Diameter = 7.50 C: Feed rate = 0.10
600.00 800.00 1000.00 1200.00 1400.00 0.1
0.65 1.2 1.75 2.3
B: Speed
O
v
a
lit
y
Figure-18. Effect of feed rate on ovality at constant speed and tool diameter.
The experimental results were analyzed with Analysis of Variance (ANOVA) which is used to investigate the influence of the parameters [1] affecting the performance and quality of drilling namely, drill diameter, spindle speed and feed rate. By performing this analysis, it can be decided which independent factor dominates over the other. It can be observed from the Tables 7, 8 and 9 that the drill diameter has the highest influence on the thrust force and roughness, spindle speed has the highest influence on ovality.
Main effect plots of S/N ratios for thrust force, surface roughness and ovality are shown in Figures 19, 20 and 21.
Table-7. S/N ratios for force.
Table-8. S/N ratios for roughness.
Table-9. S/N ratios for ovality.
10.0 7.5 5.0 -42 -44 -46 -48 -50
1400 1000 600
0.15 0.10 0.05 -42 -44 -46 -48 -50
Drill dia
M
e
a
n
of
SN
r
a
ti
os
Speed
Feed rate
Main Effects Plot for SN ratios Data Means
Signal-to-noise: Smaller is better
Figure-19. Main effect plots for S/N ratios-force.
Design-Expert® Software Ovality
Design Points
X1 = C: Feed rate Actual Factors A: Tool Diameter = 7.50 B: Speed = 1000.00
0.05 0.07 0.10 0.13 0.15
0.1 0.65 1.2 1.75 2.3
C: Feed rate
Ov
a
lit
y
One Factor
Taguchi Analysis: Ovality versus Drill dia, Speed, Feed rate
Response Table for Signal to Noise Ratios Smaller is better
Level Drill dia Speed Feed rate 1 1.48866 -2.39409 -4.25000 2 0.06538 -3.40966 0.06328
3 -2.92404 4.43376 2.81672 Delta 4.41270 7.84342 7.06672 Rank 3 1 2
Taguchi Analysis: Roughness versus
Drill dia, Speed, Feed rate
Response Table for Signal to Noise Ratios Smaller is better
Level Drill dia Speed Feed rate 1 -14.99 -15.02 -14.65 2 -16.53 -15.33 -14.42 3 -13.80 -14.96 -16.25 Delta 2.73 0.37 1.83 Rank 1 3 2
Taguchi Analysis: Force versus Drill dia, Speed, Feed rate
Response Table for Signal to Noise Ratios
Smaller is better
Level Drill dia Speed Feed rate 1 -42.36 -48.00 -45.10
2 -46.78 -45.46 -46.35 3 -49.07 -44.74 -46.75
10.0 7.5 5.0 -14 -15 -16 1400 1000 600 0.15 0.10 0.05 -14 -15 -16 Drill dia M e a n of S N r a ti os Speed Feed rate
Main Effects Plot for SN ratios Data Means
Signal-to-noise: Smaller is better
Figure-20. Main effect plots for S/N ratios - roughness.
10.0 7.5 5.0 5.0 2.5 0.0 -2.5 -5.0 1400 1000 600 0.15 0.10 0.05 5.0 2.5 0.0 -2.5 -5.0 Drill dia M e a n of SN r a ti os Speed Feed rate
Main Effects Plot for SN ratios Data Means
Signal-to-noise: Smaller is better
Figure-21. Main effect plots for S/N ratios - ovality. CONCLUSIONS
Second order response surface models have been developed for correlating various drilling parameters with respect to thrust force, surface roughness and ovality of the drilled holes. The developed models are significant at 95% confidence level, and so they can be effectively used for drilling of Al / SiC metal matrix composites within the range of the process parameters.
Using RSM, different 3D response surfaces are plotted to show the effect of the process parameters on the response of interest.
Analysis of Variance revealed the dominant factors that influence the performance of the drilling process and quality of the drilled hole surfaces like ovality and roughness. From the analysis it was concluded that the drill tool diameter is having high influence on drilling force and feed rate on roughness of the drilled hole surfaces. Spindle speed is having high influence on the percentage ovality of the drilled holes.
REFERENCES
[1] Ashok Kr. Mishra, Rakesh Sheokand, Dr. R K Srivastava. 2012. Tribological Behaviour of Al-6061 /
SiC Metal Matrix Composite by Taguchi’s Techniques. International Journal of Scientific and Research Publications. 2(10).
[2] Hari Singh, Abhishek Kamboj, Sudhir Kumar. 2014. Multi Response Optimization in Drilling Al6063/SiC/15% Metal Matrix Composite, World Academy of Science. Engineering and Technology International Journal of Chemical, Nuclear, Materials and Metallurgical Engineering. 8(4).
[3] B. M. Umesh Gowdaa, H. V. Ravindraa, S. Prathik Jainb, Mohinder N Raja, G. V. Naveen Prakeshc, G. Ugrasend. 2014. Comparative study of surface roughness and ovality of aluminium silicon nitride material using MRA GMDH and pattern recognition technique in drilling. 3rd International Conference on
Materials Processing and Characterisation (ICMPC 2014), Procedia Materials Science. 6: 1770-1779. [4] Yahya Altunpak, Mustafa Ay, Serdar Aslan. 2012.
Drilling of a hybrid Al/SiC/Gr metal matrix composites. The International Journal of Advanced Manufacturing Technology. 60(5-8): 513-517.
[5] P. Kishore Kumar; Dr. K. Kishore; Prof. P. Laxminarayana. 2013. Prediction of Thrust Force and Torque in Drilling On Aluminum 6061-T6 Alloy. International Journal of Engineering Research and Technology (IJERT). 2(3).
[6] A. Muniaraj, Sushil Lal Das and K. Palanikumar. 2012. Influence of drilling parameters on thrust force in drilling of sic and graphite reinforced aluminium matrix composites by step drill. Proceedings of the National Conference on Trends and Advances in Mechanical Engineering, YMCA University of Science and Technology, Faridabad, Haryana.
[7] Taskesen K. Kutukde. 2013. Analysis and optimization of drilling parameters for tool wear and hole dimensional accuracy in B4C reinforced Al-alloy, Trans. Nonferrous Met. Soc. China. 23: 2524-2536.
[8] Ahmet Taþkesen, Kenan Kütükde. 2013. Optimization Of The Drilling Parameters For The Cutting Forces In B4c-Reinforced Al-7xxx-Series Alloys based On the Taguchi Method, Materiali in tehnologije / Materials and technology. 47: 2, 169-176.
metal matrix composites based on Taguchi techniques. Journal of materials processing technology. 196: 332-338.
[10]Biren Desai, Jaypalsinh Rana, Hiren Gajera. Study of Hole Quality Parameters In Drilling Of Carbon Fiber Reinforced Plastics (CFRP) Using Design Of Experiments. Journal of Information, Knowledge and Research in Mechanical Engineering. 02(02).
[11]S. Madhavan, S. Balasivanadha Prabu. 2012. Experimental investigation and Analysis of Thrust Force in Drilling of Carbon Fibre Reinforced Plastic Composites using Response Surface Methodology. International Journal of Modern Engineering Research (IJMER). 2(4): 2719-2723.
[12]A. Arun Premnath, T. Alwarsamy, T. Abhinav, C. Adithya Krishnakant. 2012. Suraface Roughness Prediction by Response Surface Methodology in Milling of Hybrid Aluminium Composites. International Conference on Modeling Optimization and Computing, Procedia Engineering. 38: 745-752. [13]B. Ganesh Babu, V. Selladurai and R. Shanmugam.
2008. Analytical Modeling Of Cutting Forces Of End Milling Operation On Aluminum Silicon Carbide Particulate Metal Matrix Composite Material Using Response Surface Methodology. ARPN Journal of Engineering and Applied Sciences. 3(2).