Full Length Research Article
MATHEMATICAL MODELING OF STRUCTURAL CHANGESIN THE INDUSTRIALSECTOR
1
Sokhibmalik Khomidov and
2Akmal Nizamov
1
Doctoral Researcher, Department of Macroeconomics, Tashkent State University of Economics, 49,
Uzbekistan St., 100003 Tashkent, Uzbekistan
2
Department of Regional Economy and Manegment, The National University of Uzbekistan Named
After Mirzo Ulugbek, 4, Universitetskaya St.,100174 Tashkent, Uzbekistan
ARTICLE INFO ABSTRACT
The role of industry in general and mainly processing industry in maintaining economic growth is placed under the thorough point of view in this paper. Brief review of concerned literature is performed as well. Trigonometric function has been applied in measuring the structural changes in industrial sector. Practical unit of the paper deals with structural changes estimating of the structure of industry sector of Uzbekistan. Econometric analysis of industry output influence on gross domestic product has been conducted and final conclusions have been worked out in the paper.
Copyright©2017, Sokhibmalik Khomidov and Akmal Nizamov. Thisis an open access article distributed under the Creative Commons Attribution License, which permits unrestricted use, distribution, and reproduction in any medium, provided the original work is properly cited.
INTRODUCTION
The industry and its structural changes obtain significant importance in maintaining the sustainable economic growth. The experience of developing and newly industrial states shows that the economic achievements in those countries are at a great extent explained with the deep structural changes in the industry, especially in the processing industry. In general, a lot of researches (Lall, 2000; Szirmai and Verspagen, 2011; McMillan and Rodrik, 2011; Lavopa and Szirmai, 2012; Szirmai, Naudé and Alcorta, 2013) determine processing industry as the main driving force of the economic growth. Researches having examined the issue such kind of relationship in occurrence of the higher labor productivity in processing industry and as a result the stable growth of output has been defined.
The authors Lavopa and Szirmai (2012) consider processing industry as the mean of solving effectively such problems as providing required market equilibrium, improving competitiveness of economy, localization of production, employment and rising population income. Especially, processing industry has the specific importance in creating job places. Asexperts mention, creating one workplace in processing industry results in creating two or three workplaces in other sectors. However, complicated global economic processes taking place in the world economy for the last years have been causing serious structural changes in the countries’ industry sector. This, in turn, aroused the necessity of investigating the case of sustainable industry development and structural changes of its components. This paper studies the industrial sector development and the structural changes in industry of Uzbekistan, as the country which provides high growth rate of GDP by means of implementing wide structural changes in economy, particularly in industry in the last years.
*Corresponding author: Sokhibmalik Khomidov
Doctoral Researcher, Department of Macroeconomics, Tashkent State University of Economics, 49, Uzbekistan St., 100003 Tashkent, Uzbekistan
ISSN: 2230-9926
International Journal of Development Research
Vol. 07, Issue, 02, pp.11705-11709, February,2017
DEVELOPMENT RESEARCH
Article History:
Received 02nd November, 2016
Received in revised form 29th December, 2016
Accepted 19th January, 2017
Published online 28th February, 2017
Key Words:
Literature review
The notion “structure” refers to the core meaning of the structural change. In main sources the “structure” (from Latin “structura” - structure, system, location, order) is defined as stable interrelations between elements of the system and the internal form of the system and its composition. Main issues of the studies that are available have been under point of view of the most researchers, including Nobel prize-winners Leontief (1953), Kuznets (1966) and Solow (1964) as well. In particular, Solow (1964) empirically investigated the impact of changes in share of production factors in the industrial structure on economic growth rate. Similar researches (Pasinetti, 1981; Targetti, 2005; Guo, 2007; Lin and Lu, 2014; Libanio and Moro, 2015) have been deeply conducted where the quantity analysis of impact of processing industry on economic growth carried out in case of several countries (Latin America, China). Kaldor’s scientific researches on the issue have been found significantly attractive of all studies and most of above mentioned works are based upon his scientific conclusions. In his researches Kaldor (1957) argued the reasons of high labor productivity exactly in the processing industry and its impact on the economic growth.
The typical feature of the most considered researches is that these studies have directly determined the impact of structural changes, especially of processing industry and its structural changes on the economic growth. However, the issues of measuring the structural changes in industry are not considered as a separate research object. The researches in some scientific sources (Moore, 1978; Vikström, 2001; Dietrich, 2012; Estola, 2011; Bonino and Willebald, 2013; Cortuk and Singh, 2013) serve as fundamental for the aim set. In particular, in his researches Moore (1978) investigated the structural changes in Yugoslavian industry as well as Vikström (2001) made the same analysis of structural changes in Sweden industry and economy. Our research is different from the researches above, and studies the structural changes in the general industry and sets marginal conditions to the index of structural changes.
Measurng structural changes
For measuring structural changes we use “cosine-coefficient” method applied in the researches of Moore (1978) and Vikström (2001). This method is based on calculation of angle cosine between the vectors. The method referred is interpreted in the case of the following two vectors.
For instance, A
s1,A,s2,A
and B
s1,B,s2,B
integral vectors are given. In this case cosine between angles is equal tofollowing:
B
A
B
A
.
,
)
cos(
, where0
………(1)If to insert to (1) appropriate coordinates of structural vectors in more detail, we’ll receive the following formula:
2, 2 2 , 1 2 , 2 2 , 1 , 2 , 2 , 1 , 1 , 2 , 1 , 2 , 1 , 2 , 1 , 2 , 1 , . , , , , . , ) cos( B B A A B A B A B B A A B B A A s s s s s s s s s s s s s s s s B A B A
……….(2)
Now, we’ll examine the issue of calculating angle cosine between vectors in n-dimensional space. Let’s assume, in time interval
t
1;
t
2
a vector, set structure of which consists of
1 1 1 1
,
,...,
2 1 t n t t t
x
x
x
X
coordinates, changes after certain period to a vector setstructure of which consists of 2
2,
2,...,
2
2 1 t n t t tx
x
x
X
coordinates. In this case, a cosine of turning angle between vectors equals to the following expression:
21 2 2 2 2 1 2 1 2 2 2 2 1 2 2 1 1 1 2 1 2 1 ) ( . . . ) ( ) ( ) ( . . . ) ( ) ( . . . , ) cos( 2 2 2 1 1 1 2 1 2 1 2 1 2 1 2 1 2 1 2 1 t n t t t n t t t n t n t t t t n i t i n i t i t i n i t i t t t t x x x x x x x x x x x x X X X X X X X X
………(3)
This expression represents the strength of structural changes. Here,
cos(
)
is a cosine of turning angle of structural vector, and
1 2
2 1
,
t t
X
X
is a scalar multiplication of 1 1t
X
and 2 2t
X
vectors,i
1
,
n
.Here, it satisfies the conditions where
1
1 1 2 1
n i t i n i t iX
X
and0
1
t2
1
i t i
X
X
.Dynamics of structural changes in industrial sector in Uzbekistan: empirical results
[image:3.595.131.465.157.217.2]The average annual growth rate of the industrial production of Uzbekistan and the index of structural changes are shown in Table 1. According to it, the average annual growth rate of industrial production has been in high level (10.6%) during 2006-2010. For several years serious changes have occurred in the structure of industrial sector. Notably, in 2014 the industries as mechanical engineering and metal processing sector (19.2%), food industry (15.1%) and light industry (14.1%) were dominants.
Table 1. Growth rates of industry and index of structural changes in the Uzbekistan
Period Average annual growth rate of industrial production (%)
Index of structural changes (coefficient)
1996-2000 4.4 0.97
2001-2005 7.7 0.95
2006-2010 10.6 0.96
2011-2014 8.1 0.97
Source: Author’s calculations based on the data of the State Statistical Committee of Uzbekistan
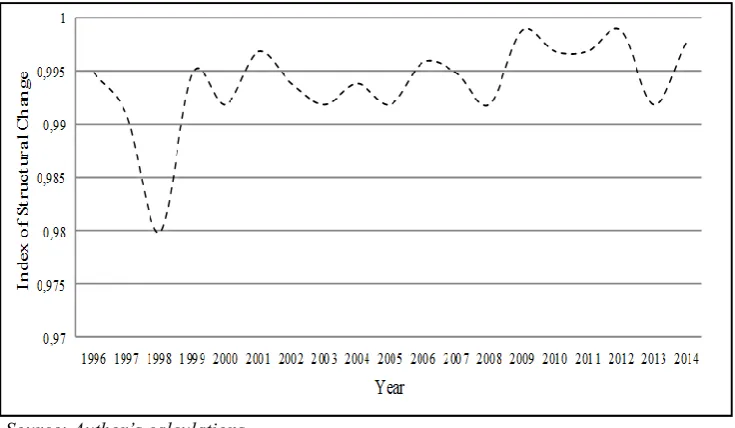
It should be emphasized that changing of the share of separate sectors in the structure of industry cannot give a clear conclusion about the whole structural changes in the industry. Therefore, the dynamics of generalized index of structural changes in industry is given below. The index of structural changes calculated by formula (3) has revealed the highest values almost for all years (see Figure 1).
In accordance with the results obtained, the index of structural changes in industry made up 0.994 in average during 1996-2014.
Factors of structural changes in industry and economic growth
The positive changes in the country’s structure of industry and sustainable growth rate of production are explained with the following main factors:
The state programs approved on sustainable development of industry;
Macroeconomic sustainability and favorable investment environment of the country;
Free economic and special economic zones created in the regions of the country;
Commissioning of high-technology and modern industrial objects and production capacities;
Further enlargement of the scope of production localization;
Financial support of local production enterprises.
[image:3.595.129.497.459.673.2]Source: Author’s calculations.
Figure 1. Dynamics of structural changes in industrial sector (for 1996-2014)
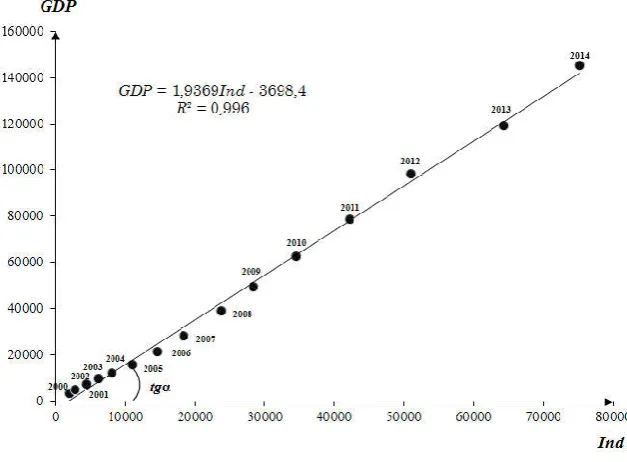
As analyses show that through the generalized index of structural changes in industrial sector expresses the outcome of changes in the structure, however, it does not serve for making firm conclusion on development of industry. Particularly, the correlation coefficient between the average annual growth rate of industrial production and the index of structural changes in the sector is 0.34, consequently, the interrelation between these two parameters is very low. However, there is a positive correlation between industrial production and GDP. According to it, the growth of industrial production results in rising of GDP volume (Figure 2). The
GDP
1
.
9369
Ind
3698
.
4
function represents the regression equation gained by econometrical analyses, and here, GDPAs shown in the graph, the regression coefficient is the angle tangent tgα (tgα=ΔGDP/ΔInd), according to which the growth of industrial production to 1 unit results in the growth of GDP to 1.9369 point or approximately to 2 points.
[image:4.595.139.453.92.323.2]Source: Author’s calculations.
Figure 2. Correlation between industrial production and GDP (for 2000-2014 years, R2 - determination coefficient)
The determination coefficient is equal to 0.996 which indicates that 99.6% of GDP total changeability is equal to the share of industrial production in regression equation.
Conclusions
The research and results of analysis show that the country’s industry considerably affects the GDP dynamics. However, the index of structural changes in the industrial sector does not serve for making firm conclusion on development of industry. As it only quantitatively generalizes the level of positive or negative changes occurred in the structure of industry. Therefore, there is no exact correlation between the presented index and production.
Nevertheless, in the structure of production the absolute changes such as transfer of low-technology production to medium-technology production, transfer of middle-medium-technology production to high-medium-technology production, and shifting of sectors with low labor productivity towards the sectors with high labor productivity directly affects the growth of production. In addition, as all absolute changes in the structure are expressed in the volume of industrial production, there is a strong correlation (correlation coefficient is 0.998) between this index and economic growth.
REFERENCES
Bonino N. and Willebald H. 2013. Structural Change and Long-Term Patterns. A Methodological Proposal For Uruguay In The Very Long Run. IV Jornadas Académicas-XV Jornadas de Coyuntura Facultad de Ciencias Económicas y de Administración. Cortuk O. and Singh N. 2013. Analyzing the Structural Change and Growth Relationship in India: State-level Evidence. Working
paper (University of California, Santa Cruz. Dept. of Economics).
Dietrich А. 2012. Does Growth Cause Structural Change, or is it the Other Way Round? A dynamic panel data analysis for seven OECD countries. Empirical Economics, December 2012, Volume 43, Issue 3, pp 915-944.
Estola M. 2011. Measuring the growth and the structural change of a multi-sector economy. Presentation for Econophysics, New Economy & Complexity, International Conference at 26-28 May.
Guo D. 2007. The leading role of manufacture in regional economic growth in China: A spatial econometric view of Kaldor’s law. Workshop on Agglomeration and growth in knowledge-based societies Kiel, Germany, April 20-21.
Kaldor, Nicholas, 1957. A Model of Economic Growth, Economic Journal, vol. 67, pp. 591- 624.
Kuznets, 1966. Modern Economic Growth: Rate, Structure, and Spread. New Haven and London: Yale University Press, 1966. xvii + 529 pp.
Lall, S., 2000. Technological Change and Industrialization in the Asian Newly Industrializing Economies: Achievements and Challenges. In: Technology, Learning and Innovation: Experiences of Newly Industrializing Economies, eds. Kim, L. and Nelson, R.R., Cambridge: Cambridge University Press.
Leontief W. 1953. Studies in the Structure of the American Economy. The Journal of Business of the University of Chicago, Vol. 26, No. 4 (Oct., 1953), pp. 267-269.
Libanio G. and Moro S. 2015. Manufacturing Industry and Economic Growth in Latin America: A Kaldorian approach. Lin Ch.Ch. and Lu Sh. Sh. 2014. Structural Change, Drivers and Growth. Version: February 10.
McMillan, M., and Rodrik, D., 2011. Globalization, Structural Change and Productivity Growth. IFPRI and Harvard Kennedy School working paper, February.
Moore J. H., 1978. A Measure of Structural Change in Output. Review of Income and Wealth, 24(1).
Pasinetti, L. 1981. Structural Change and Economic Growth - A Theoretical Essay on the Dynamics of the Wealth of the Nations. Cambridge University Press. Cambridge, UK.
Solow R.M. 1964. Capital, Labor, and Income in Manufacturing. Conference on Research in Income and Wealth. Princeton University Press.
Szirmai, A., and Verspagen, B., 2011. Manufacturing and Economic Growth in Developing Countries, 1950-2005. UNU-MERIT Working Paper Series 2011-069. Maastricht, The Netherlands: United Nations University, Maastricht Economic and Social Research Institute on Innovation and Technology.
Szirmai, A., Naudé, W., and Alcorta, L., 2013. Introduction and Overview: The Past, Present and Future of Industrialization. In Pathways to Industrialization in the Twenty-First Century: New Challenges and Emerging Paradigms, eds. Szirmai, A., Naudé, W., and Alcorta, L. Oxford, UK: Oxford University Press.
Targetti F. 2005. Kaldor’s Contribution to Development Economics. Economic Development and Change, 2005.
Vikström, Peter 2001. Long term patterns in Swedish growth and structural change: 1870-1990, Research Memorandum GD-48, Groningen Growth and Development Centre.