ORIGINAL RESEARCH ARTICLE
INCREASING TEACHER TEACHING ABILITY AND TEACHING
LEARNING PROCESS AT SCHOOL
*Maifalinda Fatra
Lecturer
State Islamic University
, Jakarta, Indonesia
ARTICLE INFO ABSTRACT
This research aims to describe and analyses about the increasing teacher teaching ability and teaching learning process quality at school through developing the teachers’ competences and the teacher educational background. The research method uses quantitative analyses is a descriptive analyses, correlation analyses and regression, quantitative analyses used in research is to find out relationship the teacher competence, teacher educational background toward teacher teaching ability and teaching learning process quality. Data collecting of the research uses questionnaire, the population of the research is the teacher at State Islamic Elementary Schools South Jakarta, the research sample of 143 teachers who served at State Islamic Elementary School South Jakarta. The result of the research shows that teachers competences and the teacher educational background has relationship with the teacher teaching ability and teaching learning process quality at school. The developed of teacher competence and increased quality the teacher educational background will make a positive impact toward teacher competence quality and teaching learning process quality at school.
*Corresponding author:
Copyright©2017, Maifalinda Fatra. This is an open access article distributed under the Creative Commons Attribution License, which permits unrestricted use, distribution, and reproduction in any medium, provided the original work is properly cited.
INTRODUCTION
The quality of teaching and learning process become the priority for every school in creating the quality of education. To gain the quality of teaching and learning need the role of any aspect, and one of them is a teacher. In the educational process, teacher constitutes one of the most important, as well as purposes component, curriculum, method, facilities, environment and evaluation (Nurdin, 2008). Without teacher quality never make the need of the quality of teaching learning process at school. The ability if teacher teaching quality was gain by the long process, having a lot of factors, one of the factors is their competence and the equivalency of their educational background. Supriadi in Mulyasa (2007), expose the quality of education seeing from the achievement of their students in based on the quality of the teachers, that of 34% for developing country and 36 for modern industrial countries. Research conducted by Heynmen and Loxely, in 1983 around 29 countries, found that the input concerning to the quality of education, speciall from the students achievement-based, is that 1/3 % affected from the teachers quality. The quality of
education can be made of the low of the teacher quality. The low quality of the teacher emerge the new problem in teaching learning process at school. This problem can be seen from many teacher learning process at school seem at the low quality, beside the low of students’ achievement. Hamalik (2008) said that teachers who have a good competence will create more effective of environmental studies, joyful teaching learning and will be able to create and class management, so then students will be more optimal in the process. Teachers become dominant factor in the variety of teaching learning process at school for then teachers need a good competences and equivalency educational background. Teachers must explore deeply a special major. Competence standard needed by the teachers in doing their teaching in school is educators. Based on the government notes Number 19, 2005, article 28 that educator must have a qualification and competences as the learning agents, have a good physical and spiritual condition as well as they have ability in creating national educational purposes. It is a need of teachers competence in terms of creating and developing and demonstrating educational behavior, not only studying a certain teaching skill rather than
ISSN: 2230-9926
International Journal of Development Research
Vol. 07, Issue, 08, pp.14315-14323, August,2017
Article History:
Received 19th May, 2017
Received in revised form 05th June, 2017
Accepted 20th July, 2017
Published online 30th August, 2017
Citation: Maifalinda Fatra, 2017. “Increasing teacher teaching ability and teaching learning process at school”, International Journal of Development
Research, 7, (08), 14315-14323.
ORIGINAL RESEARCH ARTICLE Open Access
Keywords:
the combination and applying skills and knowledge that correlates each other in real behavior (Mulyasa, 2009). Other than that, achieving a quality teaching process will be achieved when theirs have a good educational background. Educational background can be seen from two aspect; equivalency of the major with their works and the level of their education. Educational background a teacher will influence to classroom teaching learning process such as determining how to teach and evaluate (Diaz, 2006). Suwarno (2006) said that educator must have minimum qualification and certification based on their background and the subject of teaching, good physical and non-physical condition as well the ability to create national educational purposes. According to Martinis (2006) said that professional teachers have not only academic qualification but also own good competence. It means that they have knowledge, skills and good behavior in doing their works.
Teachers will not have a good teaching material when they have different educational background. It’s more effective teachers between those have the equivalency educational background rather than those who have different educational background to which they teacher the subjects. Having good teaching material and knowledge affects to the process of teaching of the subject teachers (Usman, 2007). Then, it find it hard to find the quality of teacher teaching and also high professional teaching when they are not has competence and good educational background. In this research, moreover, the writer would like to investigate and analyses increasing teacher teaching ability and teacher teaching learning process at School through teacher competence and their educational background. Specifically, the writer would like to find out; (1) the degree of teacher competence, educational background, teachers’ ability in teaching and learning process at school (2). The relationship between teacher competence and the teaching ability (3) the relationship between teacher educational background and teacher teaching ability at class (4) the relationship between teacher teaching ability and teacher teaching learning process at school (5) the relationship between teacher competence and teacher teaching learning process (6) the relationship teacher educational background and teacher teaching learning process (7) Dominant factor influences to teacher teaching learning process at school.
MATERIALS AND METHODS
Research Method
The method of analyses of this research is quantitative research. According to Creswell (2008), quantitative research is a kind of educational research at which researcher find out what would be observed, presenting special question, make question shortly, collect the data quantitatively, analyze numerical statistically, and find inquire objectively and non-bias data. Kerlinger (2010) said that the proper quantitative approach is used to see the correlation between those variables. Quantitative research method used in this research in the reason of that the focus of the research is that describing teacher competence, teacher educational background, teacher teaching ability and teacher teaching learning process at school. The choosing of the method is under the consideration of research objectives are finding out information correlates to current condition and finding factual information of individual teacher as the object of the analyses.
Data analysis
Quantitative research method used in this research uses descriptive analysis and inferential analysis. Inferential analysis in this research use correlation analyses and regression analyses. Inferential analysis used to analyze the correlation of variables teacher competence, teacher educational background, teacher teaching ability and teacher teaching learning process at school.
Data Collection Technique
Data collecting technique of the research is spreading questionnaire. The questionnaire is one way of the finding answers to research questions (Kerlinger, 2010), and Robin and Babbie (2001) said survey can cover a larger aspect and easily covered without the existence of the researcher. The data of the questionnaire from the respondents of State Islamic Elementary school South Jakarta Indonesia.
Population and Sample
The population of the research is all those teachers of the state Islamic elementary school South Jakarta Indonesia, a total of 143 teachers who served at elementary school South Jakarta as the research sample. Sample of the research around 143 teachers based on Singarimbun and Effendi (1989) theories that the normal and big sample is that normally distributed is around > 30 cases, and when the analysis used is the correlation analysis so then the sample should be taken is > 20 cases. According to Airasian,et.al., (2012) shows that sample 10-20% from the population is enough to be researched.
Research Instruments
with the total score in the value of corrected item total correlation is bigger or and the same as 0.41 (Santoso, 2000). Correlation values between items and total score higher than correlation value 0.25 (Nunally, 1978). The index trust of Alpha Cronbach was used to find the index of items trust is 0.6, the alpha value of 0.60 always used by the researcher as the index of trust in any kind of analysis (Majid, 1990). Then, in this research, the alpha value higher than 0.60 will be used, reliability test of all items or any question used in this research is considered to be reliable when the Alpha Cronbach is > 0.6.
Research Result
Level of Teacher Competence, Educational Background, Teacher Teaching Ability, and Teaching Learning Process
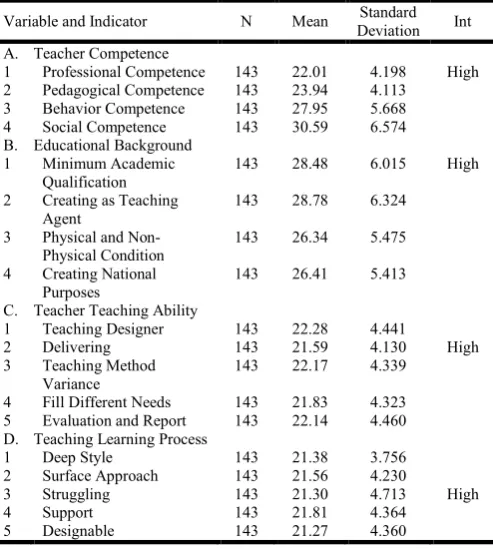
[image:3.595.40.287.387.662.2]Analyses used to find out the level of teacher competence, educational background, teacher teaching ability, and teaching learning process apply descriptive analyses. This interpretation was used by a few previous researchers such as Norasmah (2002), the values ranging from 4.01 to 5.00 show a high level of practice, the value ranging from 3.01 to 4.00 show a moderately high, the value ranging from 2.01 to 3.00 show a moderately low, the value ranging from 1.00 to 2.00 show a low level. Descriptive analysis of the four variables can be seen at the table 1 below:
Table 1. Descriptive Analyses of Research Variable
Variable and Indicator N Mean Standard
Deviation Int
A. Teacher Competence
1 Professional Competence 143 22.01 4.198 High
2 Pedagogical Competence 143 23.94 4.113
3 Behavior Competence 143 27.95 5.668
4 Social Competence 143 30.59 6.574
B. Educational Background
1 Minimum Academic
Qualification
143 28.48 6.015 High
2 Creating as Teaching
Agent
143 28.78 6.324
3 Physical and
Non-Physical Condition
143 26.34 5.475
4 Creating National
Purposes
143 26.41 5.413
C. Teacher Teaching Ability
1 Teaching Designer 143 22.28 4.441
2 Delivering 143 21.59 4.130 High
3 Teaching Method
Variance
143 22.17 4.339
4 Fill Different Needs 143 21.83 4.323
5 Evaluation and Report 143 22.14 4.460
D. Teaching Learning Process
1 Deep Style 143 21.38 3.756
2 Surface Approach 143 21.56 4.230
3 Struggling 143 21.30 4.713 High
4 Support 143 21.81 4.364
5 Designable 143 21.27 4.360
From the table 1 it can been seen that teacher competence variable, form the professional competence has mean value is = 22.01, standard deviation = 4.198. Pedagogical competence indicator has mean value = 23.94, standard deviation = 4.113. Behavior competence has mean value = 27.95, standard deviation = 5.668. Social competence indicator has mean value = 30.59, standard deviation = 6.574, from the result above that teacher competence variable has high value. It means that teacher competence condition at school at good level. It can be said that teacher competence as educator from the four competences as government rules on teacher and lecturer.
Educational background variable, form the minimum academic qualification has mean value is = 28.48, standard deviation = 6.015. Teaching agent competence has mean value = 28.78, standard deviation = 6.324. Physical and non-physical competence has mean value = 26.34, standard deviation = 5.475. Ability in creating national purposes competence indicator has mean value = 26.41, standard deviation = 5.413. From the result above that teacher competence variable has high value. It means that each teacher has at school at good level. It can be said that teacher educational background has the good basic and correlate to their educational background to f their subject matter they teach. Teacher as the agent of teaching as good roles and that is in good condition of their physical and non-physical and creating teaching learning as national purpose. Teaching ability variable, form the designing teaching strategies has mean value is = 22.28, standard deviation = 4.441. Delivering competence has mean value = 21.59, standard deviation = 41.30. Teaching variance strategies competence has mean value = 22.17, standard deviation = 4.460. Teaching method variance competence indicator has mean value = 21.83, standard deviation = 4.339. Fill different needs has mean value = 21.83, standard deviation = 4.323. Evaluation and report competence has mean value = 22.14, standard deviation = 4.460. From the result above that teacher teaching ability variable has good method. Teachers have a good method in teaching learning, they are able to create teaching design, have a variant method in teaching and learning. And they have a good evaluation and report. This result proves that teachers are able to and good quality as educators during the changing process at school. Teaching process variable, form the deep style strategies has mean value is = 21.38, standard deviation = 3.756. Surface approaches competence has mean value = 21.56, standard deviation = 4.230. Struggling competence has mean value = 21.30, standard deviation = 4.713. Support competence indicator has mean value = 21.81, standard deviation = 4.364. Designable has mean value = 21.27, standard deviation = 4.360, from the result above, the research shows that teaching learning process uses deep and surface approaches in styles. There was support and good struggling of teachers during teaching process, and they have a good support at works and their responsibility at works. There was a good design of teaching and learning before doing the work at school.
The correlation between teacher competence and teacher teaching ability
To find out the correlation between teacher competence and teacher teaching ability used correlation analyses. Correlation analyses were used to find out how big correlation between two variables tested. To find out interpretation value gained from the coefficient correlation Pearson based on Cohen (1998). According to Cohen (1988) the correlation value is between + 0.1 up to + 0.29 shows a little correlation, value of between + 0.30 up to + 0.49 is middle value, and that of + 0.50 up to + 1 shows bigger correlation. The Correlation between teacher competence and teacher teaching ability can be seen at the table below:
toward p < 0.05. Moreover, teacher competence indicator has a low, middle and strong correlation toward teacher teaching ability. The low correlation can be seen from the teacher competence toward teacher teaching ability occurs in their pedagogical competence toward their filling different need was difference 0.288. The pedagogical competence indicator toward their evaluation and report is around 0.295. The social competence indicator toward teaching method variance is 0.277. The middle correlation occurs on the professional competence indicator toward teaching design: 0.458, toward their delivering ability is 0.428. Meanwhile, professional competence toward their teaching method variance is 0.325, and toward their ability in filling different need around 0.363. Teacher professional competence toward evaluation and report indicator is 0.382. Teacher professional competence toward their teaching ability is 0.459. Pedagogical competence toward their teaching design ability is 0.465. Pedagogical competence toward their ability in delivering ability is 0.369. Pedagogical competence toward their teaching ability is 0.392. Social competence correlates to their teaching design ability around 0.489. Social competence correlates to their delivering ability is 0.425. Social competence correlates to their ability in filling different need is 0.304. Social competence correlates evaluation and report is 0.363. Social competence correlates to teacher teaching ability is 0.436. Meanwhile, teacher competence toward delivering ability indicators is 0.494. Teacher competence toward teaching method variance is 0.351. Teacher competence correlates to their ability in filling different needs is 0.363. Teacher competence correlates to teaching evaluation and report is 0.416. In this research, the highest level or score of the correlation occurs in behavior competence toward teaching design as big as 0.501, teacher competence variable toward teaching design is 0.551 as big as teacher competence toward their teaching ability as big as 0.510.
From the data above, it can be concluded that whole teacher competence correlate to their teaching ability in low, middle and strong correlation to each indicators at the level of p < 0.05, from the result of the research, it can be shown that behavior competence indicators and teacher competence correlate highly to teaching design. The better teaching design can be resulted when teachers have behavior competence as well as their complete competence. So then, it can be concluded that developing and increasing teacher teaching
ability can be achieved by the increasing of teacher competence. In other words it can be said that the low competence of teachers, can reduce or lower the quality of teaching teachers in schools.
The Correlation between Educational Background and Teacher Teaching Ability
To find out The correlation between educational background and teacher teaching ability used correlation analyses. Correlation analyses were used to find out how big correlation between two variables tested.
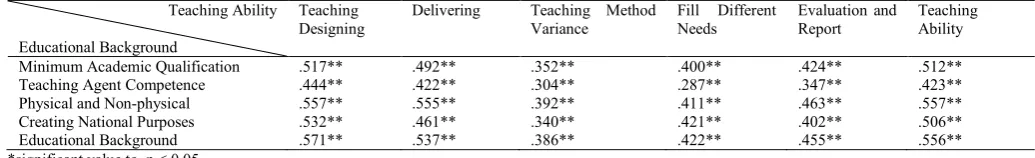
[image:4.595.39.547.70.149.2]From the table above, that educational background variable has a good correlate to their teaching ability. This correlation indicates high and significant correlation. The significance is toward p < 0.05. Moreover, educational background indicator has a low, middle and strong correlation toward teacher teaching ability. The low correlation can be seen from the educational background toward teacher teaching ability and as the teaching agent toward their filling different need was difference: 0.287. Medium correlation occurs at their minimum academic qualification toward their delivery ability is 0.492. Minimum academic qualification correlates to teaching method variance is 0.352. Minimum academic qualification correlates toward filling different needs is 0.400. Minimum academic qualification correlates toward evaluation and report is 0.424. Teaching agent competence indicator toward teaching design is 0.444. Teaching agent competence indicator correlates to their delivering ability is 0.422. Teaching agent competence indicator toward teaching method variance is 0.304. Teaching agent competence indicators correlates to evaluation and report is 0.347. Teaching agent competence indicators correlates to teaching ability is 0.423. Meanwhile, the indicator of physical and non-physical competence correlates to teaching method variance is 0.392. The indicator of physical and non-physical competence correlates to filling different needs is 0.411. The indicator of physical and non-physical competence toward evaluation and report is 0.463, and the indicator of creating national purpose competence toward their delivering ability is 0.461. The indicator of creating national purpose competence correlates to teaching method variance is 0.340. The indicator of creating national purpose competence correlates to evaluation and report is 0.402. Educational background variable correlates to
Table 2. The Correlation between Teacher Competence and Teacher Teaching Ability
Teaching Ability
Teacher Competence
Teaching Designing
Delivering Teaching Method
Variance
Fill Different Needs
Evaluation and
Report
Teaching Ability
Professional Competence .458** .428** .325** .363** .382** .459**
Pedagogical Competence .465** .369** .254** .288** .295** .392**
Behavior Competence .501** .484** .363** .317** .397** .484**
Social Competence .489** .425** .277** .304** .363** .436**
Teacher Competence .551** .494** .351** .363** .416** .510**
*significant toward p < 0.05
Table 3. The Correlation between educational background and teacher teaching ability
Teaching Ability
Educational Background
Teaching Designing
Delivering Teaching Method
Variance
Fill Different Needs
Evaluation and Report
Teaching Ability
Minimum Academic Qualification .517** .492** .352** .400** .424** .512**
Teaching Agent Competence .444** .422** .304** .287** .347** .423**
Physical and Non-physical .557** .555** .392** .411** .463** .557**
Creating National Purposes .532** .461** .340** .421** .402** .506**
Educational Background .571** .537** .386** .422** .455** .556**
[image:4.595.34.552.187.266.2]teaching method variance: 0.386. Educational background variable correlates to filling different needs: 0.422. Educational background variable correlates to evaluation and report: 0.455. The high and strong correlation occurs in minimum academic qualification towards teaching design: 0.517. The minimum academic qualification towards teaching ability is 0.512. The indicator of physical and non-physical competence toward teaching design is 0.557. The indicator of physical and non-physical competence toward their delivering is 0.555. The indicator of physical and non-physical competence toward teacher teaching ability is 0.557. The indicator of creating national purpose competence correlates to teaching design is 0.532. The indicator of creating national purpose competence correlates to teacher teaching ability is 0.506. Educational background variable correlates to teaching design: 0.571. Educational background variable correlates to delivering: 0.537. Educational background variable correlates teacher teaching ability is 0.556.
From the result of the research above, it can be concluded that the correlation between educational background and their teaching ability is high or strong. So then, it can said that developing and increasing teacher educational background has a big correlation the ability of teacher teaching ability as well as he educational background can influence to their teaching ability. In other word, those teachers who have good teaching ability are those teachers whose educational background has to do with the governmental policy as educators.
The Correlation between Teacher Teaching Ability and Teaching Process at School
To find out the correlation between teacher teaching ability and teaching process at school used correlation analyses. Correlation analyses were used to find out how big correlation between two variables tested used correlation analyses. Correlation analyses were used to find out how big correlation between two variables tested. As it can be seen from the table 4 below:
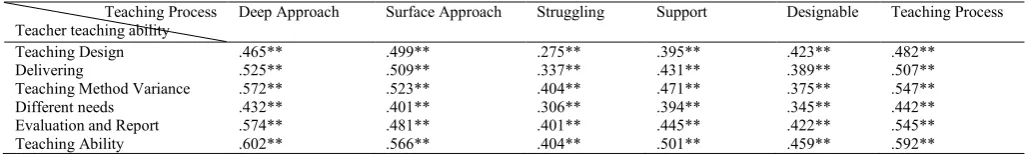
From the table above, teacher teaching ability variable has a good correlates to teaching process. This correlation indicates high and significant correlation. The significance is toward p < 0.05. Moreover, teacher teaching ability indicator has a low, middle and strong correlation toward teaching process. The low correlation can be seen from the teaching design variable toward teacher struggling was: 0.275. The Middle correlation occurs at teaching design towards deep approach is 0.465. The teaching design correlates to surface approach: 0.499. The teaching design correlates to support: 0.395. The teaching design correlates to designable: 0.423. The teaching design correlates to teaching process variable: 0.482. The indicator of delivering correlate to struggling: 0.337. The indicator of delivering correlate to support: 0.431. The indicator of delivering correlate to designable: 0.389. The indicator of
teaching method variance toward struggling indicator is 0.404. The indicator of teaching method variance toward designable is 0.375. The indicator of teaching method variance toward designable is 0.375. The Indicator of filling different needs correlates to deep approach: 0.432. The Indicator of filling different needs correlates to surface approach is 0.401. The Indicator of filling different needs correlates to struggling is 0.306. The Indicator of filling different needs correlates to support is 0.394. The Indicator of filling different needs correlates to designable is 0.345. The Indicator of filling different needs correlates to teaching process is 0.442. The indicator of evaluation and report correlate to surface approach: 0.481. The Indicator of filling different needs correlates to struggling: 0.401. The Indicator of filling different needs correlates to support: 0.445. The Indicator of filling different needs correlates to designable: 0.422. Teacher teaching ability correlates to struggling: 0.404. Teacher teaching ability correlates to designable: 0.459.
The strong correlation indicates that delivering competence correlate to deep approach: 0.525. The delivering competence correlate to surface approach: 0.509. Delivering ability competence correlates to teaching process: 0.507. The indicator of teaching method variance toward deep approach is 0.572. The indicator of teaching method variance toward surface approach is 0.547. The indicator of evaluation and report correlates to deep approach: 0.574. The indicator of evaluation and report correlates to teaching process: 0.545. The indicator of teacher teaching ability correlates to deep approach: 0.602. The indicator of teacher teaching ability correlates to surface approach: 0.566. The indicator of teacher teaching ability correlates to support: 0.501. The indicator of teacher teaching ability correlates to teaching process: 0.592. From the result above, it can be concluded that teaching ability has big or strong correlation towards teaching process as well as teaching ability has big or strong correlation towards teaching process. It can be said that developing and increasing teaching ability correlates to teaching ability. A good teaching ability will influence to a teaching process as purposes decided
as the curriculum and planning. Teaching ability means teacher professionalism as they works as educators. Without any educators’ teaching ability seem that teaching process will not run well as they must be achieved.
The Correlation between Teacher Competence and Teaching Process
[image:5.595.40.555.533.610.2]To find out the correlation between teacher teaching ability and teaching process at school used correlation analyses. Correlation analyses were used to find out how big correlation between two variables tested uses correlation analyses. Correlation analyses were used to find out how big correlation between two variables tested. As it can be seen from the table 5 below:
Table 4. The correlation between teacher teaching ability and teaching process at school
Teaching Process Teacher teaching ability
Deep Approach Surface Approach Struggling Support Designable Teaching Process
Teaching Design .465** .499** .275** .395** .423** .482**
Delivering .525** .509** .337** .431** .389** .507**
Teaching Method Variance .572** .523** .404** .471** .375** .547**
Different needs .432** .401** .306** .394** .345** .442**
Evaluation and Report .574** .481** .401** .445** .422** .545**
From the table above, teacher competence variable has a good correlates to teaching process. This correlation indicates high and significant correlation. The significance is toward p < 0.05. Moreover, teacher teaching competence indicator has a low, middle and strong correlation toward teaching process. The low correlation can be seen from the professional competence variable toward deep approach was: 0.194. The indicator of professional competence correlates to surface approach: 0.260. The indicator of professional competence correlates to struggling: 0.224. The indicator of professional competence correlates to support: 0.220. The indicator of professional competence correlates to designable: 0.181. The indicator of professional competence correlates to teaching process: 0.252. The indicator of pedagogical competence correlates to deep approach: 0.205. The indicator of pedagogical competence correlates to surface approach: 0.246. The indicator of pedagogical competence correlates to struggling: 0.203. The indicator of pedagogical competence correlates to support: 0.167. The indicator of pedagogical competence correlates to teaching process: 0.244. The indicator of personality competence correlates to deep approach: 0.224. The indicator of personality competence correlates to surface approach: 0.284. The indicator of personality competence correlates to struggling: 0.265. The indicator of personality competence correlates to support: 0.227. The indicator of social competence correlates to deep approach: 0.222. The indicator of social competence correlates to surface approach: 0.212. The indicator of social competence correlates to struggling: 0.147. The indicator of social competence correlates to support: 0.161. The indicator of social competence correlates to teaching process: 0.215.
The teacher competence variable towards deep approach is 0.245. The teacher competence variable correlates to surface approach: 0.285. The teacher competence variable correlates to struggling: 0.237. The teacher competence variable correlates to support: 0.221. The teacher competence variable correlates to designable: 0.269. The teacher competence variable correlates to teaching process: 0.294. The medium correlation occurs at the personality competence towards designable indicator: 0.307. The teacher personality competence variable correlates to teaching process: 0.317, from the result of the research shows that teacher competence has a little correlation to teaching process at school. So then, it can be said that teacher competence has just a little influence to the increasing of teaching process at school.
The Correlation between Educational Background and Teaching Process at School
To find out the correlation between teacher teaching ability and teaching process at school used correlation analyses. Correlation analyses were used to find out how big correlation between two variables tested. As it can be seen from the table 6 above:
[image:6.595.41.547.75.151.2]The low correlation can be seen from the minimum academic qualification variable toward deep approach was: 0.290. The indicator of the minimum academic qualification correlates to surface approach: 0.286. The indicator of the minimum academic qualification correlates to struggling: 0.215. The indicator of the minimum academic qualification correlates to support: 0.254. The indicator of the minimum academic qualification correlates to designable: 0.264. The Indicator of the ability of creating national purposes correlates to deep approach 0.178. The Indicator of the ability of creating national purposes correlates to surface approach: 0.219. The Indicator of the ability of creating national purposes correlates to struggling: 0.207. The Indicator of the ability of creating national purposes correlates to support: 0.226. The Indicator of the ability of creating national purposes correlates to designable: 0.216. The Indicator of the ability of creating national purposes correlates to teaching process 0.253. The indicator of physical and non-physical condition correlates to surface approach: 0.298. The indicator of physical and non-physical condition correlates to struggling: 0.262. The Indicator of the ability of creating national purposes correlates to struggling: 0.280. The Indicator of the ability of creating national purposes correlates to designable: 0.298. The indicator of educational background toward struggling is 0.267. The medium correlation occurs at the indicators of the minimum academic qualification correlates to teaching process: 0.320. The indicator of physical and non-physical condition correlates to deep approach: 0.341. The indicator of physical and non-physical condition correlates to support: 0.319. The indicator of physical and non-physical condition correlates to designable 0.348. The indicator of physical and non-physical condition correlates to teaching process: 0.382. The Indicator of the ability of creating national purposes correlates to the deep approach 0.308. The Indicator of the ability of creating national purposes correlates to the surface approach: 0.321. The Indicator of the ability of creating national purposes correlates to the support: 0.318. The indicator of educational background toward designable: 0.312.
Table 5. The correlation between teacher competence and teaching process
Teaching Ability
Teacher Competence
Deep Approach Surface Approach Struggling Support Designable Teaching Process
Professional Competence .194* .260** .224** .220** .181* .252**
Pedagogical Competence .205* .246** .203* .167* .249** .244**
Behavior Competence .224** .284** .265** .227** .307** .317**
Social Competence .222** .212* .147 .161 .198* .215**
[image:6.595.37.552.182.250.2]Teacher Competence .245** .285** .237** .221** .269** .294**
Table 6. The correlation between educational background and teaching process at school
Teaching Process Educational Background
Deep Approach Surface Approach Struggling Support Designable Teaching Process
Minimum Academic Qualification .290** .286** .215** .253** .264** .320**
Teaching Agent Competence .178* .219** .207* .226** .216** .253**
Physical and Non-physical .341** .298** .262** .319** .348** .382**
Creating National Purposes .308** .354** .280** .351** .298** .369**
The indicator of educational background toward teaching process is 0.367. From the result of the research, the indicator of educational background has a high correlation to teaching process. The correlation value is a middle level. Teaching process can achieved because of educational background. It can be said that educational background can influence the high of teaching process. Those teachers who have a proper educational background and prerequisites can give positive effect to the teaching process at school.
Dominant factor affected to the teaching process
[image:7.595.38.282.284.365.2]To find out the correlation between dominant factor and teaching process at school used correlation analyses and regression stepwise. To apply the multi-variance regression using through stepwise method, firstly doing the correlation analyses like table 7 below:
Table 7. Correlation Analyses
Model R R Square Adjusted R Square Std. Error of the
Estimate
1 .547a .299 .294 15.274
2 .597b .356 .347 14.696
3 .613c .376 .362 14.523
a. Predictors: (Constant), c3 (teaching method variance)
b. Predictors: (Constant), c3, c5 (teaching method variance), (evaluation and report)
c. Predictors: (Constant), c3, c5, b4 (teaching method variance), (evaluation and report), (Creating National Purposes).
From the table above, it can be seen that the correlation value of teaching method variance factor is 0.547, with correlation value: 0.299. it means that around 29.9% teaching process can be explained by the teaching method variance, after adding evaluation and report factor 0.597 by the correlation value 0.356, it means that35.6% from the teaching method variance. Evaluation and report factor influences the teaching process at school, and the teaching method variance factor, evaluation and report, creating national purposes is 0.613 by the constant value 0.376, it means that 37.6% teaching process can influence by teaching process at school and the teaching method variance factor, evaluation and report, creating national purposes. Meanwhile other will be influenced by other factors. Furthermore, dominant factor toward teaching process can be seen at the table 8 below:
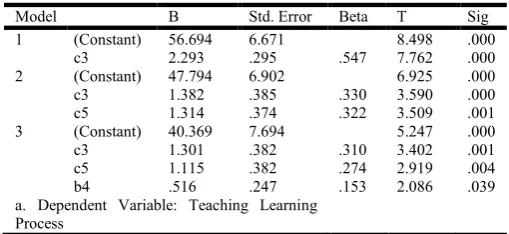
Table 8. Analyses of multi-variance regression toward teaching process
Model B Std. Error Beta T Sig
1 (Constant) 56.694 6.671 8.498 .000
c3 2.293 .295 .547 7.762 .000
2 (Constant) 47.794 6.902 6.925 .000
c3 1.382 .385 .330 3.590 .000
c5 1.314 .374 .322 3.509 .001
3 (Constant) 40.369 7.694 5.247 .000
c3 1.301 .382 .310 3.402 .001
c5 1.115 .382 .274 2.919 .004
b4 .516 .247 .153 2.086 .039
a. Dependent Variable: Teaching Learning Process
From the table above it can be seen that the calculation of multi-regression variance using by stepwise method on the first model toward regression X1 as high as 2.293 for the factor
c3 (teaching method variance) with the constant value 56.694.
Second model toward regression X1 as high as 1.382 for factor
c3 (teaching method variance), X2 is 1.314 for factor c5
(evaluation and report). For the third model X1 is 1.301 for
factor c3 (teaching method variance), toward regression X2 is
1.115 for factor c5 (evaluation and report), toward X3 as high
as 0.516 for factor b4 (creating national purposes). Final
regression of teaching process can be described the same regression Ŷ =56.694+1.301X1 + 1.115X2+ 0.516X3. For the
[image:7.595.34.289.610.727.2]initial of the regression, the equivalency of regression must be tested regression trust. To find out the degree of the double regression trust values must be tested F and the result is shown as the table 9.
Table 9. Analyses of double variance regression
Ŷ =56.694+1.301X1 + 1.115X2+ 0.516X3
Model Sum of
Squares df
Mean
Square F Sig.
1 Regression 14055.501 1 14055.501 60.248 .000a
Residual 32894.205 141 233.292
Total 46949.706 142
2 Regression 16714.770 2 8357.385 38.698 .000b
Residual 30234.936 140 215.964
Total 46949.706 142
3 Regression 17632.282 3 5877.427 27.866 .000c
Residual 29317.425 139 210.917
Total 46949.706 142
a. Predictors: (Constant), c3(teaching method variance),
b. Predictors: (Constant), c3, c5 (teaching method variance), (evaluation and report),
c. Predictors: (Constant), c3, c5, b4 (teaching method variance), (evaluation and report), (creating national purposes).
d. Dependent Variable: Teaching process
Based on the analyses of double variance regression of table 9, it can be seen that the first model of the factor c3 (teaching
method variance), Fcount: 60.248 with the sig value is = 0.000.
Second model of the factor c3 (teaching method variance) and
c5 (evaluation and report), Fcount is 38.698, sig value = 0.000.
Third model of factor c3 (teaching method variance) and c5
(evaluation and report), and b4 (creating national purposes) the
value of Fcount is 27.866 with sig = 0.000, so it can be conluded
that double Ŷ =56.694+1.301X1 + 1.115X2+ 0.516X3, is very
significant. The result shows that dominant factor influences toward teaching process is from the teacher teaching ability through the teaching method variance, evaluation and report, and educational background through the factor of creating national purposes create national education purposes.
DISCUSISION
the middle level. From the result of research that the teaching method variance, evalution and report, and creating national puproses correlate to each other as big as: Ŷ =56.694+1.301X1
+ 1.115X2+ 0.516X3. This finding shows that the dominant
factor influence to teaching process comes from the teaching method variance, evaluation and report, and creating national puproses. Ali (2007) said that schooling management perspective as the key as well as the facilities at school and teacher competence, yet all the factors in terms of developing and increasing school management. Teachers can be regarded as good competence as educators when they have the following prerequisites; 1). Personality-based development; 2). The ability of knowledge and skills; 3). Know to do, 4). The ability of behaviorism at works individually, evaluate, and decision maker responsibility. 5). Social approach: teamworks, friendliness and appreciate pluralism value (Pusposutardjo, 2002). Empowerment organized teaching profession through the development of self-conducted democratically, membership, non-discriminatory, and sustained by upholding human rights, religious values, cultural values, national diversity and professional ethics. Implementation of professional development and competence of teachers should be facilitated by the government (central and local), the organizer of educational units, associations of teachers, and teachers in private. Improving the quality of teaching in a school teachers are required to perform the duties and responsibilities of others is about class administration, curriculum development, professional development as professional educators. Charges against continuous improvement of competence caused Since the substance of the study and learning contexts have always been growing and changing according to the dimensions of space and time (Saud, 2009). Also added Danim (2010), said that to meet the professional criteria, teachers must undergo a process towards the professionalization or professional degrees true continuous basis.
To have a good and quality teaching process needs quality teachers. Sudjana (2002), students’ achievement can be influenced by teacher competence as high as 76.6%, connectivity .43%, teaching material 32.38%. This means that teacher as the main factors of the teaching process. Thus in the absence of improvement of human resources, especially teachers in the school, the activities will have problems learning, empowerment and improving the quality of teachers as educators must be done to reduce and overcome the various problems related to the learning process at school.
Conclusion
From the result of the research, it can be said that teaching ability dan teaching process are high influence by the teacher competence and their educational background. This research proves that whole teacher competence correlate to teacher teaching ability is high. This teaching process need special needs from any stakeholders. Professional teachers have good teaching ability as well special skills of teacher training that gained from educational background of the educators. In increasing quality education at school so then teaching process done at school by the teacher professionally, have high dedication toward quality teaching process. Profesional teachers have teaching ability, good teacher competence and educational background. In doing teaching and learning, it needs selection and self-reflection and developing as educators as the filters in creating efective teaching process, and it is a
means of developing and increasing of teacher teaching ability and teaching process quality.
REFERENCES
Airasian, P, Mills, G.E., Gay, L.R. 2012. "Educational Research, Competencies for Analysis and Applications." New Jersey: Pearson Education, Inc
Ali, M. 2007. Science and Education Applications. Bandung: Pedagogiana Pers.
Cohen, J. 1988. Statistical power analysis for the behavioral sciences (2nd ed.). Hillsdale, NJ: Lawrence Earlbaum Associates.
Crewell, John W. 2008. Educational Research Planning, Conducting, and Evaluating Qualitative & Quantitative Approaches. London: Sage Publications.
Danim, Sudarwan, 2010. An Essay Innovative Teacher
Professional Development. Bandung: PT. Remaja Rosdakarya.
Diaz, M. J Martin. 2006. International Journal of Science Education : Educational Background, Teaching Experience and Teacher’s Views on the Inclusion of Nature of Science in the Science Curriculum. Institute of Secondary Education Jorge Manrique, Vol. 28, No. 10, 18 August 2006, pp. 1161–1180.
Government Regulation No. 19 Year 2005 on National Education Standards.
Hamalik, O. 2008. Curriculum and Learning. Jakarta: Bumi Aksara.
Kerlinger, F.N. 2010. Foundations Behavioral Research. Yogyakarta: Gadjah Mada University Press
Law No. 14 of 2005 on: Teachers and Lecturers. Bureau of Law and Organization of the Ministry of National Education.
Majid Konting, Mohd, 1990. Educational research methods. Kuala Lumpur: Dewan Bahasa dan Pustaka.
Martinis Y. 2006. Professionalization of Teachers and the Implementation of Competency Based Curriculum. Jakarta: Gaung Persada Press
Mulyasa, E. 2007. Becoming a Professional Teacher creates Creative Learning and Fun. Bandung : Rosdakarya. Mulyasa, E. 2009. Teachers Competency Standards and
Certification. Bandung: PT. Remaja Rosdakarya.
Naim, N. 2009. Being a teacher inspiring. Yogyakarta: Pustaka Belajar.
Nunnally, J. C. 1978. Psychometric Theory. New York: McGraw Hill.
Nurasmah Hj Othman 2002. Youth Entrepreneurship Program Effectiveness in the Secondary School. Tesis Doktor Falsafah, Fakulti Pendidikan, UPM, Sedang, Malaysia. Nurdin, M. 2008. Tips for Becoming a Professional Teacher.
Jogjakarta: Ar-Ruzz Media
Pusposutardjo, Suprodjo. 2002. Curriculum Development Policy and Higher Education Institutions in the Era of Global Life. Paradigm Papers National Seminar on Higher Education Curriculum 2000. Surakarta: Universitas Muhammadiyah.
Robin, A & Babbie, E. 2001. Research Methods For Social Workers. California: Pacific Grove.
Santoso, Singgih. 2000. Processing Data Statistics Professionally. Jakarta: PT. Alex Media Komputindo.
Saud, Udin Saefudin, 2009. Teacher Professional
Development, Bandung: CV. Alfabeta.
Singarimbun, Masri dan Effendi, Sofian. 1989. Survey Research Methods. Jakarta: LP3ES.
Sudjana, N. 2002. Basics of Learning Process. Bandung: Sinar Baru.
Suwarno, W. 2006. Fundamentals of Education Sciences. Yogyakarta: Ar-Ruzz Media.
Syah, D. 2010. Contributions of Transformational Leadership Performance Principals Teachers and Culture Learning Against Increasing Achievement Madrasah Aliyah Negeri Jakarta. Disertation. Bandung: Universitas Islam Nusantara.
Usman, Moh. Uzer. 2007. Become Teachers. Bandung: PT Remaja Rosdakarya.