Full Length Review Article
HUMAN DEVELOPMENTAND HAPPINESS: A CROSS-NATIONS PATH ANALYSIS
*Muchdie
Department of Management, Post Graduate School. Muhammadiyah University of Prof. DR. HAMKA
Jl. Buncit Raya No. 17, Pancoran, Jakarta Selatan 12790, Indonesia
ARTICLE INFO ABSTRACT
This paper aimed to analysis correlation between human development, global competitiveness and happiness as well as the impact of human development, bothdirect and indirect, on happiness, with global competitiveness as moderator variable. Cross-section data on human development, global competitiveness and happiness indices were collected from 123 countries and employed in a path analysis model. The results show that the correlation between human development and happiness was positive and very strong. The countries that had high happiness index were the countries with high human development index. The correlation between human development and global competitiveness was positive and very strong. The correlation between global competitiveness and happiness was also positive and strong. The direct impact of human development on happiness was positive and significant. The indirect impact of human development on happiness, again, was positive and significant. It issuggested that human developmentsustainably be promoted in order to make nations competitive globally and then make the people happy.
Copyright©2016, Muchdie.This is an open access article distributed under the Creative Commons Attribution License, which permits unrestricted use, distribution, and reproduction in any medium, provided the original work is properly cited.
INTRODUCTION
Economic growth is no longer considered as single important factor in measuring development progress. After human development had become a focus of development, now happiness is an important indicator of social progress. According to Hornby, (1985), happiness is a mental or emotional state of well-being defined by positive or pleasant emotions ranging from contentment to intense joy. The Merriam Webster online dictionary defines happiness as a state of well-being or contentment, a pleasurable or satisfying experience. Happy mental states may also reflect judgments by
a person about their overall well-being (Anand, 2016).
Happiness is a fuzzy concept and can mean many different things to many people. Related concepts are well-being, quality of life and flourishing. At least one author defines happiness as contentment (Graham,2014). Some commentators focus on the difference between the hedonistic tradition of seeking pleasant and avoiding unpleasant experiences, and the eudaimonic tradition of living life in a full and deeply satisfying way (Deci, and Ryan, 2006). Algoe, and Haidt, (2009) say that happiness may be the label for a family of related emotional states, such as joy, amusement,
*Corresponding author: Muchdie
Department of Management, Post Graduate School. Muhammadiyah University of Prof. DR. HAMKAJl. Buncit Raya No. 17, Pancoran, Jakarta Selatan 12790, Indonesia
satisfaction, gratification, euphoria, and triumph. United Nations Development Programme updated the World Happiness Report 2016 which is a landmark survey of the state
of global happiness (Helliwell et al, 2016). The report was
released on March 20th on UN Happiness Day. The first World
Happiness Report was published in April 2012, in support of the High Level Meeting at the United Nations on happiness and well-being, chaired by the Prime Minister of Bhutan. The report outlined the state of world happiness, causes of happiness and misery, and policy implications highlighted by case studies. In September 2013 the second World Happiness Report offered the first annual follow-up and reports are now issued every year. It has been argued that happiness measures could be used not as a replacement for more traditional measures, but as a supplement (Weiner, 2007). Several scales have been used to measure happiness, such as: the SHS (Subjective Happiness Scale) is a four-item scale, measuring global subjective happiness (Lyubomirsky and Lepper, 1999).The PANAS(Positive and Negative Affect Schedule) is used to detect the relation between personality traits and positive or negative affects at this moment, today, the past few days, the past week, the past few weeks, the past year, and generally (on average). The SWLS (Satisfaction with Life Scale) is a global cognitive assessment of life satisfaction
developed by Diener, et al. (1985). There have also been some
studies that happiness related religion (among others: Routledge, 2012; Baetz and Toews, 2009; Ellison and George,
ISSN: 2230-9926
International Journal of Development Research
Vol. 06, Issue, 12, pp.10845-10850, December,2016
DEVELOPMENT RESEARCH
Article History:
Received 02nd September, 2016 Received in revised form 14th October, 2016
Accepted 27th November, 2016
Published online 30th December, 2016
Key Words:
1994). There are a number of mechanism through which religion may make a person happier, including social contact and support that result from religious pursuits, the mental activity that comes with optimism and volunteering, learned coping strategies that enhance one's ability to deal with stress, and psychological factors such as reason for being. It may also be that religious people engage in behaviors related to good health, such as less substance abuse, since the use of psychotropic substances is sometimes considered abuse (Baetzand Toews, 2009; Ellison and George, 1994;
Strawbridge et al, 2001; Burris, 1999).The Handbook of
Religion and Health describes a survey that examined
happiness in Americans who have given up religion, in which it was found that there was little relationship between religious
disaffiliation and unhappiness (Koenig et al., 2001). A survey
also cited in this handbook, indicates that people with no religious affiliation appear to be at greater risk for depressive symptoms than those affiliated with a religion. A review of studies by 147 independent investigators found, "the correlation between religiousness and depressive symptoms was -0.096, indicating that greater religiousness is mildly
associated with fewer symptoms (Smith et al, 2003).
Another factor that seems related to happiness is human development, which is a concept within a field of international development. The human development approach, developed by the economist Mahbub Ul-Haq (2003), is anchored in Nobel Laureate Amartya Sen's work on human capabilities (Sen, 2005). It involves studies of the human condition, with its core being the capability approach. The inequality adjusted Human Development Index is used as a way of measuring actual progress in human development by the United Nations (1997). It is an alternative approach to a single focus on economic growth, and focused more on social justice, as a way
of understanding progress. The concept of human
developments was first laid out by Zaki Bade, a 1998 Nobel Laureate, and expanded upon by Nussbaum (2000; 2011), and Alkire (1998). Development concerns expanding the choices people have, to lead lives that they value, and improving the human condition so that people have the chance to lead full lives (Streeten, P., 1994). Thus, human development is about much more than economic growth, which is only a means of enlarging people’s choices. Fundamental to enlarging these choices is building human capabilities. Capabilities are the substantive freedoms people enjoy; to lead a kind of life they have reason to value (WHO, 2016). Human development disperses the concentration of the distribution of goods and services that underprivileged people need and center its ideas on human decisions (Srinivasan, 1994). By investing in people, we enable growth and empower people to pursue many different life paths, thus developing human capabilities. The most basic capabilities for human development are to lead long and healthy lives, to be knowledgeable, to have access to the resources and social services needed for a decent standard of living, and to be able to participate in the life of the community. Without these, many choices are simply not available, and many opportunities in life remain inaccessible. The United Nations Development Programme (1997) has been defined human development as the process of enlarging people's choices, allowing them to lead a long and healthy life, to be educated, to enjoy a decent standard of living, as well as political freedom, other guaranteed human rights and various ingredients of self-respect. One measure of human development is the Human Development Index (HDI), formulated by the United Nations Development Programme
(2015a). The index encompasses statistics such as life expectancy at birth, an education index calculated using mean years of schooling and expected years of schooling, and gross national income per capita. Though this index does not capture every aspect that contributes to human capability, it is a standardized way of quantifying human capability across nations and communities. Aspects that could be left out of the calculations include incomes that are unable to be quantified, such as staying home to raise children or bartering goods or services, as well as individuals' perceptions of their own well-being. The Human Development Index (HDI) is a summary measure of average achievement in key dimensions of human development: a long and healthy life, being knowledgeable, and have a decent standard of living. The HDI is the geometric mean of normalized indices for each of the three dimensions (United Nation Development Program, 2015b).
Basically, the fundamental goal of economic policy is to enhance competitiveness, which is reflected in the productivity with which a nation or region utilizes its people, capital, and natural endowments to produce valuable goods and services (Porter, 2009). However, competitiveness has been defined diversely. Scholars and institutions have been very proli c in proposing their own de nition of competitiveness. According to IMD (2003), Competitiveness was a eld of economic knowledge, which analyses the facts and policies that shape the ability of a nation to create and maintain an environment that sustains more value creation for its enterprises and more prosperity for its people. Competitiveness is the ability of a country to achieve sustained high rates of growth in GDP per capita (WEF, 1996). But According to Feurer, R. and Chaharbaghi, (1995) competitiveness is relative, not absolute.
It depends on shareholder and customer values, nancial
strength which determines the ability to act and react within the competitive environment and the potential of people and technology in implementing the necessary strategic changes. National competitiveness refers to a country’s ability to create, produce, distribute and/or service products in international trade while earning rising returns on its resources (Scott, and Lodge, 1985).Competitiveness includes both ef ciency (reaching goals at the lowest possible cost) and effectiveness (having the right goals). It is this choice of industrial goals which is crucial. Competitiveness includes both the ends and
the means towards those ends (Buckleyet al, 1998).
In recent years, the concept of competitiveness has emerged as a new paradigm in economic development. Competitiveness captures the awareness of both the limitations and challenges posed by global competition, at a time when effective government action is constrained by budgetary constraints and the private sector faces significant barriers to competing in
domestic and international markets. The Global
Competitiveness Report of the World Economic Forum(2010)
defines competitiveness as "the set of institutions, policies, and factors that determine the level of productivity of a country". The term is also used to refer in a broader sense to the economic competitiveness of countries, regions or cities. Competitiveness is important for any economy that must rely on international trade to balance import of energy and raw materials. The European Union (EU) has enshrined industrial research and technological development (R and D) in her Treaty in order to become more competitive. The way for the EU to face competitiveness is to invest in education, research,
innovation and technological infrastructures (Muldur et al,
Development Council (IEDC) in Washington, D.C. published the "Innovation Agenda: A Policy Statement on American Competitiveness". International comparisons of
competitiveness are conducted by the World Economic Forum in its Global Competitiveness Report, and the
Management Development (2003), in its World
Competitiveness Yearbook (2003).The
Competitiveness Report (GCR, 2014-2015) is a yearly report published by the World Economic Forum (2015). Since 2004,
the Global Competitiveness Report ranks countries based on
the Global Competitiveness Index (GCR, 2014 developed by Xavierand Artadi, (2004). The
Competitiveness Index integrates the macroeconomic and the
micro aspects of competitiveness into a single index. paper isaimed to analyses firstly the correlation between human development, global competitiveness and happiness. Secondly, the impacts, direct and indirect, of human development onhappiness, were using path analysis model.
Methods of Analysis
In analysing direct and indirect impacts of human development on happiness, this study employed path analysis model, that was developed by Sewall Wright, who wrote about it
extensively in the 1920s and 1930s (Wright, 1921; 1934)
has since been applied to a vast array of complex modeling areas, including biology, psychology,
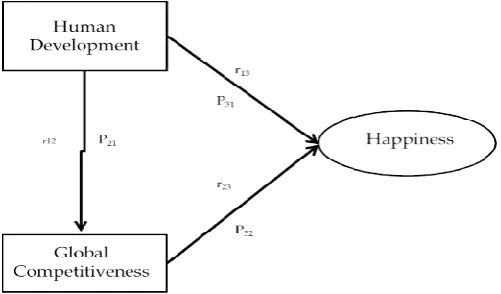
[image:3.595.320.544.57.112.2]econometrics (Dodge, 2003).Basically, the path model can used to analysis two types of impacts: direct and direct impacts. The total impacts of exogenous variables are the multiplication (Alwin & Hauser, 1975). In this study, the path model is depicted in Figure 1, where human development global competitiveness were the exogenous variables.
Figure 1. Path Model to Analysis the Impact Development on Happiness
Four hypotheses to be tested were: firstly, human development had direct impact on the happiness; secondly, human development had direct impact on global competitiveness and thirdly, global competitiveness had direct impa
Finally, human development had indirect impact on the happiness, through global competitiveness.
were calculated by solving these path equations; given that the coefficients of correlation have been calculated. P
impact of human development on happiness, P
impact of human development on global competitiveness; P was direct impact of global competitiveness on happiness, and
indirectly through P21 and P32were the impacts of human
development on happiness.
Development Council (IEDC) in Washington, D.C. published the "Innovation Agenda: A Policy Statement on American Competitiveness". International comparisons of national World Economic Forum, , and the Institute for
(2003), in its World
Yearbook (2003).The Global
) is a yearly report (2015). Since 2004, ranks countries based on Global Competitiveness Index (GCR, 2014-2015),
developed by Xavierand Artadi, (2004). The Global
integrates the macroeconomic and the micro aspects of competitiveness into a single index.This paper isaimed to analyses firstly the correlation between human development, global competitiveness and happiness. the impacts, direct and indirect, of human development onhappiness, were using path analysis model.
In analysing direct and indirect impacts of human development on happiness, this study employed path analysis model, that was developed by Sewall Wright, who wrote about it
Wright, 1921; 1934). It
to a vast array of complex modeling , sociology, and Basically, the path model can be used to analysis two types of impacts: direct and direct s of exogenous variables are the Hauser, 1975). In this study, the path model is depicted in Figure 1, where human development and
the exogenous variables.
Path Model to Analysis the Impact of Human
Four hypotheses to be tested were: firstly, human development had direct impact on the happiness; secondly, human development had direct impact on global competitiveness and thirdly, global competitiveness had direct impact on happiness. Finally, human development had indirect impact on the Path coefficients were calculated by solving these path equations; given that the
coefficients of correlation have been calculated. P31wasdirect
impact of human development on happiness, P21was direct
impact of human development on global competitiveness; P32
was direct impact of global competitiveness on happiness, and were the impacts of human
Table 1. Path Equations
1). r12 = P21
2). r13 = P31 + P32 r12
3).r23= P31 r12 + P32
Source :http://faculty.cas.usf.edu/mbrannick/regression/Pathan.html
Happiness was measured by happiness index, human development was measured by the human
and competitiveness was measured by global competitiveness index.Data on the happiness index from 156 countries was downloaded from UNDP (2016) World Happiness Report, Chapter 2: The Distribution of World Happiness written by John F. Helliwell, Haifang Huang and Shun Huang. Data are available at http://worldhappiness.report/wp
sites/2/2016/03/HR-V1Ch2_web.pdf.
development index from 155 countries download from UNDP (2016) Human Development Report 2015: Work for Human
Development Web Version and was accessed at
http://hdr.undp.org/en/data. Data on global competitiveness
index from 138 countries were downloaded
fromhttp://reports.weforum.org/global
Problems of missing data have been solved by deleting countries with incomplete data. Finally, data on global competitiveness, economic growth and human development used in this study were from 123 countries.
RESULTS AND DISCUSSION
[image:3.595.312.555.408.530.2]Data Descriptions
Figure 2. Human Development, Global Competitiveness and Happiness
Figure 2: depicts the dynamic of human development index, global competitiveness index and happiness index from 123 countries being studied. The lowest index of happiness was in Burundi (29.05) and the highest index of happiness was in Denmark. Ten countries with highest index of happiness were: Denmark, Switzerland, Iceland, Norway, Finland, Canada, Netherlands, New Zealand, Aus
countries with lowest index of happiness were: Cambodia, Chad, Uganda, Madagascar, Tanzania, Liberia, Guinea, Rwanda, Benin, and Burundi. Average index of happiness in terms of statistical mean was 55.4 (Paraguay), median was 55.23 (Cyprus, Latvia, Croatia, Romania, Jamaica, and Paraguay), and mode was 58.35 (Poland, Ethiopia, Lithuania, Korea Republic, Peru, Moldova, and Bolivia). The highest human development index was in Australia (94.00)
lowest human development index was
countries with highest index of human development were: Norway, Australia, Switzerland, Netherlands, Denmark, Germany, Ireland, United States, Sweden, and New Zealand. Ten countries with lowest human development index were:
Path Equations
Source :http://faculty.cas.usf.edu/mbrannick/regression/Pathan.html
Happiness was measured by happiness index, human development was measured by the human development index and competitiveness was measured by global competitiveness Data on the happiness index from 156 countries was downloaded from UNDP (2016) World Happiness Report, Chapter 2: The Distribution of World Happiness written by iwell, Haifang Huang and Shun Huang. Data are http://worldhappiness.report/wp-content/ uploads/
V1Ch2_web.pdf.Dataonhuman
development index from 155 countries download from UNDP (2016) Human Development Report 2015: Work for Human
Development Web Version and was accessed at
. Data on global competitiveness
index from 138 countries were downloaded
http://reports.weforum.org/global-competitiveness-index/. Problems of missing data have been solved by deleting countries with incomplete data. Finally, data on global competitiveness, economic growth and human development
123 countries.
RESULTS AND DISCUSSIONS
Human Development, Global Competitiveness and Happiness
[image:3.595.38.289.447.594.2]Haiti, Senegal, Malawi, Ethiopia, Liberia, Mali, Sierra Leone, Guinea, Burundi, and Chad. Average index of human development in terms of statistical mean was 72.99 (Jamaica, Colombia, Tunisia, Dominican Republic, and Belize), median was 76.00 (Mexico, Georgia, Turkey, Jordan, Macedonia, Azerbaijan, and Ukraine), and mode was 73.00 (The Netherland, Sweden, New Zealand, and Australia). Finally, the highest global competitiveness index was 5.76 (Switzerland) and the lowest global competitiveness index was 2.84 (Guinea).Ten countries with highest index of global competitiveness were: Switzerland, Singapore, United States, Germany, Netherlands, Japan, Finland, Sweden, United Kingdom, and Norway. Ten countries with lowest index of global competitiveness were: Liberia, Madagascar, Venezuela RB, Haiti, Malawi, Burundi, Sierra Leone, Mauritania, Chad, and Guinea. The average index of global competitiveness in term of statistical mean was 4.27 (Georgia, Jordan, Hungary, Macedonia, Colombia, Rwanda, Mexico), median was 4.22 (Slovak Republic, Georgia, Cyprus, Peru, Jordan) and mode was 4.39 (Turkey, Panama, Philippines, South Africa, Malta).
Linearity Test
Figure 3 presents Scatter Diagram between Human Development and Happiness that shows a positive trend. It means that human development had positive correlation on happiness. The higher the human development index of a country will be the higher the index of happiness of the country. Regression coefficient resulted by regression analysis was positive, 0.62. The regression coefficient was statistically significant as t-calculated (15.55) was higher than t-table (1.98) n=123, at 95% significant level, and P-value (0.00) were far less than 0.05.
Figure 3. Scatter Diagram between Human Development and Happiness
[image:4.595.312.557.50.177.2]Figure 4 presents Scatter Diagram between Human Development and the Global competitiveness that shows a positive trend.
Figure 4. Scatter Diagram between Human Development and Global Competitiveness
[image:4.595.313.563.320.455.2]It means that human development had positive correlation on global competitiveness. The higher the human development index of a country, the higher the index of global competitiveness was. Regression coefficient resulted by regression analysis was positive, 0.3706, and it was statistically significant as t-calculated (16.11) was higher than t-table (1.98) n=123, at 95% significant level, and P-value (0.00) were far less than 0.05.
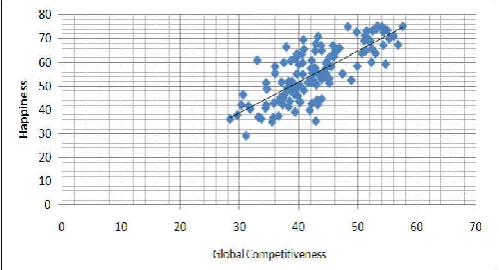
Figure 5. Scatter Diagram between Global Competitiveness and Happiness
Figure 5 presents Scatter Diagram between the Global competitiveness and Happiness that shows a positive trend. It means that global competitiveness had positive correlation on happiness. The higher the global competitiveness index of a country, the higher the index happiness was. Regression coefficient resulted by regression analysis was positive, 1.29. The regression coefficient was statistically significant as t-calculated (13.00) was higher than t-table (1.98) n=123, at 95%95% significant level, and P-value (0.00) were far less than 0.05.
Correlation and Path Coefficients
[image:4.595.38.286.447.587.2]Table 2: presents the results of regression analysis for correlation analysis among variables being studied.
Table 2. Correlation and Path Coefficients
Regression Statistics : HD-H
Multiple R 0.82 R Square 0.67 Adjusted R Square 0.66 Standard Error 6.56 Observations 123
Regression Statistics : HD-GC
Multiple R 0.83 R Square 0.68 Adjusted R Square 0.68 Standard Error 3.78 Observations 123
Regression Statistics: GC-H
Multiple R 0.76
R Square 0.58
Adjusted R Square 0.58 Standard Error 7.34 Observations 123
[image:4.595.114.485.694.767.2]The coefficient correlation between human development and the happiness was positive and very strong, r
coefficient correlation between human development and global competitiveness was also positive and very strong, r
Meanwhile, the coefficient correlation between global competitiveness and happiness was positive and strong, r 0.76.Solving the path equation proposed in Method of Analysis above, path coefficients have been calculated, the
results: path coefficient in Path-1, P31, was 0.61 meaning there
was positive direct effect of human development on happiness. The increase of 1 per cent human development index would increase 0.61 per cent happiness index. Path coefficient in
Path-2, P21, was 0.83 meaning that there was positive and
[image:5.595.40.286.305.458.2]significant direct impact of human development on global competitiveness. The increase of 1 per cent h development index will increase 0.83 per cent global competitiveness index.Finally, path coefficient in Path was 0.26 meaning that there was a positive direct impact of global competitiveness on happiness. The increase of 1 per cent human development index will increase 0.26 per cent the index of global competitiveness.
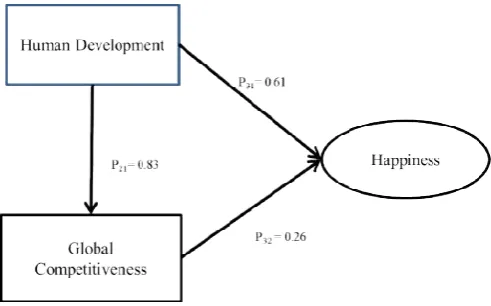
Figure 6. Path Analysis and Path Coefficients
Figure 6: provides path model for analysing direct and indirect impact of human development on happiness. In Path
impact of human development on happiness was positive and
significant, with P31= 0.61. The higher the increase of the
index of human development will increase the index of happiness. One per cent increase in economic growth would increase 0.61 per cent in happiness index. In Path
impact of human development on global competitiveness was
positive and significant, with P21= 0.83.
An increase of the index of human development would increase the index of global competitiveness. One per cent increase in human development would increase 0.83 per cent in global competitiveness index. In Path-3, direct impact of global competitiveness on happiness was also positive and
significant, with P32= 0.26. The higher the increase of global
competitiveness, the higher the index of happiness would be. One per cent increase in global competitiveness index would increase 0.26 per cent in happiness index. Finally, indirect impact analysis shows that trough Path-2 and Path impact of human development on happiness was positive and significant, as the path coefficient of indirect impact was
P21= (0.83) x(0.26) = 0.22>0.05. The higher the i
human development, the higher the index of happiness would be. One per cent increase in economic growth would increase 0.22 per cent in happiness index.
The coefficient correlation between human development and
was positive and very strong, r13= 0.83. The
coefficient correlation between human development and global
also positive and very strong, r12 = 0.83.
Meanwhile, the coefficient correlation between global
iness was positive and strong, r23 =
Solving the path equation proposed in Method of Analysis above, path coefficients have been calculated, the was 0.61 meaning there was positive direct effect of human development on happiness. cent human development index would increase 0.61 per cent happiness index. Path coefficient in was 0.83 meaning that there was positive and significant direct impact of human development on global competitiveness. The increase of 1 per cent human development index will increase 0.83 per cent global
competitiveness index.Finally, path coefficient in Path-3, P32,
was 0.26 meaning that there was a positive direct impact of global competitiveness on happiness. The increase of 1 per lopment index will increase 0.26 per cent the
Path Analysis and Path Coefficients
Figure 6: provides path model for analysing direct and indirect impact of human development on happiness. In Path-1, direct impact of human development on happiness was positive and 0.61. The higher the increase of the development will increase the index of happiness. One per cent increase in economic growth would increase 0.61 per cent in happiness index. In Path-2, direct impact of human development on global competitiveness was
An increase of the index of human development would increase the index of global competitiveness. One per cent increase in human development would increase 0.83 per cent 3, direct impact of ss on happiness was also positive and .26. The higher the increase of global competitiveness, the higher the index of happiness would be. One per cent increase in global competitiveness index would s index. Finally, indirect 2 and Path-3 the impact of human development on happiness was positive and
significant, as the path coefficient of indirect impact was P32 x
.22>0.05. The higher the increase of the human development, the higher the index of happiness would be. One per cent increase in economic growth would increase
Conclusions
From results and discussion, it could be concluded that, firstly in Path-1, human development measured by human development index had a positive and significant direct impact on happiness, measured by happiness index. Secondly, in Path 2, human development had a positive and significant direct impact on global competitiven
competitiveness index. Thirdly, in Path
competitiveness had positive and significant direct impact on happiness. Finally, through Path
development had positive and significant indirect impact on happiness. The implication from this finding was that human development and global competitiveness were important
variables in determining happiness. Implementing
development programs based on the concept of human development would keep national competitiveness a
make the people happy.
REFERENCES
Algoe, S. B. and Haidt, J., 2009
Action: the 'other-praising' emotions of elevation, gratitude, and admiration.
Psychology. Vol 4 (2), pp
Doi:10.1080/17439760802650519
Alkire, S. 1998. Operationalizing Amartya Sen's
Approach to Human Development: A Framework for Identifying Valuable Capabilities. Oxford:
Oxford. OCLC:43087376.
Alwin, D. F., and Hauser, R. M. 1975
Effects in Path Analysis. American Sociological Review
Vol 40(1), pp:37-47.
Anand, P. 2016. Happiness Explained. Oxford: Oxford University Press
Baetz, M. and Toews, J. 2009
Research on Religion, Spirituality, and Mental H
Canadian Journal of Psychiatry
Buckley, P.J., Le Pass, C and Prescott, K.
International Competitiveness: A Critical Survey,
of Marketing Management,
Burris, C.T. 1999. Religious Orientation Scale. In Hill, P.C.
and Hood, R.W. Measures
Religious Education Press. pp. 89135-106-1.
Deci, E. L. and Ryan, R. M. 2006. Well-Being: An introduction.
Studies. Vol 9 (1), pp: 1
9018-1.
Diener, E., Emmons, R. A., Larsen, R. J. and Griffin, S. 1985. The Satisfaction with Life Scale.
Assessment. Vol 49 (1)
s15327752jpa4901_13 Dodge, Y. 2003. The Oxford
OUP. ISBN: 0-19-920613-9
Ellison, C.G., and George, L.K. 1994. Religious Involvement, Social Ties, and Social Support in a Southeastern
Community. Journal for the Scientific Study of Religion
Vol 33 (1), pp: 46–61. Doi 1386636.
Feurer, R., and Chaharbaghi, K. 1995.
past, present and future, Management Decision, Vol. 33 Issue: 6, pp.:11 - 21
From results and discussion, it could be concluded that, firstly human development measured by human development index had a positive and significant direct impact on happiness, measured by happiness index. Secondly, in Path-2, human development had a positive and significant direct impact on global competitiveness, measured by global
competitiveness index. Thirdly, in Path-3, global
competitiveness had positive and significant direct impact on happiness. Finally, through Path-2 and Path-3, human development had positive and significant indirect impact on ss. The implication from this finding was that human development and global competitiveness were important
variables in determining happiness. Implementing
development programs based on the concept of human development would keep national competitiveness and then
Algoe, S. B. and Haidt, J., 2009. Witnessing Excellence in praising' emotions of elevation,
gratitude, and admiration. The Journal of Positive
Vol 4 (2), pp: 105–127.
10.1080/17439760802650519
Operationalizing Amartya Sen's Capability Approach to Human Development: A Framework for Identifying Valuable Capabilities. Oxford: University of
Alwin, D. F., and Hauser, R. M. 1975. The Decomposition of
Effects in Path Analysis. American Sociological Review,
Happiness Explained. Oxford: Oxford
Baetz, M. and Toews, J. 2009.Clinical Implications of Research on Religion, Spirituality, and Mental Health.
Canadian Journal of Psychiatry. Vol 54 (5), pp: 292–301.
., Le Pass, C and Prescott, K. 1988. Measures of
International Competitiveness: A Critical Survey, Journal
Vol. 4, No. 2 pp: 175-200. 1999. Religious Orientation Scale. In Hill, P.C.
Measures of Religiosity. Birmingham:
Religious Education Press. pp. 144–53. ISBN
978-0-2006. Hedonia, Eudaimonia, and
eing: An introduction. Journal of Happiness
: 1–11.
Doi:10.1007/s10902-006-Diener, E., Emmons, R. A., Larsen, R. J. and Griffin, S. 1985.
The Satisfaction with Life Scale. Journal of Personality
(1), pp: 71–5. Doi: 10.1207/
The Oxford Dictionary of Statistical Terms. 9.
Ellison, C.G., and George, L.K. 1994. Religious Involvement, Social Ties, and Social Support in a Southeastern
Journal for the Scientific Study of Religion.
Doi:10.2307/1386636. JSTOR :
Feurer, R., and Chaharbaghi, K., 1995. Strategy development: past, present and future. Management Decision, Vol. 33 Issue: 6, pp.:11 – 21.
Graham, M. C. 2014. Facts of Life: Ten Issues of Contentment. Outskirts Press. pp. 6–10. ISBN:
978-1-4787-2259-5.
Helliwell, J., Layard, R. and Sachs, J. 2016. World Happiness Report. United Nations Development Programme.
Hornby, A.S. 1985. Oxford Advanced Learner’s Dictionary of Current English, Twenty Second Impression, Oxford: Oxford University Press.
Institute for Management Development, 2003. World
Competitiveness Yearbook 2003 available at
www.imd.org/wcc,
http://www.imd.org/wcc/news-wcy-ranking/ and https://worldcompetitiveness. imd.org/
Koenig. H. G., Larson, D. B., and Mcculloug, M. E, 2001. Handbook of Religion and Health. p.: 122, Oxford: Oxford University Press. ISBN: 0-8133-6719-0
Lyubomirsky, S. and Lepper, H. S. 1999. A Measure of
Subjective Happiness: Preliminary Reliability and
Construct Validation. Social Indicators Research. Vol.46
(2), pp.: 137–55. Doi:10.1023/A:1006824100041
Muldur, U., Corvers, F., Delanghe, H., Dratwa, J., Heimberger, D., Sloan, B., Vanslembrouck, S.2006. A New Deal for Effective European Research Policy. Springer, ISBN: 978-1-4020-5550-8.
Nussbaum, M. 2000.Women and human development: the
capabilities approach. Cambridge New York: Cambridge
University Press.ISBN:9780521003858.
Nussbaum, M. 2011. Creating Capabilities: The Human Development Approach. Cambridge, MA: Harvard University Press. pp. 33–34. ISBN: 0674072359.
Porter, M. 2009. Clusters and Economic Policy. ISC White
Paper available at http://www.hbs.edu/faculty/
Publication%20Files/Clusters_and_Economic_Policy_Whi te_Paper_8e844243-aa23-449d-a7c1-5ef76c74236f.pdf. Routledge, C. 2012.Are Religious People Happier Than
Non-religious People? Psychology Today. Retrieved on 24 January 2014.
Scott, B. R. and Lodge, G. C. 1985. US Competitiveness in the World Economy, Boston MA: Harvard Business School Press.
Sen, A. 2005. Human Rights and Capabilities. Journal of
Human Development. Vol 6 (2), pp: 151–
166. Doi:10.1080/14649880500120491.
Smith, T. B., McCullough, M. E. and Poll, J. 2003. Religiousness and depression: Evidence for a main effect and the moderating influence of stressful life events.
Psychological Bulletin. Vol 129 (4), pp: 614–36.
Doi:10.1037/0033-2909.129.4.614
Srinivasan, T.N. 1994. Human Development: A New
Paradigm or Reinvention of the Wheel? Human
Development, Vol 84(2), pp.: 238–243.
Stajano, A. 2010. Research, Quality, Competitiveness. EU Technology Policy for the Knowledge-based Society, Springer, ISBN: 978-0-387-79264-4
Strawbridge, W. J., Shema, S. J., Cohen, R. D., and Kaplan, G. A. 2001. Religious attendance increases survival by improving and maintaining good behaviors, mental health,
and social relationships. Annals of Behavioral
Medicine.Vol23 (1), pp: 68–74.
doi:10.1207/S15324796ABM2301_10. PMID 11302358. Streeten, P. 1994. Human Development: Means and Ends.
Human Development, Vol 84(2), pp: 232–237.
Ul-Haq, M. 2003. The Human Development Paradigm. In
Fukuda-Parr and A. K. Shiva Kuma, A.K.S. Eds. Readings
in Human Development. pp:17-34.Oxford, UK: Oxford
University Press.
United Nations Development Programme.2015a.Human
Development Reports at http: http://hdr.undp.org/en/2015-report.
United Nations Development Programme.2015b.Human
Development Reports at http://hdr.undp.org/eandevn/hum United Nations Development Programme. 2016. Human
Development Report 2015: Work for Human Development Web Version available at http://hdr.undp.org/en/data. United Nations Development Programme. 2016. World
Happiness Report on Chapter 2: The Distribution of World Happiness Available athttp://worldhappiness.report/wp-content/ uploads/ sites /2/2016/03/HR-V1Ch2_web.pdf. Weiner, E. J.2007. Four months of boom, bust, and fleeing
foreign credit. Los Angeles Times. Archived from the original on December 22, 2007.
World Economic Forum.2015. Global Competitiveness Report
2014-2015. Available at https://www.weforum.org/
reports/global-competitiveness-report-2014-2015
World Economic Forum. 1996. Global Competitiveness Report 1996. Geneva: World Economic Forum, pp.: 19. World Economic Forum. 2010. The Global Competitiveness
Report 2009–2010, pp: 3. Available at
https://www.weforum.org/reports/global-competitiveness-report-2009-2010.
World Health Organization. 2016.Preventing disease through
healthy environments: a global assessment of the burden of disease from environmental risks. Retrieved 4 August 2016
Wright, S. 1921. Correlation and Causation. Journal
Agricultural Research. Vol 20, pp:557-585.
Wright, S. 1934. The Method of Path Coefficients. Annals of
Mathematical Statistics, Vol 5 No. 3, pp: 161-215.
Doi:10.1214/aoms/1177732676.
Xavier, S.M. and Artadi, E.A, 2004. The Global
Competitiveness Index. Global Competitiveness Report,
Global Economic Forum.