THE EFFECTIVENESS OF UNDERFLOOR AIR DISTRIBUTION (UFAD) SYSTEM IN CONTROLLING THERMAL COMFORT AND INDOOR AIR
QUALITY
Shahreena Melati Rhasbudin Shah, Mohd Zainal Mohd Yusof, Abdul Mutalib Leman, Adnan Husain
Fakulti Kejuruteraan Mekanikal & Pembuatan, Kolej Universiti teknologi Tun Hussien Onn (KUiTTHO),
86400 Parit Raja Batu Pahat, Johor Darul Ta’zim
ABSTRACT
This paper presents the results of evaluation on the effectiveness of underfloor air distribution system in controlling thermal comfort and indoor air quality in an office building. The building chosen was Securities Commission’s building located in Mont Kiara, Damansara. The building was chosen because it is served with underfloor air distribution system for the office spaces air conditioning. Physical measurements were carried out such as air temperature, air velocity and relative humidity. Concentrations of carbon dioxide (CO2), carbon monoxide (CO), nitrogen dioxide (NO2), sulphur dioxide (SO2) and ozone (O3) were also monitored. Ventilation rates were determined in terms of percentage of outside air and air change rate (ACH). All the physical measurements were analysed and compared with ASHRAE Standard 55-92, ASHRAE Standard 62-89 and ISO Standard 7730-84. Selected results were : operative temperature = 21.8oC - 24.3oC, relative humidity = 54.9 % - 69.8 %, air velocity = 0.01 m/s - 0.11 m/s, concentration of CO2 = 487 ppm and ventilation rates = 19% outside air and ACH range between 0.24 and 0.48.
Keywords: IAQ, Air Distribution, Ventilation, Thermal Comfort
1. INTRODUCTION
1.1 Research Background
Malaysia is located in the tropical region with a hot and humid climate where a large number of the buildings are served by air-conditioning systems. Air-conditioning is a mean to achieve a controlled atmospheric condition of an enclosed space at all seasons of the year, using air as the medium of circulation and environmental control. Since most people spend most of their time indoors, thermal comfort and indoor air quality is a major concern in designing an air-conditioning system for buildings.
One of a new heating, ventilating and air-conditioning (HVAC) technology that is often overlooked is underfloor air distribution (UFAD) system. Underfloor air
computer rooms, control centres and laboratories applications. These systems then were adapted on the office buildings in the late 1970s to cope with modernization and
increasing use of electronics equipment (Hui and Li, 2002).
UFAD systems make use of a raised access floor for air distribution to provide air conditioning in buildings. The conditioned air is supply to the space through grills and diffusers at the floor level and is exhausted at the ceiling level through return grills.
An acceptable thermal comfort level and better indoor air quality is important to promote health and well being of building’s occupants. This research is basically to investigate the effectiveness of underfloor air distribution system in controlling thermal comfort and indoor air quality.
The potential benefits of UFAD system in Malaysia’s building application will be discussed by assessing thermal comfort parameters, concentration levels of main indoor contaminants and ventilation characteristics.
2. LITERATURE REVIEW
2.1 Underfloor Air Distribution System
The objective of air distribution in forced-air heating, ventilating, and air
conditioning systems is to create the proper combination of temperature, air velocity, and air-contaminant concentrations in the occupied zone of the conditioned space. For human being, acceptable thermal-comfort conditions are to be maintained and the indoor air-contaminant concentrations should be controlled to assure safety and health (Kuehn et all, 1998).
Airflow patterns and currents that are created from the locations of supply diffusers and returns grilles in the occupied space affect thermal comfort. The American Society of Heating, Refrigerating and Air-Conditioning Engineers (ASHRAE) has researched the patterns of airflows based upon location and velocity of the supplied air in terms of the coverage of the occupied zone. One innovative trend emerging in new designs is to supply conditioned air at the floor rather than the ceiling level. The
conditioned air will flow from the floor level near the occupied zone and return through ceiling grilles above the occupied zone. This pattern creates a displacement air
below a raised floor system with supply registers located in the floor, fed from an underfloor supply plenum; 2) since air is supplied closer to occupants than in
conventional overhead systems, supply air temperatures must be much higher; 3) the velocity of delivered air is low to support thorough mixing within the space; and 4) varying degrees of individual occupant thermal and ventilation control provided via individually operable supply registers (Addison and Nall, 2001).
2.2 Thermal Comfort
Thermal comfort is defined as “that condition of mind in which satisfaction is expressed with the thermal environment”. This means that a person who is in a condition of thermal comfort feels thermally neutral for the body as a whole. Air temperature, radiant temperature, air speed and relative humidity are four physical parameters that define the thermal environment. Besides the environmental factors, man’s comfort is also influenced by activity level and clothing (ANSI/ASHRAE Standard 55-1992).
2.3 Indoor Air Quality
The HVAC system does not only provide comfort but also involve in maintaining of a clean, healthy and odour-free indoor environment, which is commonly known as indoor air quality (IAQ). Maintaining good indoor air quality involves keeping gaseous and particulate contaminants below some acceptable level in the indoor environment.
Carbon dioxide (CO2) is one the most important IAQ parameters measured in buildings. ASHRAE Standard 62-1989 recommend that indoor CO2 concentrations be below 1000 ppm. Carbon monoxide (CO) is a colourless and odourless gas that can be lethal. High indoor concentrations (greater than 35 ppm) of CO can cause headaches and nausea. Ozone (O3) is a form of oxygen that is highly reactive. Exposure to significantly high concentrations can cause mucous membrane and respiratory irritation, and headaches (Meckler, 1996).
the air contaminants present in space determine by ventilation rate divided the volume of the space (Kwok, 2001).
2.4 Field Study on Thermal Comfort and Indoor Air Quality
The distributions of air velocity, temperature, perceived air quality, contaminants concentrations, and thermal comfort in an office under six kinds of air diffusion have been computed by an airflow program with a low-Reynolds-number k-ε model of turbulence. Chen et.al (1991). These was a uniform vertical air distribution for side wall grille, horizontal ceiling diffuser and floor unit. Small and moderate temperature gradients were noticed for floor diffuser and vertical ceiling diffuser. The percentage people dissatisfied, PD in ration to thermal comfort and indoor air quality were between 10% - 15% and 15% - 25% respectively.
In Malaysia, M. Zainal and Adnan (1998) conducted an indoor air quality research in industrial buildings. Measurements of concentrations level of main indoor
contaminants and air exchange rate were carried out. The measured concentrations of carbon dioxide (CO2) ranged between 534 and 1412 ppm, carbon monoxide (CO) level ranged from 1 to 3 ppm, sulphur dioxide (SO2) level is 0.3 ppm, oxidants (O3) level is 0.04 ppm, nitrogen dioxide (NO2) level is 2.2 ppm and air exchange rate (ACH) ranged from 0.1 to 0.3. This study was conducted during the period when the country was facing the environmental haze.
Research on thermal comfort in air-conditioned office building conducted by Azizi Mursidy (1997) show that air temperature in the range of 21.8 to 25.9o C, mean radiant temperature ranged from 25.5 to 26.3 o C, relative humidity ranged from 52.5 to 67.8 % and air velocity ranged from 0 to 0.48 m/s. Percentages of dissatisfaction (PPD) in some locations was high (more than 20%) due to low temperature.
3. RESEARCH METHODOLOGY 3.1 Project Scope
The main objective of the project is to evaluate the effectiveness of underfloor air distribution system in controlling thermal comfort and indoor air quality in office
building. In order to achieve the objective of the project, the scope of works are as follows:
1. Measuring of environmental parameters such as air temperature, relative humidity and air velocity.
2. Monitoring the concentrations levels of CO, CO2, SO2,NO2, and O3.
3. Ventilation study consists of air exchange rate and percentage of outdoor air. 4. Comparing the results with recommended standards.
3.2 Initial walkthrough
An initial building walkthrough is carried out to identify the potential study areas, gather available information and documentation such as floor plans and air- conditioning and ventilation systems drawings.
3.3 Instruments and measurement methods
The instruments use in the research are temperature/humidity meter, anemometer, comfort meter, IAQ monitor and tracer gas analyser. The measurement methods and procedures are based on ISO / ASHRAE standards.
3.4 Data collection
4. RESULTS AND DISCUSSION 4.1 Thermal Comfort Parameters 4.1.1 Air Temperature
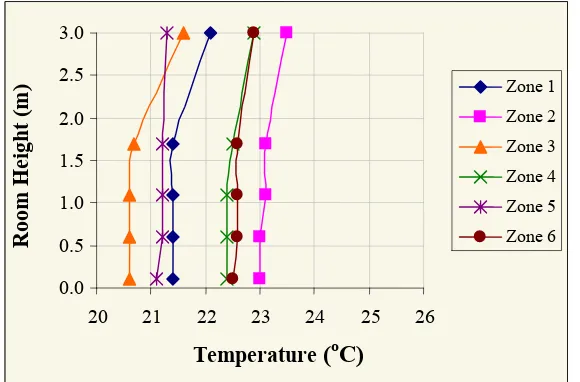
Air temperature was measured at 4 different height by anemometer which has a build in thermometer. The final values of air temperature measured in each zone for every level are shown in Figures 1(a) – (d).
3.0
2.5 Zone 1
Room
Height (m
)
Zone 2 2.0
Zone 3 1.5
Zone 4
1.0 Zone 5
Zone 6 0.5
0.0
20 21 22 23 24 25 26
Temperature (oC)
Figure 1(a) : Variation of air temperature with heights – Level 1
0.0 0.5 1.0 1.5 2.0 2.5 3.0
20 21 22 23 24 25 26
Temperature (oC)
Room
Height (m
) Zone 1Zone 2
Zone 3 Zone 4 Zone 5 Zone 6
[image:6.595.166.456.213.404.2]3.0
Room
Height (m
)
2.5 Zone 1
Zone 2 2.0
Zone 3 1.5
Zone 4
1.0 Zone 5
Zone 6 0.5
0.0
26
20 21 22 23 24 25
Temperature (oC)
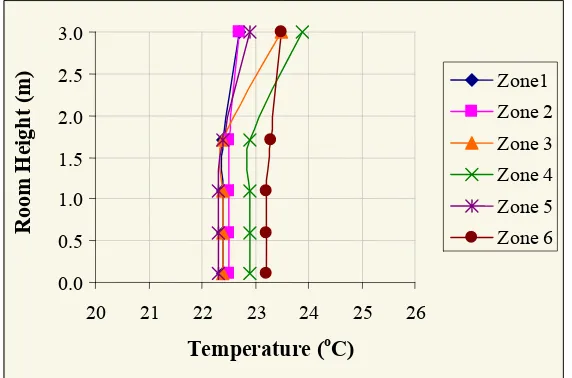
Figure 1(c) : Variation of air temperature with heights – Level 4
0.0 0.5 1.0 1.5 2.0 2.5 3.0
20 21 22 23 24 25 26
Temperature (oC)
Room
Height (m
) Zone1
Zone 2 Zone 3 Zone 4 Zone 5 Zone 6
Figure 1(d) : Variation of air temperature with heights – Level 5
Supply air temperature varied within 13.5oC and 17.4oC. These values are lower than typical supply air temperature (17 to 18oC) in the underfloor air distribution system. The return air temperature was between 21.3oC and 23.9oC.
Measurements carried out in each zone confirmed the effectiveness of the floor outlets by achieving a temperature difference of less than 0.3oC at floor level to 1.70 m height.
4.1.2 Operative Temperature
Operative temperature was average from 3 different equipments. The
[image:7.595.165.451.314.503.2]values of operative temperature measured by all equipment in each zone for every level are shown in Table 1. Mean value of operative temperature was 23.2oC with range of 21.8oC to 24.3oC.
Table 1: Distribution of Operative Temperature
1 2 4 5
Level
Zone MA LA MA LA MA LA MA LA
1 22.9 22.4 23.5 23.3 23.7 23.3 23.4 23.0
2 23.8 23.8 22.7 22.5 23.6 23.9 23.0 23.2
3 22.3 21.8 23.6 23.4 23.4 23.5 23.2 23.3
4 23.5 23.0 22.6 22.3 23.3 22.9 24.0 23.4
5 22.2 22.2 22.6 22.6 22.7 22.9 23.1 23.7
6 23.7 23.5 22.8 22.6 24.3 24.0 24.2 23.9
MA: Morning to Afternoon LA: Late Afternoon
The average value of operative temperature for both time (morning to afternoon and late afternoon) in each zone were within the ASHRAE summer comfort zone limits (22.5 – 26oC) except for zone 3 and 5 in level 1, the average operative temperature measurements were 22oC and 22.2oC respectively, slightly below the ASHRAE summer comfort zone limits (22.5 – 26oC).
5.1.3 Relative Humidity
Table 2: Distribution of Relative Humidity (%)
MA: Morning to Afternoon
1 2 4 5
Level
Zone MA LA MA LA MA LA MA LA
1 64.3 62.3 60.6 57.9 59.0 62.2 65.6 64.1
2 64.3 61.4 69.8 61.9 64.9 66.7 63.5 63.5
3 58.4 55.3 61.1 56.9 57.5 60.8 61.6 63.5
4 60.3 56.6 60.5 57.7 54.9 60.0 63.8 66.3
5 62.6 57.7 65.8 63.2 63.2 66.5 65.2 67.3
6 62.8 57.6 66.0 64.7 60.7 61.2 64.7 68.4
LA: Late Afternoon
5.1.4 Air Velocity
The air velocity was measured for 2 days at 4 different heights, then later were averaged. Air velocity in the occupied zone was within 0.01 m/s to 0.11 m/s. The mean air velocity was 0.06 m/s. Table 3 shows the final analysis of air velocity in morning to afternoon and late afternoon.
Table 3: Distribution of Air Velocity (m/s)
MA: Morning to Afternoon
1 2 4 5
Level
Zone MA LA MA LA MA LA MA LA
1 0.06 0.05 0.01 0.03 0.04 0.10 0.05 0.05
2 0.03 0.04 0.06 0.05 0.08 0.08 0.04 0.08
3 0.06 0.05 0.03 0.03 0.06 0.11 0.05 0.06
4 0.03 0.03 0.06 0.05 0.04 0.09 0.04 0.03
5 0.05 0.04 0.04 0.04 0.06 0.07 0.08 0.10
6 0.05 0.05 0.09 0.08 0.05 0.09 0.07 0.07
4.2 Indoor Air Quality Parameters 4.2.1 Carbon Dioxide
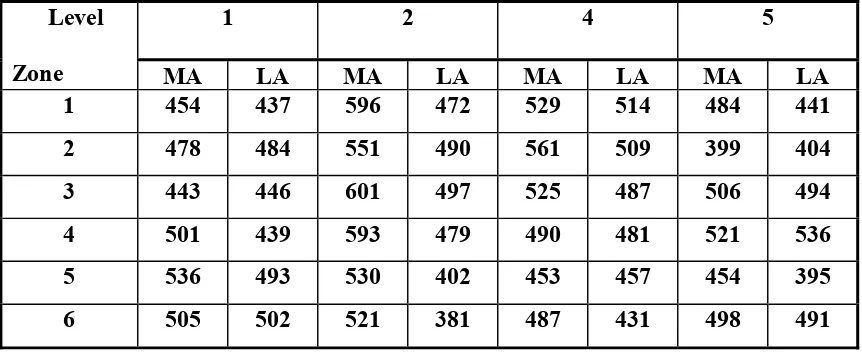
[image:10.595.84.515.288.464.2]Measurements of carbon dioxide were taken over a period of 2 days in morning to afternoon and late afternoon using IAQ Monitor. The concentration of carbon dioxide in the buildings varied between locations. Carbon dioxide concentrations ranged between 381 and 601 ppm with an average concentration of 487 ppm. These values are below the ASHRAE standards recommended maximum value of 1000 ppm. Table 4 shows the concentrations of carbon dioxide in each zone of level 1, 2, 4 and 5.
Table 4: Concentrations of Carbon Dioxide (CO2)
1 2 4 5
Level
Zone MA LA MA LA MA LA MA LA
1 454 437 596 472 529 514 484 441
2 478 484 551 490 561 509 399 404
3 443 446 601 497 525 487 506 494
4 501 439 593 479 490 481 521 536
5 536 493 530 402 453 457 454 395
6 505 502 521 381 487 431 498 491
MA: Morning to Afternoon LA: Late Afternoon
5.2.2 Carbon Monoxide
Measurements of carbon monoxide concentration in various locations are 0 ppm except for zones 1 and 4 in level 1, the average concentration level were 0.02 and 0.04 ppm respectively. An air-conditioned office space should not have any sources of carbon monoxide since smoking is prohibited. However, these values are far below the
recommended values.
5.2.3 Chemical Contaminants
Chemical contaminants consist of ozone, SO2, NO2 and alsoCO2 were monitored over 1/2 hour period in selected zones for every levels by AQ – 502 Indoor
Table 5: Measured chemical contaminants concentration in the occupied zone Chemical Contaminants Concentration (ppm) Level CO2 Ozone SO2 NO2
1 682 0.06 0.3 0.2 2 871 0.02 0.3 0.2 4 835 0.03 0.3 0.2 5 816 0.03 0.3 0.2
Average 801 0.04 0.3 0.2
4.2.4 Ventilation Rates
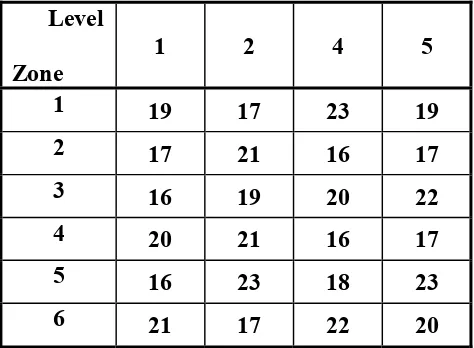
Ventilation rates were measured in terms of percentage of outside air and air change rate per hour (ACH). IAQ Monitor was used to measured percentage of outside air. Concentrations decay profiles of carbon dioxide were used to determine the air change rates (ACH). The percentage of outside air is shown in Table 6 (a). Percentage of outside air was within 16% and 23% with an average of 19%.
Table 6 (a) : Distribution of Outside Air (%)
Level
Zone 1 2 4 5
1 19 17 23 19
2 17 21 16 17
3 16 19 20 22
4 20 21 16 17
5 16 23 18 23
[image:11.595.84.321.447.621.2]Table 6 (b) : ACH and CFM / person Level ACH
A
Volume (ft3)
B
CFM C = AB/60
No of person D CFM/pers on C/D 1 (library) 0.24 78000 312 20 15.6 2 (office space) 0.44 66400 487 23 21.0 3 (office space) 0.48 66000 528 25 21.0 4 (office space) 0.41 18000 123 6 20.5
Table 6 (b) shows results of ACH and CFM of outdoor air per person. ACH values range between 0.24 and 0.48. The outdoor air requirements (CFM/person) are generally adequate based on the ASHRAE Standard with value of a minimum 15 cfm/person for library and 20 cfm/person for office space.
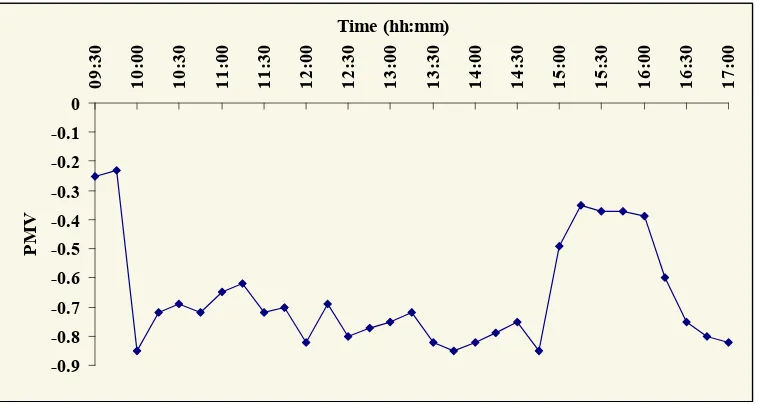
5.3 Distribution of Predicted Mean Vote, PMV
Uniformity of the thermal climate within the working area can be evaluated by measuring the PMV values at a chosen workplace simultaneously. PMV values were monitored over a period of 7 and a 1/2 hour interval by Comfort Meter 1212 at level 4 (zone 4). Figure 2 shows the distribution of PMV value over time for every 30 minutes.
[image:12.595.119.498.509.711.2]-0.9 -0.8 -0.7 -0.6 -0.5 -0.4 -0.3 -0.2 -0.1 0 09: 30 10: 00 10: 30 11: 00 11: 30 12: 00 12: 30 13: 00 13: 30 14: 00 14: 30 15: 00 15: 30 16: 00 16: 30 17: 00 Time (hh:mm) PM V
Referring to Figure 2, it shows that the distributions of PMV values were varied over time. The value falls below –0.5 starting from 10.00 am till 14.45 pm, showing that the temperature in the workplace was slightly low i.e, slightly cool.
[image:13.595.87.531.241.328.2]Results of thermal comfort and IAQ parameter in the building spaces using UFAD system are compared with existing standards as in Tables 7 and Table 8.
Table 7 : Comparison of thermal parameter with current standard.
Thermal Parameter Present Study ASHRAE 55-92 ISO 7730-84
Operative Temperature (oC) 21.8- 24.3 22.5 - 26 23 – 26 Relative Humidity (%) 54.9 - 69.8 40 - 60 30 - 70 Air Velocity (m/s) 0.01 - 0.11 0.15 < 0.25
From Table 7, it shows that the operative temperature was within the limit of both standards except for some places. For relative humidity, the value was slightly above the ASHRAE 55-92 standard but does not exceed the ISO 7730-84 standard. As for the air velocity, the value was within both current standards.
[image:13.595.88.528.553.683.2]In this research, the vertical air temperature difference ranged between 0oC and 0.2oC, this value does not exceed 3oC recommended by ISO 7730. The floor temperature also was within the limit of 19oC and 29oC recommended by ISO 7730.
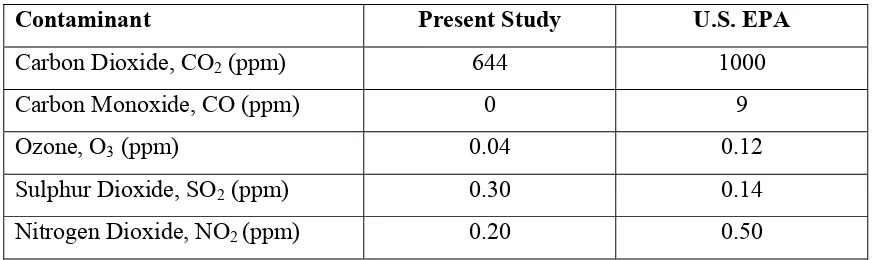
Table 8 : Comparison of chemical contaminants parameter with current standard.
Contaminant Present Study U.S. EPA
Carbon Dioxide, CO2 (ppm) 644 1000 Carbon Monoxide, CO (ppm) 0 9 Ozone, O3 (ppm) 0.04 0.12 Sulphur Dioxide, SO2 (ppm) 0.30 0.14
Nitrogen Dioxide, NO2 (ppm) 0.20 0.50
concentrations of carbon dioxide, carbon monoxide, ozone and nitrogen dioxide do not exceed the recommended values. As for the sulphur dioxide concentrations, the value exceeds the recommended value but still below 0.5 ppm where the odour can be detected.
6.3 Conclusion
The application of an underfloor air distribution (UFAD) system resulted in acceptable thermal comfort and indoor air quality control in an office space. The results for thermal comfort shows that the operative temperature in the building was in the range of 21.8oC to 24.3oC, the relative humidity was 54.9 to 69.8% and the air velocity was 0.01 to 0.11 m/s.
The vertical variation of air temperature within the occupied zone was less than 0.3oC, which is required to prevent ‘local discomfort’ of sensitive parts (such as knee, shoulder and back of the neck) of the human body.
The air quality in the building was acceptable with adequate ventilation and major indoor air contaminants (CO and CO2) below the recommended values as set by the U.S. EPA. The calculated PMV and PPD indices by comfort meter indicating that the
occupants perceived the room to be slightly cool, but UFAD system allows the occupants to control their own local thermal environment by adjusting the amount of conditioned air around their working stations.
REFERENCES
Addison, M.S. and Nall, D.H. (2001). “Cooling via Underfloor Air Distribution: Current Design Issues and Analysis Options.”Cooling Frontiers: The Advanced Edge of Cooling Research and Applications in the Built Environment. 2001.
Adnan Bin Husain (1997). “Investigation On Thermal Comfort In Factory Environment” Universiti Teknologi Malaysia: Tesis Sarjana.
Azizi Mursidy Bin Zainol Abidin (1997). “Kajian Keselesaan Termal Dalam Sistem Penyaman Udara Di Bangunan Pejabat.” Institut Teknologi Tun Hussein Onn: Tesis Sarjana Muda.
Cheong, K.W. and Chong, K.Y. (2001). “Development And Application Of An Indoor Air Quality Audit To An Air-Conditoned Building In Singapore”, Building And Environment 2001, 36, pp. 181 – 188.
Hays, S.M., Gobell, R.V., and Ganick, N.R. (1995). “Indoor Air Quality-Solutions And Strategies.” Mc Graw-Hill.
Hui, S. C. M. and Li, Y. (2002). “Enhancing Sustainability Of Buildings By Using Underfloor Air Conditioning Systems”, Proc. of the Chonqing-Hong Kong Joint Symposium 2002, 8-10 July 2002, Chongqing, China, pp. A113 - 121.
Kuehn,T.H., Ramsey, J.W., and Threlkeld, J.L. (1998). “Thermal Environmental Engineering” (3rd Edition), Prentice Hall.
Meckler, M. (1996). “Improving Indoor Air Quality Through Design, Operation, And Maintenance.” Prentice Hall.