The Bangla Version of the Miller Social Intimacy Scale:
An Exploratory Study
Naima Nigar
*, A. K. M. Rezaul Karim , Mahmudul Hasan Sagar
Department of Psychology, University of Dhaka, Bangladesh *Corresponding Author: [email protected]
Copyright © 2014 Horizon Research Publishing All rights reserved.
Abstract Intimacy is an important component of
interpersonal relationship. The Miller Social Intimacy Scale (MSIS) was developed (Miller & Lefcourt, 1982) to measure social intimacy, to quantify the degree of emotional closeness a person felt toward another person. The aim of this study was to translate the MSIS into Bangla and validate in Bangladeshi culture. Data were collected from 177 university students (77 females and 100 males) using survey method. Exploratory factor analysis (EFA) of the data from 172 participants (who provided complete responses) identified a two factor structure of the MSIS with 12 items. The Two factors namely ‘Frequency’ of intimate contact, and ‘Intensity’ of intimate relations together explained 49.20% of the total variance. The MSIS and its factors showed good internal consistency (Cronbach’s α = .83 for the MSIS, .75, for ‘Frequency’ dimension and .79 for‘Intensity’ dimension), strong convergent and discriminant validity. Thus, the Bangla version MSIS appears to be valid and reliable and therefore can be used in further research on interpersonal relationship of the people in Bangladesh.
Keywords
Social Intimacy, Psychometric, Factor Analysis, Validity, Reliability1. Introduction
People live in a society with their near and dear ones. Being a social animal it is hard for people to lead a loner life. To live a healthy life and work effectively one must maintain an intimate and healthy relationship with their loved ones. According to Robert Sternberg’s (1986) triangulation theory, there are three components of love in interpersonal relationship- intimacy, passion, and commitment. Intimacy encompasses feelings of attachment, closeness, connectedness and bondedness. Studies have shown that people with higher intimacy in their relationships are more satisfied with their life (Kim & Hatfield, 2004), and that depression and less satisfied school life are associated with poor social intimacy in adolescents (Okada, Suzue, & Jitsunari, 2010). Other studies showed that psychopathy was negatively associated with life satisfaction and intimacy (Ali,
& Chamorro-Premuzic, 2010). Intimacy provides a sense of security and belonging, a perception that one is cared for deeply (Reis & Shaver, 1988). Present life intimacy with the loved ones not only tells us about the quality of relationship but also helps us to predict about one’s early life attachment with the parents. Because close and intimate relationships with parents in early life shape-up all our future relationships (Bowlby, 1982). Thus social intimacy is one of the important dimensions of interpersonal relationship. Intimacy encompasses feelings of attachment, closeness, connectedness and bondedness. Thus to understand the strength of interpersonal relationship it is important to know the level of intimacy of relationship. In order to measure the intimacy in interpersonal relationship Miller developed a psychological measure of social intimacy, to quantify the degree of emotional closeness a person felt toward another person such as a family member, spouse, partner, or friend (Miller & Lefcourt, 1982). It is a widely used scale in western countries. The factor structure of the MSIS was examined by Downs and Hillies (1991). In their study they examined internal reliability and principal components of the scale for non-spousal same and mixed-sex dyads with 149 male and 210 female undergraduate students. Analyses yielded high internal reliability overall and unique multidimensional structures for each dyad type. However, no work has yet been done to measure the social intimacy in eastern culture. Therefore the present study was designed to validate the Miller Social Intimacy Scale (MSIS) in Bangladeshi culture. It is really very important to adapt this scale in Bangladeshi culture because there is no valid measure available in the country to measure intimacy among the young people. Such an adapted measure can be used in further research on interpersonal relationship of Bangladeshi people. The findings would have implications for theory, research and clinical practice.
2. Method
2.1. Participants
in this study. Because of incomplete responses 5 participants (2 females and 3 males) were dropped. The age of the remaining 172 participants ranged from 18 to 25 years with a mean of 22.33 and standard deviation (SD) of 2.01. Of the participants, 43.6% were females and 56.4% were males. The female participants’ age ranged from 18 to 25 years with a mean of 22.11 and SD of 1.89 and the male participants’ age ranged from 18 to 25 years with a mean of 22.49 and SD of 2.09. 83.1% of the participants were single, 7.6% were married, 6.4% were in a relationship, 1.2% were divorced, and 1.7% were separated.
2.2. Measures
2.2.1. Miller Social Intimacy Scale
The MSIS is a 17-item tool designed to assess intimacy in a variety of relationships such as friendships, family and spouse (Miller & Lefcourt, 1982). Each of the items is rated on a 10-point scale, ranging from 1 (very rarely) to 10 (almost always). The higher the score on MSIS the higher is the intimacy. Internal consistency (Cronbach’s a) of the MSIS ranges from .86 to .91, the test–retest reliability coefficients being .84 for one-month interval and .96 for a two- month interval (Miller & Lefcourt, 1982).
2.2.2. Internet Addiction Test
The Bangla version of the Internet Addiction Test (IAT) was used to examine the discriminant validity of the Bangla version MSIS. The original IAT is a 20-item tool designed to assess internet addiction (Young, 1996). The Bangla version instrument comprises 18 items under four dimensions (Karim & Nigar, 2014). Each of the items is rated on a 5-point scale, ranging from 1 (rarely) to 5 (always). The higher the score on IAT the higher is the addiction. The original IAT has exhibited good psychometric properties in various researches. The internal consistency (Cronbach α) of the IAT was found to be 0.92 and test-retest reliability was satisfactory (Yang, Choe, Baity, Lee & Cho, 2005). It has also high face validity (Widyanto & McMurran, 2004). The psychometric properties of the Bangla version IAT also support that it is a reliable and valid measure of social intimacy (Karim & Nigar, 2014).
2.3. Procedure
2.3.1. Translating the MSIS into Bangla
The MSIS items were first translated into Bangla, called the first draft. It was then given to four judges, including one expert in Bangla, one expert in English and two experts in Psychology/ Psychometrics. Their native language was Bangla, but being professors/lecturers of a university or college they had also very good command in English. Their task was to judge the accuracy of translation and relevance/suitability of each item for measuring Intimacy in the socio-cultural context of Bangladesh. Each expert independently rated the translation using a 2-point scale (0 = Not correct, 1 = Correct) and the relevance of each item using another 2-point scale (0 = Not relevant, 1 = Relevant). Following their evaluation, accuracy of the translation was
examined by calculating for each item the Accuracy Index (AI = Number of rating at 1/Number of experts; Karim & Nigar, 2014). The item yielding an AI of 1 (AI = 4/4) was considered to be correctly and reliably translated. All the four experts rated 13 items’ translation at 1, the AI for each of them becoming 1. The remaining 4 items’ yielded an AI of less than 1. They also identified conceptual similarity between Item 1 and Item 7 and between Item 6 and Item 9. So, item 7 and item 9 were excluded. Furthermore, two other items (Item 3 and Item 16) were reviewed in the light of the comments and suggestions of the judges to ensure the accuracy of translation. The relevance/suitability of the items in Bangladeshi culture was further examined by calculating for each item the Relevance Index (RI = Number of rating at 1/Number of experts; Karim & Nigar, 2014). The item yielding an RI of 1 or .75 (RI = 4/4 or RI = 3/4) was considered to be relevant or suitable. All the four experts rated the relevance of each item at 1, the RI for them becoming 1. Thus the second draft of the Bangla version MSIS was finalized to administer on the selected participants.
2.3.2. Data Acquisition
Each participant was briefed about the general study purpose and requested to volunteer in the study. Participants were assured that their responses would be kept confidential and used only for research purposes. After getting their verbal consent the paper-based survey (2nd draft) was administered in person. The survey components included an informed consent statement, socio-demographic section, the IAT and the MSIS. Participants were asked to sign on the consent paper, record the socio-demographic information (age, gender, education, marital status and SES), and read carefully the standard instructions of how to respond before going through the items or questions of the test/scale. Thus the surveys were administered and data were collected over a 6-week period from all the participants.
2.4. Data Analyses
However, before carrying out factor analysis we examined the response distributions of all MSIS items and estimated their internal consistency by investigating inter-item correlations and item-total correlations. Then we analyzed the data in EFA, a method widely used to uncover the underlying structure of a relatively large set of variables (e.g., Gratz & Roemer, 2004; Hawi, 2013; Muris, 2001; Widyanto, Griffiths, & Brunsden 2011; Widyanto & McMurran, 2004). We also examined the discriminant validity by correlating the MSIS and MSIS subtests with the IAT and the reliability by estimating internal consistency (Cronbach’s α) of the full test and subtests as well.
3. Results
3.1. Factor Structure 3.1.1. Item Analysis
Response distributions of the MSIS items indicated that none of these variables/items were excessively skewed or kurtotic (Kendall & Stuart, 1958; Karim & Nigar, 2014). The correlation matrix (R-matrix 1,) contained 6 negative values out of 120 inter-item correlation coefficients. It also contained one negative item-total correlation coefficient. This excluded 2 items (item no. 8 and 14) at this stage of item analysis. Thus 13 items were retained for factor analysis. For these 13 items 91 inter-item correlation coefficients were obtained of which 6 were non-significant, the average inter-item correlation coefficient being .31 (R-matrix 2, Table 1). The item-total correlations for these items were
significant and ranged from .47 to .65 with a mean of .59. 3.1.2. Factor Analysis
First, in order to examine whether data were suitable for factor analysis, measures of sampling adequacy were carried out on the 13-item MSIS. Inspection of the R-matrix revealed a substantial number (43.96%) of coefficients .30 and above. The determinant of the R-matrix was .02 (>.00001, Field, 2005), indicating that there was no multicolinearity (very highly correlated variables) or singularity (perfectly correlated variables) problem. The Kaiser–Meyer–Olkin (KMO) measure indicated a value of .79 which exceeded the recommended value of .60 (Kaiser, 1970) and Bartlett’s test of sphericity indicated a χ2 value of
652.42 (p < .001). All this together supports the factorability of the R-matrix. Data for the full set of MSIS items were therefore subjected to EFA. Method of principal component (PC) with varimax rotation was used. The initial analysis with eigenvalue > 1.00 (the Kaiser–Guttman criterion) extracted 3 factors structure of the MSIS with 13 items was identified, accounting for 54.55% of the total variance (data not shown). However, Floyd and Widaman (1995) suggested that the scree test (Cattell, 1966) is a more accurate method for retaining factors than the Kaiser–Guttman criterion. Inspection of the scree plot revealed a clear break after the 2nd component (Figure 1A), leading us to retain 2 components. Therefore, we analyzed the data in another EFA, limiting the number of factors to 2 with all factor loadings < .40 suppressed. The two factors together accounted for 46.33% of the total variance (data not shown). Results further revealed that one item (Item 02) loaded at <.40.
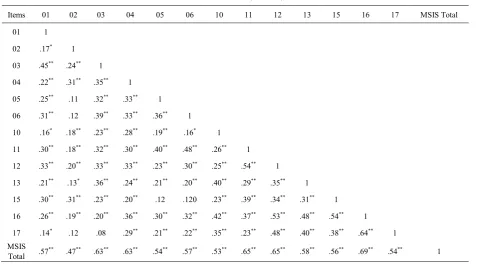
Table 1. Correlation matrix (R-matrix) for MSIS
Items 01 02 03 04 05 06 10 11 12 13 15 16 17 MSIS Total
01 1 02 .17* 1 03 .45** .24** 1 04 .22** .31** .35** 1 05 .25** .11 .32** .33** 1 06 .31** .12 .39** .33** .36** 1 10 .16* .18** .23** .28** .19** .16* 1 11 .30** .18** .32** .30** .40** .48** .26** 1 12 .33** .20** .33** .33** .23** .30** .25** .54** 1 13 .21** .13* .36** .24** .21** .20** .40** .29** .35** 1 15 .30** .31** .23** .20** .12 .120 .23** .39** .34** .31** 1 16 .26** .19** .20** .36** .30** .32** .42** .37** .53** .48** .54** 1 17 .14* .12 .08 .29** .21** .22** .35** .23** .48** .40** .38** .64** 1 MSIS
Total .57** .47** .63** .63** .54** .57** .53** .65** .65** .58** .56** .69** .54** 1 Note. N = 172; average inter-item correlation = .31; average item-total correlation = .59.
[image:3.595.69.548.486.750.2]Figure 1. The scree plots generated in EFA: (A) for 13 items, and (B) for 12 items.
These low factor loadings indicated that perhaps the items do not represent social intimacy in Bangladeshi culture. After discarding this one item, data were subjected to a final EFA with all factor loadings < .40 suppressed. Though the EFA was run this time without specifying the number of factors a two-factor structure of the MSIS with 12 items was identified, consistently with the scree plot (Figure 1B). These two factors, which were rotated to position of maximum orthogonality in three iterations, explained together 49.20% of the total variance (Table 2).
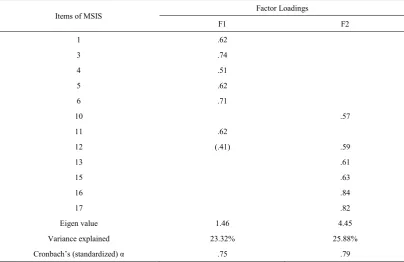
Table 2. Rotated factor matrix for MSIS items
Items of MSIS Factor Loadings
F1 F2
1 .62
3 .74
4 .51
5 .62
6 .71
10 .57
11 .62
12 (.41) .59
13 .61
15 .63
16 .84
17 .82
Eigen value 1.46 4.45
Variance explained 23.32% 25.88%
Cronbach’s (standardized) α .75 .79
Factor loadings <.40 were suppressed.
Extraction method: principal component analysis Rotation method: varimax with Kaiser normalization Rotation converged in 3 iterations
Note. N= 172
[image:4.595.103.508.425.687.2]should be noted that item 11 was under the dimension of ‘Intensity’ of intimate relation in the original scale but through factor analysis it is grouped under the dimension of ‘Frequency’ in the present study. Factor 2 comprises items 10, 12, 13, 15, 16 and 17 which we termed as ‘Intensity’ consistently with the dimension of the original scale.
3.3. Validity
3.3.1. Convergent Validity
[image:5.595.103.507.235.329.2]Convergent validity of the Bangla version MSIS was examined by estimating inter-factor correlations and the factor-MSIS total correlations. The inter-factor correlations (Pearson’s r) were all significant, the coefficient ranging from .56 to .93 (Table 3). The two MSIS factors also significantly correlated with the full MSIS, with the coefficients ranging from .82 to .93. The MSIS had stronger correlation with F1 (Frequency) and the weaker with F2 (Intensity).
Table 3. Correlation matrix for 12-item Bangla MSIS and two MSIS factors.
MSIS Factors/MSIS F1: Frequency F2: Intensity MSIS
F1: Frequency 1
F2: Intensity .53** 1
MSIS .90** .84** 1
Note: N = 172. ** p < .01 (one-tailed) 3.3.2. Discriminant Validity
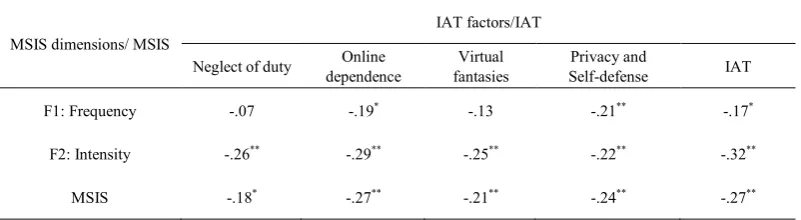
Discriminant validity of the Bangla version MSIS was examined by correlating the MSIS and MSIS factors with the Bangla version IAT and IAT dimensions. Negative or non-significant correlations were hypothesized between the measures in order for them to have discriminant validity. As hypothesized, the MSIS and MSIS factors were correlated significantly and negatively with the IAT (r = -.17 to -.27, Table 4) and one of the MSIS factor (F2: Intensity) correlate significantly and negatively with all the IAT dimensions: Neglect of Duty; Online Dependency; Virtual Fantasy; and Privacy and Self-defense (r = -.22 to -.29), and the another Factor (F1: Frequency) correlate non-significantly with the IAT: Neglect of Duty (r = -.07) and Virtual Fantasy (r = -.13) but significantly and negatively with IAT: Online Dependency (r = -.19) and Privacy and Self-defense (r = -.23). All these correlations strongly support the discriminant validity of the measures.
Table 4. Correlations of the 12-item Bangla MSIS and MSIS factors with the Bangla IAT and IAT dimensions.
MSIS dimensions/ MSIS
IAT factors/IAT
Neglect of duty dependence Online fantasies Virtual Self-defense Privacy and IAT
F1: Frequency -.07 -.19* -.13 -.21** -.17*
F2: Intensity -.26** -.29** -.25** -.22** -.32**
MSIS -.18* -.27** -.21** -.24** -.27**
Note: N = 172. * p < .05 (one-tailed) ** p < .01 (one-tailed).
3.4. Reliability
3.4.1. Internal Consistency
The inter-item correlation matrix (Table 1) contained no negative values, indicating that the items were measuring the same characteristic. The reliability of the Bangla version MSIS was further examined by estimating internal consistency. The coefficients of Cronbach’s α were calculated. Cronbach’s α (standardized) for the full MSIS was .83. The coefficients for the ‘Frequency’ and ‘Intensity’
subtests were .75 and .79 respectively (Table 2).
4. Discussion
[image:5.595.106.507.492.602.2]information, understanding feelings, feeling close, spending time, satisfying relationship) and Factor 2 measures
‘Intensity’ of intimate relations (e.g., listen to personal disclosure, affectionate towards loved ones, understanding feelings, encouragement and support in relationship, importance of affection, importance of relationship). These factors together accounted for 49.20% of the variance. Factor 1 accounts for 23.32% of the variance and Factor 2 accounts for 25.88% of the variance. The factors show high internal consistency (.75 and .79). As shown in Table 3, both the factors were significantly correlated with the whole MSIS (r
= .90 for factor 1 and .84 for factor 2, p < .01). The moderate inter-correlations of the factors (r = .53, p < .01) support the representation of the factors as unique, distinguishable components (Jelenchick, Becker & Moreno, 2012).
As mentioned before only one study was conducted to assess the structure of the MSIS in western culture (Downs & Hillies, 1991). In their analyses they found high internal reliability over-all and unique multidimensional structures. But, the present study demonstrated tow factors similar to the original scale (Miller & Lefcourt, 1982). The original scale was a 17-item measure, however, the present study demonstrated that it has 12 valid items. Item 7 and item 9 were excluded during the translation stage because of their conceptual similarity with item 1 and item 6 respectively. And item 8 and 14 were excluded due to their negative correlations with other items and/or with the MSIS. If we inspect the items we see that both item 1 and item 7 are about spending time with their loved ones and item 6 and item 9 are about how one feels close to their intimate ones. Item 8 is about ‘How much do you feel like being encouraging and supportive to him/her when he/she is unhappy?’ This item emphasizes one’s role as an encourager and supporter in a relationship when his/her partner is unhappy. In this type of item people either like to overrate or underrate one’s role in a relationship. Because of this nature of item 8 it might have negative correlations with other items. Item 14 is about the amount of damage caused by typical disagreement in a relationship with partner. This is actually a vague item with which some participants who are not confident about their interpersonal relationship might agree with the statements while others who are confident about their relationship might not agree. Thus some participants might respond positively while others negatively.
The most important aspect of this study is that it demonstrated a two-factor model of the MSIS consistently with the original scale (Miller & Lefcourt, 1982). It is unclear why this item which is valid in other countries is not valid in Bangladeshi culture. A second important aspect of this study is that item 11 was identified under the dimension of ‘Frequency’ sub-scale which was under the dimension of
‘Intensity’ sub-scale in the original scale. This item is about ‘How often do you keep very personal information to yourself and do not share it with him/her?’ Satisfaction means
fulfillment of one’s
wishes, expectations, needs, or pleasure (Oxford Dictionaries, 2014). Thus satisfaction is not a constant state rather it changes over time. That is why people may feel satisfied with their relationship at some point of time but dissatisfied at other time. Thus it can be argued that this item fits well under the ‘Frequency’dimension, not under the ‘Intensity’ dimension.
Another important aspect of the present study is that it demonstrated discriminant validity of the MSIS. As hypothesized we found Internet addiction to be significantly and negatively correlated with the MSIS (r = -.27, p < .01) and MSIS dimensions (r = -.17 and -.32, p < .05 or .01). This was also evident when the MSIS and MSIS dimensions were correlated with the dimension of IAT (Table 4). These findings are consistent with the previous finding that the IAT is significantly and negatively correlated with social support (Korkeila, Kaarlas, Jaaskelainen, Vahlberg & Taiminen, 2010). Thus the Bangla version MSIS is a reliable and valid measure of social intimacy.
Like all other studies the present study has also its pros and cons. Firstly, the number of participants in this study was very small. Though the minimum sample required for factor analysis was satisfied here future studies on larger samples can increase the reliability coefficients, confirm the factor structure and other psychometric properties of the MSIS in Bangladeshi culture. A second shortcoming is the use of undergraduate/graduate students only. Such a sample of convenience facilitates the early phase of a test construction, but generalizing results to other populations such as adolescents, other young adults and older adults may not be warranted. So, future study should be designed to validate the MSIS for these populations.
5. Conclusions
This study equipped us with a valid psychometric tool to assess social intimacy among the educated young adults in Bangladesh. This measure would be helpful to the counselor, clinicians and other social workers who are dealing with those young people who have relationships problems, family problems, and other personal problems.
Acknowledgements
Authors would like to express their special thanks to all the Dhaka University students who participated in this study. They are grateful to those experts who judged the accuracy of translation and relevance/suitability of each item for measuring social intimacy in the socio-cultural context of Bangladesh. Authors are also happy to express their gratitude to the anonymous reviewers who made a number of constructive suggestions on a previous version of this paper.
REFERENCES
[1] Bowlby, J. 1982. Attachment and loss: Vol. 1. Attachment (2nd ed.). New York: Basic Books.
[2] Cattell, R. B., 1966. The scree test for number of factors. Multivariate Behavioral Research, 1 (2) 245–276.
[4] Downs, A. C., & Hillje, E. S., 1991. Reassessment of the Miller Social Intimacy Scale: use with mixed- and same-sex dyads produces multidimensional structures. Psychological reports, 69 (3), 991-997.
[5] Everitt, B.S., 1975. Multivariate analysis: the need for data, and other problems. British Journal of Psychiatry, 126, 237–240.
[6] Farah Ali, F., & Chamorro-Premuzic, T., 2010. The dark side of love and life satisfaction: Associations with intimate relationships, psychopathy and machiavellianism. Personality and Individual Differences, 48, 228–233.
[7] Floyd, F.J., Widaman, K.F., 1995. Factor analysis in the development and refinement of clinical assessment instruments. Psychological Assessment, 7, 286–299.
[8] Gorsuch, R.L., 1983. Factor Analysis, 2nd ed. Erlbaum, Hillsdale.
[9] Gratz, K.L., Roemer, L., 2004. Multidimensional assessment of emotion regulation and dysregulation: development, factor structure, and initial validation of the difficulties in emotion regulation scale. Journal of Psychopathology and Behavioral Assessment, 26 (1) 41–54.
[10] Guilford, J.P., 1956. Psychometric Methods. McGraw-Hill, New York.
[11] Hawi, N.S., 2013. Arabic validation of the Internet Addiction Test. Cyberpsychology, Behavior and Social Networking, 16 (3) 200–204.
[12] Jelenchick, L.A., Becker, T., Moreno, M.A., 2012. Assessing the psychometric properties of the Internet Addiction Test (IAT) in US college students. Psychiatry Research 196 (2-3) 296–301.
[13] Kaiser, H. F., 1970. A second generation little jiffy. Psychometrika, 35 (4) 401–415.
[14] Karim, R. A. K. M. & Nigar, N., 2014. The Internet Addiction Test: Assessing its psychometric properties in Bangladeshi culture. Asian Journal of Psychiatry, 10, 75-83.
[15] Kendall, M.G., Stuart, A., 1958. The Advanced Theory of Statistics. Hafner, New York.
[16] Kim, J. & Hatfield, E., 2004. Love types and subjective well-being: A cross-cultural study. Social Behavior and Personality, 32 (2), 173-182.
[17] Kline, P., 1979. Psychometrics and Psychology. Academic Press, London.
[18] Korkeila, J., Kaarlas, S., Jaaskelainen, M., Vahlberg, T.,
Taiminen, T., 2010. Attached to the web – harmful use of the Internet and its correlates. European Psychiatry 25, 236–241. [19] Kunce, J.T., Cook, D.W., Miller, D.E., 1975. Random
variables and correlational overkill. Educational and Psychological Measurement, 35 (3) 529–534.
[20] Marascuilo, L.A., Levin, J.R., 1983. Multivariate Statistics in the Social Sciences. Brooks/Cole, Monterey.
[21] Miller, R.S., Lefcourt, H.M., 1982. The assessment of social intimacy. Journal of Personality Assessment, 46(5) 514–518. [22] Muris, P., 2001. A brief questionnaire for measuring
self-efficacy in youths. Journal of Psychopathology and Behavioral Assessment, 23 (3) 145–149.
[23] Nunnally, J.C., 1978. Psychometric Theory, 2nd ed. McGraw-Hill, New York.
[24] Okada, M., Suzue, T., & Jitsunari, F., 2010. Association between interpersonal relationship among high-school students and mental health. Environmental Health and Preventive Mediine, 15(1), 57-62.
[25] Oxford Dictionaries, 2014. Definition of satisfaction in English. Oxford University Press: 2014.
(http://www.oxforddictionaries.com/definition/english/satisf action)
[26] Reis, H. T., & Shaver, P. R., 1988. Intimacy as an interpersonal process. Handbook of research in personal relationships. In S. Duck (Ed.), London: Wiley.
[27] Sternberg, R. J., 1986. A triangular theory of love. Psychological Review, 93, 119-135.
[28] Widyanto, L., McMurran, M., 2004. The psychometric properties of the Internet Addiction Test. Cyberpsychology and Behavior 7 (4) 443–450.
[29] Widyanto, L., Griffiths, M. D., Brunsden, V., 2011. A psychometric comparison of the Internet addiction test, the Internet-related problem scale, and self-diagnosis. Cyberpsychology, Behavior and Social Networking, 14 (3) 141–149.
[30] Young, K. S., 1996. Internet addiction: the emergence of a new clinical disorder. Cyberpsychology and Behaviour 1 (3) 237–244.