Changes in Lipid Profile of Wistar Rats after Sustained
Consumption of Different Types of Commercial
Vegetable Oil: A Preliminary Study
Karina de la Torre-Carbot
1,*, Jorge L. Chávez-Servín
1, Patricia Reyes
1, Roberto A. Ferriz
1,
Elsa Gutiérrez
2, Konigsmar Escobar
1, Araceli Aguilera
1, M. Aracely Anaya
1, Teresa García-Gasca
1,
Olga P. García
1, Jorge L. Rosado
11Facultad de Ciencias Naturales, Campus Juriquilla, Universidad Autónoma de Querétaro. Av. de las Ciencias S/N, Juriquilla, Querétaro,
Qro. CP 76320, México
2FES-Cuautitlán, Universidad Nacional Autónoma de México, Laboratorio de procesos de transformación y tecnologías emergentes en
alimentos. Km 2.5 Carretera Cuautitlán–Teoloyucan, San Sebastián Xhala, Cuautitlán Izcalli, Edo de México, CP.54714, México
Copyright © 2015 Horizon Research Publishing. All rights reserved.
Abstract
The amount of lipids in a diet and their source are determining factors of the lipid profile. The purpose of this study was to evaluate the addition of six types of different commercial vegetable oils (avocado, canola, high oleic safflower, soybean, grape seed and partially hydrogenated vegetable oil) to the diet of Wistar rats at two different concentrations (14.4% and 25.6% of energy intake from each added oil) and check rats’ tolerance and lipid profile effect following consumption for 5 weeks. Rats fed with soybean and avocado oils had significantly lower LDL (29.27 ±8.85 and 26.51±10.85 mg/dL, respectively) and total cholesterol values (48.10±11.41 and 45.83±5.78 mg/dL, respectively) vs. treatment with hydrogenated oil (p<0.05) (49.19±27.62 and 70.27±31.24 mg/dL, respectively). Rats’ consumption and growth was satisfactory with both concentrations of added oils. Partially hydrogenated oil had a hypercholesterolaemic effect on rats; in contrast, avocado oil and especially soybean oil offered the best results.Keywords
Lipid Profile, Commercial Edible Oils, CholesterolRunning title: Changes in lipid profile after sustained consumption of vegetable oils
1. Introduction
Cardiovascular diseases (CVDs) are the leading cause of death worldwide [1,2], with a multifactorial etiology involving a combination of risk factors [3,4] such as dietary habits and dyslipidemia [5-7], among others. A change of diet is the first strategy applied to prevent and treat CVDs. Lipid sources can change the heart’s health. Several studies have shown that the amount, type and composition of lipid
sources in the diet are determining factors of the serum lipid profile [7-9].
Eating foods rich in saturated fat (butter, whole milk, fried meals, cheeses, meat, etc.) is directly related with serum levels of total cholesterol and LDL [5]. Furthermore, the excessive consumption of foods high in cholesterol increases the risk of developing atherosclerosis and CVDs [10]. Trans fatty acids, produced during the partial hydrogenation process in oils, have been considered a risk factor for coronary heart disease and associated with increased LDL cholesterol, triglycerides and decreased HDL [11]. However, trans fatty acids are widely used in the food industry because of their the cost, palatability and stability [12,13]. Furthermore, rich polyunsaturated fatty acid oils (PUFAs) and monounsaturated fatty acid oils (MUFAs) are associated with the prevention of cardiovascular risk (CVR) [14,15]. Several studies have examined the effects of vegetable oils. Human studies have revealed that the consumption of soybean oil lowers LDL levels and increases HDL levels, compared with hydrogenated soybean oil and/or palm oil. This result suggests that the effect is due to soybean oil’s high content of PUFAs [16,17].
The importance of promoting the consumption of PUFAs is generally accepted, with safflower oil being recognized as an oil rich in these fatty acids, as well as other oils such as corn, soybean, canola and flaxseed [18]. However, the effect of the high oleic safflower oil in cardiovascular health has not been widely studied.
exploratory human studies show that eating avocado helps support cardiovascular health and promotes healthy blood lipid profiles. This suggests that a high content of MUFAs is an important factor for preventing the early development of atherosclerosis [19], lowering triglycerides and elevating HDL cholesterol. There is some research on the consumption of avocado, but few studies have analyzed the effect of its oil on cardiovascular health [20]. Similarly, very few studies focus on the effect of grape seed oil on cardiovascular health [21,22,22].
Although the relationship between vegetable oil consumption and lipid profile alterations has been studied in humans and other mammals, these studies evaluated simultaneously only a few types of oil and used a variety of methodologies, different amounts of lipids and different times of consumption. This circumstance complicates comparing results among the different types of oil studied. Thus, their effects on the lipid profile must be evaluated simultaneously and under the same conditions after sustained consumption, and the study must include different types of commercial oil, and oils that are not frequently consumed in some cultures, but that could have potential, such as grape seed and avocado oils. Wistar rats are very selective in the aromas and flavors of the food they consume and control the total energy intake of their diet [23-25]. And because a diet rich in fat that exceeds the nutritional recommendations of the rat is proposed as a model evaluation, the consumption and acceptance of food must be firstly evaluated when various concentrations of fat are added. The purpose of this study was to evaluate the addition of six types of commercial vegetable oil (avocado, canola, high oleic safflower, soybean, grape seed and partially hydrogenated vegetable oil) to the diet of Wistar rats at two different concentrations (14.4% and 25.6% of energy intake from each added oil) in their tolerance and lipid profile effect following consumption for 5 weeks.
2. Materials and Methods
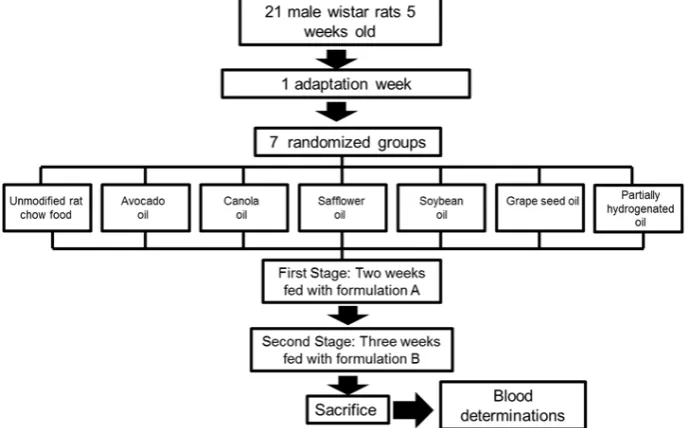
2.1. Experimental AnimalsWe used 21 male Wistar rats 5 weeks old with an average body weight of 110 ± 3g, which were kept in individual cages with food and water ad libitum in a controlled environment. The circadian cycle was adjusted to 12 hours of light and 12 hours of darkness.
2.2. Experimental Design and Diet
Rat Chow Lab Diet 5001 (PMI International LLC, Brentwood, MO, USA) was used to add one of the six different types of commercial oil: avocado oil (Ahuacatlán, Mexico), canola oil (Vita, Mexico), high oleic safflower oil (Oleic, Mexico), soybean oil (Nutrioli, Mexico), grape seed oil (Borges, Spain), and an edible, partially-hydrogenated and non-hydrogenated vegetable oil blend (Ultra Fray, Mexico). Food composition oil labels are presented in Table 1. Unmodified food was used as control (negative control). The rats were subject to 1 week of adaptation during which they were fed with Rat Chow Lab Diet and water ad libitum. After this week, the study comprised two stages. In the first stage animals were randomized and assigned to one of seven groups (n = 3), each consuming one type of commercial vegetable oil. They were fed with Rat Chow Lab Diet to which 5.7g/100g of oil were added to obtain food with 14.4% energy intake from each oil during 2 weeks (formulation A). In the second stage, animals were fed with Rat Chow Lab Diet to which 11g/100g of oil were added to obtain food with 25.6% energy intake derived from each added oil during 3 weeks (formulation B). The experimental design is represented in Figure 1. Each group could eat ad libitum. Table 2 shows the composition of food during adaptation, and first and second stages. During the study, the consumption of the experimental diet was recorded daily
Table 1. Nutritional composition per 100 mL according to the label of the oils used in the study
Component Avocado oil Canola oil High oleic safflower oil Soy oil Grapeseed oil Partially hydrogenated oil
Calories (Kcal) 900 900 828 818 900 840
Total Fat (g) 92 100 92 90 100 94
SFA (g) 14 8 6 14 10 ND
MUFA (g) 64 62 70 22 18 ND
PUFA (g) 14 32 14 56 72 ND
TFA (g) ND 0.0 ND 0.0 ND ND
Oleic acid (g) ND 60 ND ND ND ND
n-3 (g) ND 12 ND 6 ND ND
n-6 (g) ND 22 ND 48 ND ND
SFA, saturated fatty acids; MUFA, mono-unsaturated fatty acid; PUFA, poly-unsaturated fatty acid; TFA, trans fatty acids; ND, Not determined
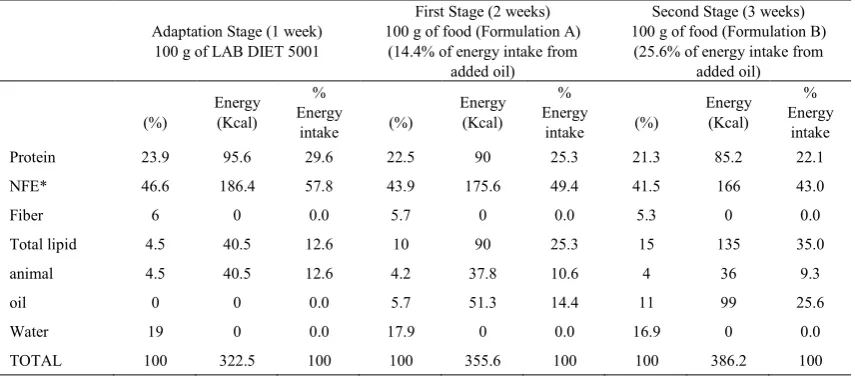
Table 2. Composition of food materials and preparation to 14.4% and 25.6% of energy intake from added oil.
Adaptation Stage (1 week) 100 g of LAB DIET 5001
First Stage (2 weeks) 100 g of food (Formulation A)
(14.4% of energy intake from added oil)
Second Stage (3 weeks) 100 g of food (Formulation B)
(25.6% of energy intake from added oil)
(%) Energy (Kcal) % Energy
intake (%)
Energy (Kcal)
% Energy
intake (%)
Energy (Kcal)
% Energy
intake
Protein 23.9 95.6 29.6 22.5 90 25.3 21.3 85.2 22.1
NFE* 46.6 186.4 57.8 43.9 175.6 49.4 41.5 166 43.0
Fiber 6 0 0.0 5.7 0 0.0 5.3 0 0.0
Total lipid 4.5 40.5 12.6 10 90 25.3 15 135 35.0
animal 4.5 40.5 12.6 4.2 37.8 10.6 4 36 9.3
oil 0 0 0.0 5.7 51.3 14.4 11 99 25.6
Water 19 0 0.0 17.9 0 0.0 16.9 0 0.0
TOTAL 100 322.5 100 100 355.6 100 100 386.2 100
*FE =Nitrogen-free elements
The weight of the rats was recorded weekly, using a rodent balance PCE series BDM (Triple Beam Balance, OHAUS, Florham Park, N.J. USA). Food consumption was measured by difference, counting the initial weight of food, minus the final weight plus waste food uneaten, using a Premier digital balance (OKEN, D.F. Mexico). At the end of treatment, rats were subject to 12 hours of fasting and subsequently to gross necropsy by decapitation. Blood was collected in test tubes. Serum was obtained by blood centrifugation at 3000rpm for 7 minutes. The serum samples were stored in a deep freezer (-80°C) for further analysis. The weight of the liver was recorded for each of the rats.
2.3. Oils Analysis
All oils used as raw material for the preparation of food were analyzed. Peroxide values (OMA-AOAC 18e 965.33) expressed as mEq O2/kg oil, the acid index (NMX-F-101-1987) expressed as % oleic acid and the fatty acids profile (NMX-F-017-SCFI-2005) were determined following official methods in accordance with the official methods of analysis [26-29]
2.4. Blood Determinations
Lipid determinations were performed in duplicate following colorimetric enzymatic methods using reagent kits Elitech (Seppim, Sées, France) for triglycerides (mg / dL), total cholesterol (mg / dL) and HDL cholesterol (mg / dL) using Clinical Chemistry Analyser Bayer RA-50 (Bayer Diagnostics Mtg. Ltd. Swords, Co. Dublin, Ireland) and Genesis 20 spectrophotometer (ThermoSpectronic, Thermo Electron Corp, Wisconsin, USA). LDL cholesterol levels were calculated using the Friedewald equation (Oliveira MJ et al., 2013): LDL cholesterol = total cholesterol - (HDL cholesterol + triglycerides / 5).
2.5. Ethical Considerations
[image:3.595.92.520.288.476.2]experiments [31]. The study was approved by the ethics committee of the School of Natural Sciences of the UAQ.
2.6. Statistical Analysis
We used descriptive statistics (mean and standard deviation) to present the results of the studied variables. The differences between the studied variables were established comparing the consumption of the different types of oils using the Univariate linear model. For the lipid analysis, we performed an adjustment to total feed consumption using SPSS for Windows (v18). The level of statistical significance was set at (p< 0.05) for all the analyses within a confidence interval of 95%.
3. Results
3.1. Oil Determinations
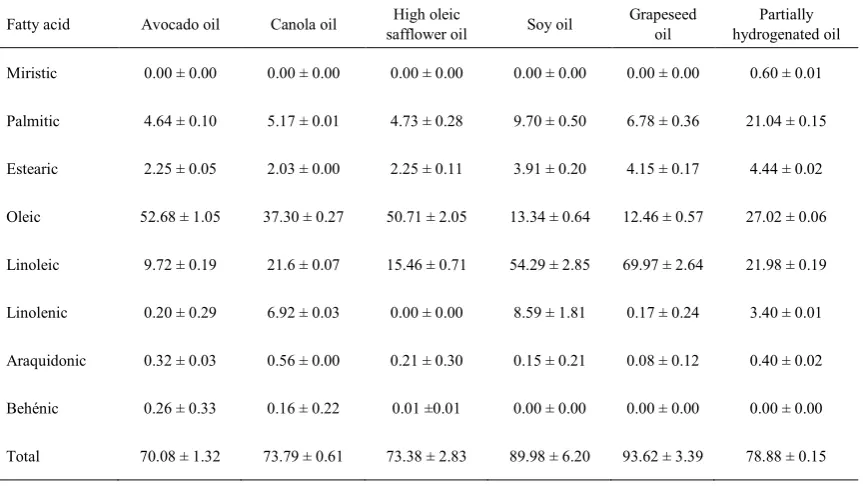
The results on fatty acids contained in each oil are shown in Table 3. Oils present lower acid values (<0.06 mg KOH / g oil) and index values (peroxide < 10.0 mEq /kg) that meet the CODEX standard for vegetable oils [32].
3.2 Consumption
During the first stage (2 weeks), each of the study groups was fed with rat feed supplemented with 5.7g/100g of oil.
Once we corroborated the acceptance of food, we proceeded to the second phase (three weeks), during which rats were offered food supplemented with 11g/100g of added oil. Table 4 shows each experimental group’s food intake. Regarding the daily food intake during stage 1, we note that despite no significant differences when comparing different treatments (types of oil), there was a tendency to consume more of the original food (control negative), in an average of 19.6 ± 4 g / day. We also noted a lower consumption of food with added grape seed oil (15.0 ± 1.6 g / day), a trend that continued in stage 2, during which more grape oil was added to food (25.6% of energy intake from added oil). In the second phase, we also observed significant differences: lower food intake with added avocado and grape seed oils vs. food without added oil (negative control) and partially hydrogenated oil.
3.3. Growth and Weight Gain in Rats
[image:4.595.91.523.433.676.2]At baseline, the average weight of rats was 111 ± 9g, with no differences between experimental groups. Regarding the weight gain at the end of the study, we observed that the highest weight gain (288 ± 29g) was in the group of rats that consumed food with added partially hydrogenated oil, while the lower weight gain was observed in the group consuming avocado oil (217 ± 24g) (Table 5).
Table 3. Concentration of fatty acids per mg/100mL of oils used in the study
Fatty acid Avocado oil Canola oil safflower oil High oleic Soy oil Grapeseed oil hydrogenated oil Partially
Miristic 0.00 ± 0.00 0.00 ± 0.00 0.00 ± 0.00 0.00 ± 0.00 0.00 ± 0.00 0.60 ± 0.01
Palmitic 4.64 ± 0.10 5.17 ± 0.01 4.73 ± 0.28 9.70 ± 0.50 6.78 ± 0.36 21.04 ± 0.15
Estearic 2.25 ± 0.05 2.03 ± 0.00 2.25 ± 0.11 3.91 ± 0.20 4.15 ± 0.17 4.44 ± 0.02
Oleic 52.68 ± 1.05 37.30 ± 0.27 50.71 ± 2.05 13.34 ± 0.64 12.46 ± 0.57 27.02 ± 0.06
Linoleic 9.72 ± 0.19 21.6 ± 0.07 15.46 ± 0.71 54.29 ± 2.85 69.97 ± 2.64 21.98 ± 0.19
Linolenic 0.20 ± 0.29 6.92 ± 0.03 0.00 ± 0.00 8.59 ± 1.81 0.17 ± 0.24 3.40 ± 0.01
Araquidonic 0.32 ± 0.03 0.56 ± 0.00 0.21 ± 0.30 0.15 ± 0.21 0.08 ± 0.12 0.40 ± 0.02
Behénic 0.26 ± 0.33 0.16 ± 0.22 0.01 ±0.01 0.00 ± 0.00 0.00 ± 0.00 0.00 ± 0.00
Table 4. Daily food consumption, weekly caloric intake and weekly consumption / rat weight*
First Stage (14% of energy intake from added oil) Second Stage (25.6% of energy intake from added oil)
Group consumption Daily (g/day)
Weekly caloric intake (kcal)
Weekly consumption/ra
t weight (g/g)
Daily consumption
(g/day)
Weekly caloric intake (kcal)
Weekly consumption/ra
t weight (g/g) 1 No added oil
(negative
control) 19.6 ± 4.1 448.8 ± 89.4 0.57 ± 0.02 28.1 ± 2.8 597.6 ± 63.3 0.54 ± 0.09
2 Avocado oil 15.7 ± 1.2 393.4 ± 29.9 0.46 ± 0.04a 20.5 ± 0.5a,b 517.9 ± 23.5a,b 0.40 ± 0.00a
3 Canola oil 15.9 ± 2.3 396.2 ± 57.6 0.48 ± 0.02a 23.1 ± 2.5a 590.0 ± 23.5 0.38 ± 0.08a
4 Safflower oil 16.3 ± 2.6 407.0 ± 61.6 0.47 ± 0.02a 22.8 ± 3.3 589.2 ± 89.9 0.46 ± 0.10
5 Soy oil 15.9 ± 2.2 399.0 ± 51.0 0.46 ± 0.01a 22.2 ± 2.5 b 566.7 ± 60.2 0.41 ± 0.06a
6 Grapeseed oil 15.0 ± 1.6 374.4 ± 37.6 0.47 ± 0.03a 20.0 ± 1.6a,b 504.9 ± 40.5a,b 0.34 ± 0.03a
7 Partially
hydrogenated oil 17.6 ± 2.5 438.2 ± 58.3 0.51 ± 0.06 26.8 ± 3.1 684.6 ± 79.1 0.45 ± 0.06
Mean 16.6 ± 2.5 414.7 ± 56.3 0.49 ± 0.5 23.4 ± 3.5 619.3 ± 64.0 0.43 ± 0.09
*The results are presented as the mean ± 1 SD determinations for each group (n = 3). a Significant difference (p <0.05) vs. the negative control (no added oil).
b Significant difference (p <0.05) vs. partially hydrogenated oil.
Table 5. Initial and final body and liver weight
Group Initial body weight (g) Final body weight (g) Net weight gain (g) Liver weight (g) 1 No added oil
(negative control) 113.1 ± 11.6 341.4 ± 31.2 228.3 ± 33.3b 9.9 ± 1.5
2 Avocado oil 114.4 ± 8.6 331.7 ± 17.9 217.4 ± 24.3b 9.7 ± 1.0
3 Canola oil 113.5 ± 6.5 399.1 ± 49.0 285.6 ± 45.7a 11.2 ± 2.4
4 Safflower oil 107.8 ± 7.9 328.7 ± 26.3 220.8 ± 31.2b 10.4 ± 1.8
5 Soy oil 113.3 ± 6.5 352.5 ± 24.5 239.2 ± 29.2 11.3 ± 2.1
6 Grapeseed oil 109.1 ± 15.9 379.1 ± 29.2 230.0 ± 14.3 9.01 ± 0.8b
7 Partially hydrogenated oil
(positive control) 105.6 ± 10.3 393.1 ± 20.3 287.5 ± 29.0a 12.3 ± 1.0
Mean 110.96 ± 9.1 360.8 ± 37.4 249.8 ± 38.8 10.5 ± 1.7
* The results are presented as the mean ± 1 SD determinations for each group (n = 3).
a Significant difference (p <0.05) vs. the negative control (no added oil).
b Significant difference (p <0.05) vs. the positive control (partially hydrogenated oil).
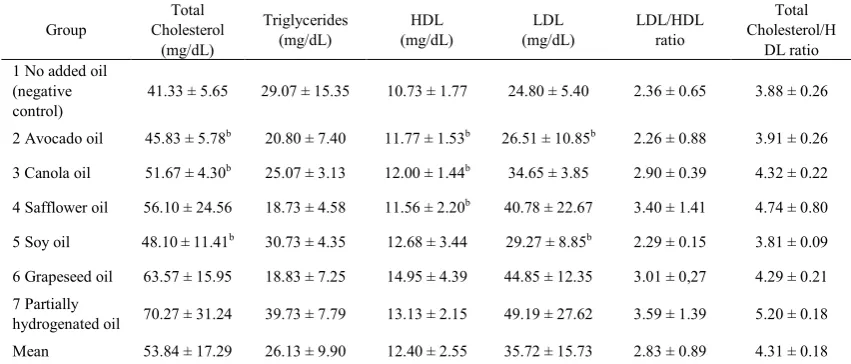
Table 6. Lipid profile after treatment
Group Cholesterol Total (mg/dL)
Triglycerides
(mg/dL) (mg/dL) HDL (mg/dL) LDL LDL/HDL ratio
Total Cholesterol/H
DL ratio 1 No added oil
(negative
control) 41.33 ± 5.65 29.07 ± 15.35 10.73 ± 1.77 24.80 ± 5.40 2.36 ± 0.65 3.88 ± 0.26
2 Avocado oil 45.83 ± 5.78b 20.80 ± 7.40 11.77 ± 1.53b 26.51 ± 10.85b 2.26 ± 0.88 3.91 ± 0.26
3 Canola oil 51.67 ± 4.30b 25.07 ± 3.13 12.00 ± 1.44b 34.65 ± 3.85 2.90 ± 0.39 4.32 ± 0.22
4 Safflower oil 56.10 ± 24.56 18.73 ± 4.58 11.56 ± 2.20b 40.78 ± 22.67 3.40 ± 1.41 4.74 ± 0.80
5 Soy oil 48.10 ± 11.41b 30.73 ± 4.35 12.68 ± 3.44 29.27 ± 8.85b 2.29 ± 0.15 3.81 ± 0.09
6 Grapeseed oil 63.57 ± 15.95 18.83 ± 7.25 14.95 ± 4.39 44.85 ± 12.35 3.01 ± 0,27 4.29 ± 0.21
7 Partially
hydrogenated oil 70.27 ± 31.24 39.73 ± 7.79 13.13 ± 2.15 49.19 ± 27.62 3.59 ± 1.39 5.20 ± 0.18
Mean 53.84 ± 17.29 26.13 ± 9.90 12.40 ± 2.55 35.72 ± 15.73 2.83 ± 0.89 4.31 ± 0.18
* The results are presented as the mean ± 1 SD determinations for each group (n = 3). Analysis adjusted by total feed consumption.
a Significant difference (p ≤0.05) vs. the negative control (no added oil).
[image:5.595.93.518.88.263.2] [image:5.595.96.519.318.484.2] [image:5.595.91.517.538.720.2]3.4. Liver Growth
Liver weight at the end of the study was higher in rats eating partially hydrogenated oil (12 ± 1g) and lower (9 ± 1g) in rats consuming grape seed oil, although this did not represent a significant difference (Table 5).
3.5. Lipid Profile 3.5.1. Total Cholesterol
The mean cholesterol in 21 rats was 53.8 ± 17.3mg / dL. The maximum value occurred in the group with food containing partially hydrogenated oil (70.3 ± 31.2mg / dL), while the minimum value was observed in the group without added oil (negative control) (41.3 ± 5.7mg / dL). Significant differences were observed in the groups consuming avocado, canola and soybean oil vs. the partially hydrogenated oil. Table 6 shows the results of the lipid profile analysis).
3.5.2. Triglycerides
The average triglyceride in all rats was 26.1 ± 9.9mg / dL. The maximum value was observed in the group consuming partially hydrogenated oil (39.7 ± 7.8mg / dL), whereas the minimum value was observed in the group consuming high oleic safflower (18.7 ± 4.6mg / dL). No significant differences were observed among groups.
3.5.3. HDL
The HDL average in all groups was 12.4 ± 2.6mg/dL. Maximum concentrations occurred in the group fed with grape seed oil (15 ± 4.4mg / dL) and the lowest in the negative control group (10.7 ± 1.8mg / dL). There was a significant difference (p < 0.05) in the groups fed with avocado (11.77 ± 1.53), canola (12.00 ± 1.44) and safflower (11.56 ± 2.20) oils compared to partially hydrogenated oil (13.13 ± 2.15).
3.5.4. LDL
Average LDL was 35.7 ± 15.7mg / dL. The maximum value was seen in the group fed with partially hydrogenated oil (49.2 ± 27.6mg / dL), whereas the minimum value occurred in the group without added oil (negative control, 24.8 ± 5.4mg / dL). Significant differences (p < 0.05) were found in the groups consuming avocado (26.51 ± 10.85mg / dL) and soy (29.27 ± 8.85 mg/dL) oils compared to partially hydrogenated oil (49.19 ± 27.62 mg/dL).
3.5.5. LDL/HDL ratio
The average value of the LDL / HDL ratio was 2.8 ± 0.9mg / dL, with the highest value seen in the group fed with partially hydrogenated oil (3.6 ± 1.4mg / dL). The lower value was obtained from the group fed with avocado oil (2.26 ± 0.9mg / dL). There were no significant differences (p < 0.05) among groups.
3.5.6. Total cholesterol/HDL cholesterol ratio.
The average value of the total cholesterol / HDL ratio was 4.31 ± 0.18mg/dL. Like the LDL/HDL index, the group that had the highest ratio was fed with partially hydrogenated oil (5.2 ± 0.18mg / dL). The lower value was obtained from the group fed with soybean oil (3.81 ± 0.09mg / dL). Although no significant differences (p < 0.05) among groups were observed, a value of p = 0.056 when comparing the values resulting from the treatment of soybean oil versus the values obtained by the group treated with partially hydrogenated oil was observed.
4. Discussion
The explanation to the observed tendency to consume more of the original food may be that rats regulate their food intake based on the amount of energy (Kcal) consumed [24,25]. A lower consumption of food with the added grape seed and avocado oils may be due to their taste. Despite the differences observed in rats subject to different treatments, consumption and growth in the groups studied was satisfactory.
Normal values of the lipid profile in rats are usually lower than in humans. The lipid profile in our study was within the range of values reported in adult Wistar rats in other results [33]. Among oil treatments, the lowest concentration of total cholesterol was observed in the rats fed with added avocado oil. This group, as well as the canola and soybean oil groups, showed a significant difference compared to the group fed with partially hydrogenated oil. The reduction effect of these vegetable oils may be due to the presence of different bioactive components such as MUFAs, PUFAs and other minor components, such as sterols and vitamin E [34]. Although the cardioprotective effect of diets high in MUFAs is controversial when compared with diets high in PUFAs [35,36], it is generally accepted that the substitution of saturated fatty acids and trans fatty acids with MUFAs and/or PUFAs is beneficial for cardiovascular health [37-39]. According to our results, rich sources of MUFAs have a hypocholesterolemic effect when compared with the effect after consuming partially hydrogenated oil, which is consistent with other studies [40]. On the other hand, in the case of soybean oil, this reduction may be due to the high content of fatty acids of the n-6 and n-3 series, since these fatty acids can change cholesterol distribution in plasma and tissues [18]. The n-3:n-6 relationship and the content of n-3 fatty acids in canola and soybean oils may have a significant effect on cholesterol levels. The protective effect of these vegetable oils, especially canola oil, may be due to the presence of phytosterols as canola oil is rich in these compounds. Phytosterols reduce cholesterol absorption in the intestine, inhibiting hepatic production and increasing the number of LDL receptors in the liver, which in turn increases the uptake of cholesterol to bile acid synthesis [41].
with other studies: lower values of triglycerides are obtained from high lipid diets with no partially-hydrogenated vegetable sources [18,42].
High concentrations of HDL confer a cardioprotective effect. We note that all groups that received added oil showed higher concentrations of HDL cholesterol compared to the control group. The mechanism that triggers this effect may be different depending on the characteristics of each oil. Based on our results, however, we can say that the addition of vegetable oils to the diet improved HDL values. These results are consistent with other studies showing that diets low in fat and high in carbohydrates succeed in lowering LDL values; however, these diets also lower the levels of HDL [43]. The fact that partially hydrogenated oil generates significantly higher HDL values compared with high MUFA oils is strange. Admittedly, partially-hydrogenated oil increases LDL cholesterol and decreases HDL cholesterol [16,17,40], and probably, the cause for this was that the oil used partially contains unhydrogenated oil. However, the HDL/LDL index to analyze the possible effects of the different treatments must be taken into account, instead of analyzing isolated parameters.
One of the most important risk markers for CVDs is the concentration of LDL. Although the smallest values of LDL were found in the control group, and a notable difference can be appreciated versus the LDL values of partially hydrogenated oil, the difference was not significant, probably due to the sample size. The significant differences found in this study are consistent with other studies suggesting that the consumption of trans fatty acid sources raises LDL levels vs. the consumption of MUFA or PUFA rich oils [8,17,44]. This may be because the content of trans fatty acids in partially hydrogenated oils alters various metabolic processes such as the cell membrane fluidity, causing a difficult coupling of the LDL receptor with its ligand [45]. Epidemiological studies show that n-6 PUFA, particularly a linoleic acid dietary intake, significantly lowers blood LDL-cholesterol levels [46]. Linoleic acid acts as a ligand of PPAR transcription factors and inhibits transcription of certain gene-encoding enzymes involved in the synthesis of hepatic lipogenesis, and instead stimulates the synthesis of enzymes involved in β-oxidation [47]. Hence, soybean oil, rich in linoleic fatty acid, can exert a hypocholesterolemic effect. We note also the argument that excessive consumption of n-6 PUFA may lead to adverse effects on health and therefore recommend setting an upper limit and achieving a balance between fatty acids of n-6 and n-3 consumed [46,48]. In this sense, soybean oil has an advantage over other oils, since it is a relatively good source of linoleic acid. The omega-3 fatty acids are believed to have hypocholestorolaemiant properties as they have been associated to a reduction in the synthesis of fatty acids in the liver and decreased synthesis of apo B and apo A in the liver and intestine. It has been demonstrated that the consumption of linoleic acid stimulates reverse cholesterol transport and increases the clearance of cholesterol in bile [46].
The LDL/HDL cholesterol ratio is an important
component and indicator of vascular risk, the predictive value of which is greater than the isolated parameters. The total cholesterol/HDL cholesterol ratio, known as the atherogenic or Castelli index, is another key indicator of vascular risk, and it is considered a more sensitive and specific index of CVR than total cholesterol. The value of this parameter should be emphasized when the lipid profile is within a desirable range or when there is no reliable calculation of LDL. Individuals with a high LDL/HDL cholesterol and total cholesterol/HDL ratios have greater CVR due to the imbalance between the cholesterol carried by atherogenic and protective lipoproteins [49]. Although no significant differences among groups were found, maybe due to the sample size, the group that presented the highest values for both ratios was the one treated with partially hydrogenated oil. These results are consistent with Hunter [50], who describes that the use of partially hydrogenated oil raises the HDL/LDL ratio, compared with the values generated by an adequate intake of plant sources of MUFAs and PUFAs. The results of these two indexes together indicate a tendency to impair the balance between existing serum cholesterol and lipoproteins that carry cholesterol to the liver for use or disposal by partially hydrogenated oils.
Based on count valuation, soybean oil is more positively assessed because no parameter significantly worsened and it did not show a negative trend in the parameters studied vs. the results of the other treatments, including the negative control. Instead, the group fed with soybean oil had significantly lower values of LDL and total cholesterol vs. the values of the group treated with partially hydrogenated oil. It also presented the lowest value of total cholesterol/HDL ratio, a parameter that, as we mentioned above, is an important and more sensitive and specific index of CVR, and was nearly significantly lower (p = 0.056) when compared to the group treated with partially hydrogenated oil. Avocado oil was also evaluated in this study as beneficial because it had the best LDL/HDL index values despite significantly lower values of HDL against the values obtained with the treatment with partially hydrogenated oil, and also showed values significantly lower of LDL and total cholesterol vs. the treatment with partially hydrogenated oil. The grape seed oil and oil-free treatments (negative control) improved a few parameters and had a slightly positive effect on the parameters studied. On the other hand, we can assign a "neutral" rating to canola and high oleic safflower oils based on the effects produced. Treatment with partially hydrogenated oil, despite presenting significantly higher values of HDL vs. three other oils (avocado, canola and safflower), showed the worst trend in other parameters, including both indices studied, with high values of total cholesterol / HDL and LDL / HDL, and the highest values of LDL and triglycerides.
5. Conclusions
impact on the lipid profile. Partially hydrogenated oil has a hypercholesterolemic effect. The increase in HDL levels is not a real advantage, since this treatment shows the worst tendency on LDL/HDL and total cholesterol/HDL indices, which can be associated with an increased CVR. Since this work is a pilot study, it is difficult to find significant differences in all the variables. However, we can see a clear trend where avocado, and especially soybean oil, could be awarded a better assessment in this study. More research is needed with a larger number of rats per group using the same model of oil consumption.
Acknowledgements
We want to thank the Ministry of Public Education (SEP) for the financial support provided through its Improvement Teachers Program PROMEP (Financial support No. 103.5/08/3320). We would like to acknowledge Verónica Andrade, F. Josué López, Álvaro Orozco. Ma. del Carmen Caamaño, Dr. Hebert L. Hernandez, Dr. Rosalía Reynoso and Mariela Camacho for their technical support.
REFERENCES
[1] WHO, Cardiovascular diseases (CVDs), World Health Organization, Media Centre, Fact sheet N°317 (2013). [2] V. Guarner and M. E. Rubio-Ruiz, Low-grade systemic
inflammation connects aging, metabolic syndrome and cardiovascular disease, Interdiscip. Top. Gerontol., 40 (2015) 99-106.
[3] I. Balaguer Vintró, Control y prevención de las enfermedades cardiovasculares en el mundo, Revista Española de Cardiología, 57 (2004) 487-494.
[4] U. Riserus, Cardiovascular disease, World Rev. Nutr Diet., 111 (2015) 94-99.
[5] G. Grunberger, Do we need a fasting lipid profile to assess cardiovascular risk?, Journal of Diabetes, 3 (2011) 172-173. [6] NIH, Detection, Evaluation, and Treatment of High Blood
Cholesterol in Adults, National Cholesterol Education Program, 2 (2002).
[7] A. L. Peterson and P. E. McBride, A review of guidelines for dyslipidemia in children and adolescents, WMJ., 111 (2012) 274-281.
[8] S. J. Baum, P. M. Kris-Etherton, W. C. Willett, A. H. Lichtenstein, L. L. Rudel, K. C. Maki, J. Whelan, C. E. Ramsden, and R. C. Block, Fatty acids in cardiovascular health and disease: A comprehensive update, Journal of Clinical Lipidology, 6 (2012) 216-234.
[9] R. Uauy, Dietary fat quality for optimal health and well-being: overview of recommendations, Ann. Nutr. Metab, 54 Suppl 1 (2009) 2-7.
[10] W. E. Connor, The decisive influence of diet on the progression and reversibility of coronary heart disease, Am.
J. Clin. Nutr., 64 (1996) 253-254.
[11] C. A. Idris and K. Sundram, Effect of dietary cholesterol, trans and saturated fatty acids on serum lipoproteins in non-human primates, Asia Pac. J. Clin. Nutr., 11 Suppl 7 (2002) S408-S415.
[12] F. S. Dias, M. E. Passos, C. M. do, M. L. Lopes, and M. Valente, V, Fatty acid profile of biscuits and salty snacks consumed by Brazilian college students, Food Chem., 171 (2015) 351-355.
[13] R. P. Mensink, P. L. Zock, A. D. Kester, and M. B. Katan, Effects of dietary fatty acids and carbohydrates on the ratio of serum total to HDL cholesterol and on serum lipids and apolipoproteins: a meta-analysis of 60 controlled trials, Am. J. Clin. Nutr., 77 (2003) 1146-1155.
[14] P. M. Kris-Etherton, K. D. Hecker, A. Bonanome, S. M. Coval, A. E. Binkoski, K. F. Hilpert, A. E. Griel, and T. D. Etherton, Bioactive compounds in foods: their role in the prevention of cardiovascular disease and cancer, Am. J. Med., 113 Suppl 9B (2002) 71S-88S.
[15] S. Rabar, M. Harker, N. O'Flynn, and A. S. Wierzbicki, Lipid modification and cardiovascular risk assessment for the primary and secondary prevention of cardiovascular disease: summary of updated NICE guidance, BMJ, 349 (2014) g4356.
[16] A. H. Lichtenstein, N. R. Matthan, S. M. Jalbert, N. A. Resteghini, E. J. Schaefer, and L. M. Ausman, Novel soybean oils with different fatty acid profiles alter cardiovascular disease risk factors in moderately hyperlipidemic subjects, Am. J. Clin. Nutr., 84 (2006) 497-504.
[17] S. Vega-López, L. M. Ausman, S. M. Jalbert, A. T. Erkkila, and A. H. Lichtenstein, Palm and partially hydrogenated soybean oils adversely alter lipoprotein profiles compared with soybean and canola oils in moderately hyperlipidemic subjects, Am. J. Clin. Nutr, 84 (2006) 54-62.
[18] M. Rodriguez-Cruz, A. R. Tovar, P. M. Del, and N. Torres, Molecular mechanisms of action and health benefits of polyunsaturated fatty acids, Rev Invest Clin., 57 (2005) 457-472.
[19] M. L. Dreher and A. J. Davenport, Hass avocado composition and potential health effects, Crit Rev. Food Sci. Nutr, 53 (2013) 738-750.
[20] D. Kritchevsky, S. A. Tepper, S. Wright, S. K. Czarnecki, T. A. Wilson, and R. J. Nicolosi, Cholesterol vehicle in experimental atherosclerosis 24: avocado oil, J. Am. Coll. Nutr., 22 (2003) 52-55.
[21] F. Asadi, A. Shahriari, and M. Chahardah-Cheric, Effect of long-term optional ingestion of canola oil, grape seed oil, corn oil and yogurt butter on serum, muscle and liver cholesterol status in rats, Food Chem. Toxicol., 48 (2010) 2454-2457.
[22] Krawczynska A, Olczak Elzbieta, Rembiszewska A, and J. A. Gustafson, High-fat, cholesterol-rich diet affects leptin expression in the aortic layers., Experimental Biology and Medicine, 238 (2013) 47-56.
development, Neurotoxicology and Teratology, 41 (2014) 16-26.
[24] A. Diane, M. Victoriano, G. Fromentin, D. Tome, and C. Larue-Achagiotis, Acute stress modifies food choice in Wistar male and female rats, Appetite, 50 (2008) 397-407. [25] C. Jean, G. Fromentin, D. Tomé, and C. Larue-Achagiotis,
Wistar rats allowed to self-select macronutrients from weaning to maturity choose a high-protein, high-lipid diet, Physiology & Behavior, 76 (2002) 65-73.
[26] OMA. Peroxide Value in Foods/Oils and Fats approved by AOCS-AOAC. OMA . 1-1-2010.
[27] NMX-F-101-1987. Alimentos. Aceites y grasas vegetales o animales. Determinación del índice de acidez. Colegio de Psgraduados en Ciencias Agrícolas . 2010.
[28] NMX-F-154-SCFI-2010. Alimentos – aceites y grasas vegetales o animales - Determinación del valor de peróxido – método de prueba (cancela la nmx-f-154-scfi-2005). Secretaría de Economía . 2010.
[29] NMX-F-017-SCFI-2005. Alimentos. Aceites y grasas vegetales o animales. Determinación de la composición de ácidos grasos por cromatografía de gases. Método de Prueba. Declaratoria de vigencia publicada en el Diario Oficial de la Federación . 11-4-2010.
[30] NOM-062-ZOO-1999, Especificaciones técnicas para la producción, cuidado y uso de los animales de laboratorio. 1999.
[31] European Commission. EU Directive 2010/63/EU for animal experiments.
http://ec.europa.eu/environment/chemicals/lab_animals/legis lation_en.htm . 2010. 12-12-2014.
[32] Codex stan 210-1999. Codex standard for named vegetable oils. Codex Alimentarius . 2009. 21-12-2010.
[33] K. K. Rocha, G. A. Souza, G. X. Ebaid, F. R. Seiva, A. C. Cataneo, and E. L. Novelli, Resveratrol toxicity: effects on risk factors for atherosclerosis and hepatic oxidative stress in standard and high-fat diets, Food Chem. Toxicol., 47 (2009) 1362-1367.
[34] M. Barbosa Aguila, C. Cota Loureiro, da Rocha Pinheiro A, and C. Mandarim-de-Lacerda, Lipid metabolism in rats fed diets containing different types of lipids, Arq Bras Cardiol, 78 (2002) 32-38.
[35] C. Degirolamo and L. L. Rudel, Dietary monounsaturated fatty acids appear not to provide cardioprotection, Curr. Atheroscler. Rep., 12 (2010) 391-396.
[36] L. Schwingshackl, B. Strasser, and G. Hoffmann, Effects of monounsaturated fatty acids on cardiovascular risk factors: a systematic review and meta-analysis, Ann. Nutr Metab, 59 (2011) 176-186.
[37] L. G. Gillingham, J. A. Gustafson, S. Y. Han, D. S. Jassal, and P. J. Jones, High-oleic rapeseed (canola) and flaxseed
oils modulate serum lipids and inflammatory biomarkers in hypercholesterolaemic subjects, Br. J Nutr, 105 (2011) 417-427.
[38] I. Marai and S. Massalha, Effect of omega-3 polyunsaturated fatty acids and vitamin D on cardiovascular diseases, Isr. Med. Assoc. J, 16 (2014) 117-121.
[39] M. Weech, K. Vafeiadou, M. Hasaj, S. Todd, P. Yaqoob, K. G. Jackson, and J. A. Lovegrove, Development of a food-exchange model to replace saturated fat with MUFAs and n-6 PUFAs in adults at moderate cardiovascular risk, J Nutr, 144 (2014) 846-855.
[40] D. Mozaffarian and R. Clarke, Quantitative effects on cardiovascular risk factors and coronary heart disease risk of replacing partially hydrogenated vegetable oils with other fats and oils, Eur. J. Clin. Nutr., 63 Suppl 2 (2009) S22-S33. [41] K. Fassbender, D. Lutjohann, M. G. Dik, M. Bremmer, J.
Konig, S. Walter, Y. Liu, M. Letiembre, B. K. von, and C. Jonker, Moderately elevated plant sterol levels are associated with reduced cardiovascular risk--the LASA study, Atherosclerosis, 196 (2008) 283-288.
[42] H. E. Bays, A. P. Tighe, R. Sadovsky, and M. H. Davidson, Prescription omega-3 fatty acids and their lipid effects: physiologic mechanisms of action and clinical implications, Expert. Rev. Cardiovasc. Ther., 6 (2008) 391-409.
[43] R. L. Rosenthal, Effectiveness of altering serum cholesterol levels without drugs, Baylor University Medical Center Proceedings, 13 (2000) 351-355.
[44] P. Kris-Etherton, Trans-fats and coronary heart disease, Critical Reviews in Food Science and Nutrition, 50 (2010) 29-30.
[45] F. Manzur, C. Alvear, and A. Alayón, Consumo de ácidos grasos trans y riesgo cardiovascular, Revista Colombiana de Cardiología, 16 (2009) 103-111.
[46] S. Czernichow, D. Thomas, and E. Bruckert, n-6 Fatty acids and cardiovascular health: a review of the evidence for dietary intake recommendations, Br. J. Nutr., 104 (2010) 788-796.
[47] K. Nagao and T. Yanagita, Bioactive lipids in metabolic syndrome, Prog. Lipid Res., 47 (2008) 127-146.
[48] G. L. Russo, Dietary n-6 and n-3 polyunsaturated fatty acids: from biochemistry to clinical implications in cardiovascular prevention, Biochem. Pharmacol., 77 (2009) 937-946. [49] J. Millan, X. Pinto, A. Munoz, M. Zuniga, J. Rubies-Prat, L.
F. Pallardo, L. Masana, A. Mangas, A. Hernandez-Mijares, P. Gonzalez-Santos, J. F. Ascaso, and J. Pedro-Botet, Lipoprotein ratios: Physiological significance and clinical usefulness in cardiovascular prevention, Vasc. Health Risk Manag., 5 (2009) 757-765.