QoS Evaluation of Multiservice Applications Over
Integrated Satellite-Terrestrial Networks
Lukman Audah
Faculty of Electrical and Electronic Engineering Universiti Tun Hussein Onn Malaysia 86400 Parit Raja, Batu Pahat, Johor, Malaysia
Zhili Sun and Haitham Cruickshank
Centre for Communication Systems Research (CCSR)University of Surrey
Guildford, Surrey GU2 7XH, United Kingdom {l.audah, z.sun, h.cruickshank}@surrey.ac.uk
Abstract—This paper presents the QoS performance evaluation studies of IP over integrated terrestrial and Next Generation Satellite Network (NGSN) for HTTP web, file transfer, video streaming and VoIP applications. We compare the QoS parameters (e.g. delay, loss ratio and throughput) of the multiservice applications over Ka-Sat like satellite and the ITU-R standard Hypothetical Reference Digital Path (HRDP). We model the multiservice applications with multiple connections, different files sizes and connection durations variations. We simulate the network scenario with error model for the transmission loss environment using NS-2. A Differentiated Services (Diffserv) queue interface is used in the terrestrial network to regulate and differentiate the traffic flows while a priority queue is used as the satellite on-board-processing unit (OBP). The results showed a better top-down comparison of the QoS parameters involved in each application service across GEO satellite and the standard terrestrial digital data link.
Keywords-component; QoS; IP over Satellite; Diffserv; OBP; Integrated Network; Multiservice Applications
I. INTRODUCTION
The launched of Ka-Sat to the space orbit (90 East above the equator) by Eutelsat Communications in December 2010 [1, 2] has marked a new milestone in the next generation satellite broadband industry. It has 70 Gbps of total throughput which will be channeled via 82 Ka-band spot beams on to different geographical areas stretching from the North Africa to southern Scandinavia and small part of Middle East. The Ka-Sat is expected to be operational in the second quarter of 2011 and has the notional capacity to serve up to two million households with triple-play services (e.g. Internet, Video on Demand (VoD) streaming and Voice over IP (VoIP)). One of the satellite broadband Internet Service Provider (ISP) that will use the Ka-Sat facilities is Tooway [3]. It is expected to deliver the high speed broadband services up to 10 Mbps download and 4 Mbps upload speeds.
Previous related studies on multiservice applications over the Digital Video Broadcast (DVB-RCS/S/S2) satellite broadband [4, 5, 6] systems only analyze the satellite network scenario without integration with the terrestrial network. In addition, the studies did not make comparison of the work done with any standard hypothetical reference in term of end-to-end quality of service (QoS) performance. We believe the future Internet broadband over satellite will comprise of both
terrestrial and satellite networks and synchronize connection between both networks are vital in order to achieve optimum end-to-end QoS performance. Further comparison studies with the standard hypothetical reference is essential in order to know the potential of developed system so that further modification could be made to achieve better results. Unlike [7] which developed a complex OBP system for data traffic processing, we suggest an alternative approach by exploiting the terrestrial network capability to do the complexity functions such as traffic classification and traffic conditioning in order to relieve the satellite workload [8]. The reason is not only due to the higher satellite development cost but also because of the terrestrial networks have the advantage in term of technology, bandwidth and speed (e.g. high speed and low bit error-rate of optical fibre) compared to the satellite networks that have narrower bandwidth and prone to the transmission loss.
This paper aims to evaluate the QoS parameters of multiservice applications over the 10 Mbps of high speed satellite broadband using Ka-Sat like satellite system. We model the integrated terrestrial-satellite broadband services scenario in Network Simulator 2 (NS-2) software. A Diffserv queue interface is developed on the terrestrial network to regulate and differentiate the multiservice applications flows before crossing over the satellite network. In addition we proposed a simple priority queue with selective packets drop function as the satellite OBP. In order to make the NS-2 simulation more realistic, we create an error model which produced bit-error-rate (BER) in satellite links from the typical value of 10-7 [9] to the worst condition which is 10-6. The applications traffics used in the simulations are HTTP/1.1 web, large file transfer using FTP, VoD streaming using MPEG-4 codec and bidirectional VoIP. Moreover, we also investigate the QoS parameters against multiple new connections rate, average response files sizes and BER variation using the standard ITU-R HRDP by replacing the satellite system with a single bidirectional optical fibre link. The results may give a better understanding of QoS parameters (e.g. delay, loss ratio and throughput) variations involved in multiservice applications across the satellite and HRDP systems.
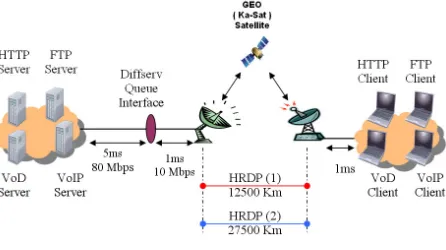
Figure 1. NS-2 simulation scenario.
II. SIMULATION CONFIGURATION
The NS-2 simulation network scenario is shown in Fig. 1 which consists of 4 remote servers, 4 remote clients, a Diffserv queue interface, two grounds to satellite links terminals (GSL), a Geosynchronous satellite (GEO) and a single bidirectional fibre optic link as the standard HRDP. There are actually three different network scenarios in Fig. 1 which are the terrestrial-satellite and terrestrial-HRDP. The main differences are only at the satellite and HRDP parameters while the rest network elements are the same. The next subsections explain the details of network elements parameters involved in the simulations.
A. Satellite Network Configuration
The satellite network used in the NS-2 simulations is based on the Ka-Sat like satellite system located at coordinate 90 east. There are 4 remote servers that transmit multiple TCP and UDP connections to 4 remote clients via 2 GSL located in London, UK (51.530 N, 00) and Athens, Greece (37.960 N, 23.720 E) respectively. We also introduced a random error model to simulate the satellite network transmission loss characteristics. The error model produced 2 different BER values which are 10-7 and 10-6 for 2 different error scenarios. TABLE I shows the satellite system parameters used throughout the simulations.
B. ITU-R Hypothetical Reference Digital Path (HRDP)
[image:2.612.317.568.55.238.2]The International Telecommunication Union - Radio Communication Standardization Sector (ITU-R) has defined the HRDP in its S.521 document [10]. It is part of the Integrated Services Digital Network (ISDN) Hypothetical Reference Connection (HRX) which is defined in the ITU-T G.821 document [11]. Both HRDP and HRX defined the concept of satellite equivalent distance in terrestrial path. In addition, the HRDP and HRX specify the performance requirement of the main transmission segments for the to-end connection. HRX specified that the longest possible to- end-to-end connections between subscribers along the earth surface is 27500 Km. There are 3 basic segments identified by typical distances of portion in the end-to-end connection of HRX. The segments are referred as low, medium and high grade segments with allowable performance degradation of 30%, 30% and 40% respectively.
TABLE I. GEOSATELLITE PARAMETERS
Parameter Value
Altitude 35786 Km
Coordinate (00, 90)
ISL bandwidth 1 Gbps
Uplink / Downlink bandwidth 10 Mbps
Figure 2. HRDP and HRX trasmission segments [12].
The HRDP is part of the high grade segment which represents the fixed satellite link with 12500 Km equivalent distance on earth. It consists of one terrestrial-satellite-terrestrial link with possibly more inter-satellite links in the space segment in the presence of many satellites. Fig. 2 shows the HRDP and HRX transmission segments as in [12].
We integrate the concept HRDP and HRX in the simulations by replacing the satellite segments with two single bidirectional terrestrial optical fibre links defined as HRDP(1) and HRDP(2) respectively as shown in Fig. 1. Therefore, there are 3 different network simulation scenarios in Fig. 1 which are using the satellite system, HRDP(1) and HRDP(2) respectively. The optical fibre specification is based on the standard optical-carrier-192 (OC-192) with transmission speed of 10 Gbps. Our objective is to study and compare the QoS variations involved in the satellite system and its standard equivalent distance of terrestrial link. The arguments that we used are “what if” the satellite system be replaced with the standard equivalent terrestrial ISDN links and “how much” the system effects the QoS performance.
C. Multiservice Applications Traffic Modeling
[image:2.612.60.283.62.187.2]1/minute. Detailed descriptions of the applications traffics used in NS-2 simulations are shown in the following subsections.
1) HTTP/1.1: The HTTP/1.1 web traffic used in NS-2 simulations is based on the Packmime-HTTP web application object that generates realistic synthetic web traffic [13]. However, we modified the average server reponse file size to be based on Pareto distribution with average value of 50 Kbytes. In addition, the average inter-arrival time for both request and response connections follow the marginal distribution which is a combination of modified fractional autoregressive integrated moving average (f-ARIMA) and Weibull distribution functions. The average new connection rates varies between 1 and 5 per second. Simplified discriptions of the complex equations of file size and new connection inter-arrival time distributions taken from NS-2 source codes are as follows.
The average server response file size is randomly generated using Pareto distribution based on average value (i.e. avg_(x)) of 50 Kbytes. Equation (1) shows the file size distribution function where x corresponds to the average file size. The RNG
variable refers to the random number generator function that generates random numbers uniformly distributed between 0.0 and 1.0. The S(x) and P variables are the Pareto scale and shape parameters respectively. The S(x) variable formula as in (2) is based on average file size in (1) while the P is a constant value of 1.27.
(1 )
1 ( )
lim ) ( ) ( P n n RNG x S x f →
= (1)
P x avg P x
S( )=( −1)× _( ) (2)
The inter-arrival time distribution is based on (3) where p
defined the f-ARIMA random distribution functions as in (4) and (5). The shape and scale variables as in (6) and (7) are the Weibull shape and scale parameters respectively. Both shape
and scale are correlated with the average new connection rate (i.e. R) value that varies between 1 and 5. The A and C
parameters are the sigma-epsilon and sigma-noise coefficients respectively while the B parameter is the f-ARIMA internal state coefficient. In addition, the D, E, and F are the Weibull coefficients while the G and H are the Gamma coefficients parameters. Detailed description of the following equations could be found in [13].
Ih(t)=−log(1−p)(1shape)×scale (3)
< − > + = = = 0 ) ( 2 2 ) ( 0 ) ( 2 2 ) ( 1 0 ) ( 5 . 0 )) ( ( t y if t y erfc t y if t y erf t y if t y f
p (4)
y(t)=A×f_ARIMA(Bt)+C (5)
( )
(
)
( )
(
( log ))
) log ( 2 1 2 F R E D F R E D shape × + × + +
= (6)
(
(
)
)
H shape G e R scale − + − × = 1 1 log 1 (7)2) Large file transfer using FTP: The FTP application used in this study is for the Internet large file transfer with average file size value (e.g. avg_(x)) of 5 Mbytes based on Pareto distribution as shown in (1) and (2). Meanwhile, the average new connection rate varies between 1 and 5 connection/minute based on Exponential distribution shown in (8). The avg_(t) is the average inter-arrival time in 1 minute reference which are 60, 30, 20, 12 and 10 seconds corresponding to inter-arrival rate between 1 and 5 connection/minute respectively. The NS-2 scheduler used the the avg_(t) values to schedule the next packets transmission within the 1 hour of simulation time. The RNG is the random number generator function that generate numbers uniformly distributed between 0.0 and 1.0.
The FTP and HTTP web applications used TCP New Reno as the underlying transport protocol. The TCP segment size used is 1500 bytes (i.e. 1460 bytes payload + 40 bytes header) with maximum congestion window size of 30 packets.
_() ( log( ( )))
1 → − × = n
e(t) avg t RNG n
I (8)
3) Video on Demand (VoD) streaming: The VoD
streaming used MPEG-4 video encoder that generates 3 types of frames which are I frames, P frames and B frames. The I frames are the intra-coded frames that contains information of encoded still image and have the lowest compression rate compare to other type of frames. The P frames are the predictively coded frames that need information from previous I frames and/or P frames for encoding and decoding processes. The P frames could achieve higher compression rate than the I frames. Meanwhile, the B frames are the bidirectionally predictively coded frames that need information from the previous and following I and/or P frames for encoding and decoding processes. The B frames have the highest compression rate compare to the others. The I, P and B frames are generated using Time Expand Sample (TES) model in two phases. The first phase is to generate a time series of correlated random variables with uniform marginals [0, 1). The second phase is the inversion process of background sequece derived from the video sample trace files in NS-2. Further details of TES model could be read in [14].
VoIP Source
VoIP Encoder
Playout Buffer
VoIP Decoder
Single Talk/ Double Talk/ Short silence/ Mutual silence/
Internet
Fair Use Policy allowable bandwidth (Mbit/s)
3
3 3
0.5
[image:4.612.53.293.56.175.2]HTTP FTP MPEG-4 VoIP
Figure 3. VoIP structure model in NS-2.
4) Voice over IP (VoIP): Bidirectional VoIP application is used bewtween the two communicating network elements in NS-2. At the source side, the VoIP encoder used GSM.AMR codec to encode the Voice Activity Detection (VAD) (e.g. talkspurt and silence activities) into 35 bytes of small packets before sending the data over the Internet channel using UDP. Upon receiving data from source, the VoIP decoder used the optimal non-causal playout buffer to pace their playout. The talkspurt and silence activities between the two conversation entities are model using modified Brady’s model. The model contain 8 conversation states in which each state represent one of the following situations [15,16].
• Single talk: either one speaker is talking.
• Double talk: both speakers are talking at the same time.
• Short silence: either one speaker is silent.
• Mutual silence: both speakers are silent.
The average new VoIP connection rate between two conversation entities varies between 1 and 5 connection/minute based on the Exponential distribution shown in (8). Moreover, the average conversation duration is 10 minute/connection based Pareto distribution shown in (1) and (2). Similarly with other applications, the new connection is created regardless of the completion of previous connection. Fig. 3 shows the VoIP structure model used in the NS-2.
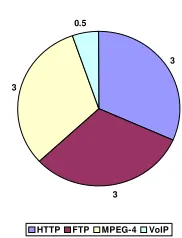
Figure 4. Bandwidth fraction for each traffic type.
D. Differentiated Services (Diffserv)
Diffserv is an Internet QoS architecture which is developed to resolve scalability problems and to provide preferential treatment to traffic flows based on class of service (CoS). The Diffserv queuing system in the NS-2 simulation used Random Early Detection (RED) queue type and the Time Sliding Window 3 Color Marker (TSW3CM) of policer type. The TSW3CM policer classifies traffic flows based on 3 drop precedence which are referred as Green, Yellow and Red. Meanwhile the RED queue consists of 1 physical queue and 3 virtual queues which correspond to the 3 drop precedence respectively. Traffic flows classification will be based on the Committed Information Rate (CIR) and Peak Information Rate (PIR). Packets will be marked as Green if the flow rate below CIR, Yellow if the flow rate between CIR and PIR, and Red if the flow rate more than PIR. The Red marked packets will be randomly dropped first followed by Yellow and Green packets respectively only if the buffer space exceeds minimum threshold. All packets will be dropped if the buffer space exceeds maximum threshold. Table II shows the Diffserv queue configuration used in NS-2. The total buffer size of a physical queue is 2000 packets with average packets size of 1500 bytes. The 3 virtual queues are virtually some fractions of the physical queue size which corresponds to the minimum threshold (minTh) and maximum threshold (maxTh). Assuming that 90% of the total buffer size used for user traffics, therefore the maxTh could be set equally to all traffic type which is 450 packets. The minTh is set less than maxTh.
In order to set the CIR and PIR for each type of traffic, we need to divide the maximum allowable bandwidth according to the fair use policy. The fair use policy is commonly used by the ISP to restrict the ways in which the network will be used by clients. Since we are studying the future services of Tooway satellite broadband services with 10 Mbps download and 4 Mbps upload speeds, therefore we used the 10 Mbps of total bandwidth as reference. Assuming that the ISP allows up to 95% (e.g. 9.5 Mbps) of the link utilization, therefore we divide the bandwidth to each traffic type as shown in Fig. 4. The bandwidth fraction corresponds to the PIR value of each traffic type. This does not mean that any traffic could not go beyond the PIR value. Any traffic could go beyond the PIR value by dynamically using other fraction of traffic type bandwidth as long as the total bandwidth follows the fair use policy. The CIR values are chosen to be less than the PIR values.
TABLE II. DIFFSERV PARAMETERS
Parameter HTTP FTP VoD VoIP
CIR (Mbps) 2.85 2.85 2.85 0.40
PIR (Mbps) 3.00 3.00 3.00 0.50
minTh (packet) 380 380 380 380
maxTh (packet) 450 450 450 450
Packet Drop Probability 1 (Green)
0.01 0.01 0.01 0.01
Packet Drop Probability 2 (Yellow)
0.05 0.05 0.05 0.05
Packet Drop Probability 3 (Red)
[image:4.612.121.212.571.690.2]Incoming non-priority
packet Outgoing packet
Incoming priority packet
UDP UDP
UDP UDP TCP TCP TCP
TCP
Head Tail
UDP UDP
[image:5.612.58.290.60.202.2]Selective Drop of UDP Packet
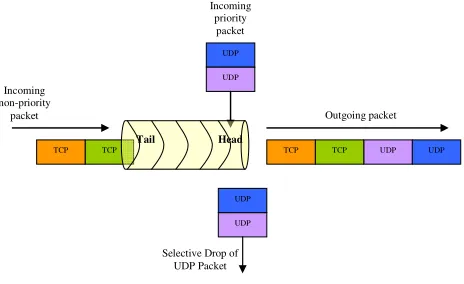
Figure 5. Priority queue model for the satellite OBP.
E. Satellite On-Board Processing (OBP)
The OBP refers to the satellite queuing management. It shows the capability of a satellite to manage the traffic flows variation and maintain the QoS at optimum level. We divide the traffic class into 2 categories which are delay-sensitive and
throughput-sensitive. The HTTP web and FTP traffics used TCP with reliable connection. The TCP ensures all packet transmitted are successfully received and any packet loss will cause retransmission process. Higher packet loss will severely degrade the QoS. Therefore we categorized these traffics as
throughput-sensitive which must be protected from being dropped by the queue. Meanwhile, the VoD (e.g. MPEG-4) streaming and VoIP traffics are the applications that sensitive to delay. Higher delay will severely degrade the QoS. Moreover, these traffics used UDP as the transport protocol which is non-reliable connection without retransmission function. Packet loss will no be retransmitted. Therefore, we categorized these applications traffics as delay-sensitive.
We model the OBP as a priority queue with selective packet drop function as shown in Fig. 5. The throughput-sensitive traffic will be queued from the tail of the queue while the delay-sensitive traffic will be queued from the head of the queue. This is done in order to make the delay-sensitive packets being served first by the queue. However, when the current queue size reach its maximum limit size (i.e. 2000 packets), then the delay-sensitive packets will be selectively dropped. Since the delay-sensitive packets could be divided into MPEG-4 video and VoIP packets, therefore either one of them will be dropped at a time. The queue will scan all packets in the buffer and counts the number of video and VoIP packets. If the video packets more than the VoIP packets in the buffer at that particular time, then the last video packet arrived in the queue will be dropped and vice versa.
III. SIMULATION RESULTS AND ANALYSIS
Each NS-2 simulation is carried out for approximately 1 hour of simulation time. The simulations are done 5 times for each connection rate values (e.g. R values between 1 and 5) in 2 different BER values (e.g. 10-7 and 10-6). Therefore, the total numbers of repeated simulations are 30 times for terrestrial-GEO, terrestrial-HRDP(1) and terrestrial-HRDP(2) network scenarios. The simulation results and analysis are divided into 3
QoS categories which are delay, loss ratio and throughput. The QoS parameters are calculated based on each simulation output trace file using AWK programming script and then presented in the form of tables.
A. Average End-to-End Packet Delay
The packet delay is calculated by subtracting each packet received time at the client (tr) to the packet sending time from
the server (ts). The average packet delay in second (D) is then
calculated by summing all packet delays and then divided by the total number of successful received packets (Pt) at the client
side as shown in (9).
(
)
t n i
i
i s r
P t t
s D
∑
== −
= 1
)
( (9)
The average end-to-end packet delay in second as shown in TABLE III, IV and V are proportional to the increment of average new connection from each traffic type. The average delays are steadily increased between 1 and 3 average new connection rate and then significantly increased on the subsequent connection rate with maximum delay achieved by flows with BER value of 10-6 in all systems and traffic types. When many connections are established per second or minute, the higher would be the end-to-end delay. This is mainly due to the increment queuing delay in most end-to-end data links in order to serve the increment incoming data rate. In addition, the average packet delay also increased when the BER increased from 10-7 to 10-6. Moreover, the delay values are much higher in GEO system compare to HRDP(1) and HRDP(2) due to the distinct difference in altitude distance.
TABLE III. AVERAGE END-TO-END DELAY OVER GEOSATELLITE (S)
Average New Connection Traffic Type
& BER 1 2 3 4 5
10-7 0.2720 0.2721 0.2727 0.2763 0.2778 HTTP
10-6 0.2730 0.2733 0.2744 0.2786 0.2798 10-7 0.2739 0.2744 0.2751 0.2805 0.2847 FTP
10-6 0.2743 0.2757 0.2765 0.2838 0.2889 10-7 0.2653 0.2658 0.2669 0.2694 0.2711 VoIP
10-6 0.2655 0.2665 0.2674 0.2706 0.2719 10-7 0.2719 0.2722 0.2726 0.2749 0.2768 VoD
10-6 0.2724 0.2728 0.2734 0.2767 0.2783
TABLE IV. AVERAGE END-TO-END DELAY OVER HRDP(1)(S)
Average New Connection Traffic Type
& BER 1 2 3 4 5
10-7 0.0592 0.0593 0.0613 0.0686 0.0689 HTTP
10-6 0.0597 0.0612 0.0635 0.0835 0.0836 10-7 0.0597 0.0602 0.0618 0.0716 0.0727 FTP
10-6 0.0598 0.0622 0.0644 0.0858 0.0866 10-7 0.0522 0.0525 0.0538 0.0584 0.0601 VoIP
10-6 0.0523 0.0530 0.0547 0.0659 0.0689 10-7 0.0582 0.0585 0.0597 0.0657 0.0658 VoD
TABLE V. AVERAGE END-TO-END DELAY OVER HRDP(2)(S)
Average New Connection Traffic Type
& BER 1 2 3 4 5
10-7 0.1087 0.1089 0.1107 0.1145 0.1162 HTTP
10-6 0.1090 0.1094 0.1111 0.1221 0.1233 10-7 0.1096 0.1109 0.1120 0.1167 0.1208 FTP
10-6 0.1096 0.1102 0.1114 0.1271 0.1301 10-7 0.1022 0.1024 0.1038 0.1069 0.1074 VoIP
10-6 0.1024 0.1028 0.1046 0.1130 0.1149 10-7 0.1080 0.1082 0.1093 0.1118 0.1136 VoD
10-6 0.1082 0.1090 0.1100 0.1219 0.1230
Apart from the distinct differences in propagation delays in all systems, the delay variation is caused by two main factors which are the increments of queuing delay in most links and the increment of packet retransmission of TCP flows. In addition, the rapid increased of delay after 3 average new connection rate is also due to the additional factor which is the early drop process by Diffserv queue for the Red marked packets. The incoming packets of new connection flows in all traffic type keep on increasing regardless of the completion of previous flows. When the traffics burst rate become more than the queue serving time, packets will be dropped and longer delay is needed to retransmit the TCP packets from server to client. Accumulation of TCP packets retransmission process will increase the TCP connection duration and subsequently increase the number of active connections in the end-to-end data links. As the results, this causes the global increment of packet delay. Besides that, the proposed priority queue managed to keep the delays for delay-sensitive traffics (i.e. VoD streaming and VoIP) lower than the throughput-sensitive
traffics (i.e. HTTP web and FTP).
B. Average End-to-End Packet Loss Ratio
The packet loss ratio (L) defined the ratio of total packet loss (Pl) over the total transmitted packet from server to client
[image:6.612.313.569.65.264.2](Ps) as shown in (10).
TABLE VI. AVERAGE PACKET LOSS RATIO OVER GEOSATELLITE
Average New Connection Traffic Type
& BER 1 2 3
10-7 0.000962 0.000980 0.001016
HTTP
10-6 0.009938 0.010025 0.010196
10-7 0.000983 0.001012 0.001098
FTP
10-6 0.010751 0.010803 0.010909
10-7 0.000031 0.000038 0.000052
VoIP
10-6 0.000447 0.000460 0.000481
10-7 0.001097 0.001110 0.001176
VoD
10-6 0.011526 0.011789 0.011943
Average New Connection Traffic Type
& BER 4 5
10-7 0.001032 0.001174
HTTP
10-6 0.010231 0.010292
10-7 0.001149 0.001248
FTP
10-6 0.010955 0.011039
10-7 0.000076 0.000099
VoIP
10-6 0.000502 0.000547
10-7 0.001228 0.001467
VoD
10-6 0.012025 0.012054
TABLE VII. AVERAGE PACKET LOSS RATIO OVER HRDP(1)
Average New Connection Traffic Type
& BER 1 2 3
10-7 0.000070 0.000109 0.000131 HTTP
10-6 0.001234 0.001238 0.001251 10-7 0.000097 0.000123 0.000133 FTP
10-6 0.001298 0.001339 0.001341 10-7 0.000024 0.000029 0.000037 VoIP
10-6 0.000049 0.000054 0.000075 10-7 0.000120 0.000134 0.000138 VoD
10-6 0.001395 0.001432 0.001457 Average New Connection
Traffic Type
& BER 4 5
10-7 0.000135 0.000200
HTTP
10-6 0.001305 0.001512
10-7 0.000138 0.000313
FTP
10-6 0.001415 0.001555
10-7 0.000055 0.000076
VoIP
10-6 0.000092 0.000135
10-7 0.000145 0.001122
VoD
10-6 0.001491 0.002127
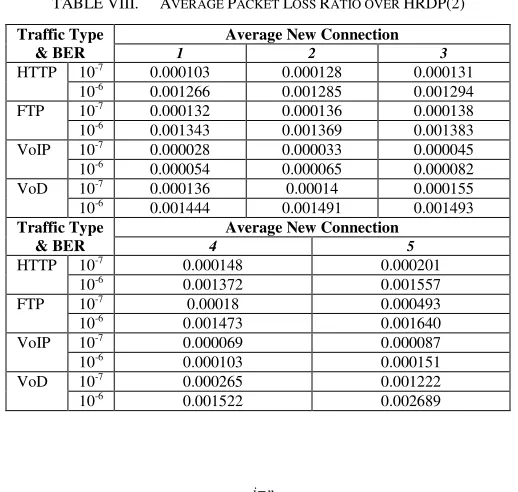
TABLE VIII. AVERAGE PACKET LOSS RATIO OVER HRDP(2)
Average New Connection Traffic Type
& BER 1 2 3
10-7 0.000103 0.000128 0.000131 HTTP
10-6 0.001266 0.001285 0.001294 10-7 0.000132 0.000136 0.000138 FTP
10-6 0.001343 0.001369 0.001383 10-7 0.000028 0.000033 0.000045 VoIP
10-6 0.000054 0.000065 0.000082
10-7 0.000136 0.00014 0.000155
VoD
10-6 0.001444 0.001491 0.001493 Average New Connection
Traffic Type
& BER 4 5
10-7 0.000148 0.000201
HTTP
10-6 0.001372 0.001557
10-7 0.00018 0.000493
FTP
10-6 0.001473 0.001640
10-7 0.000069 0.000087
VoIP
10-6 0.000103 0.000151
10-7 0.000265 0.001222
VoD
10-6 0.001522 0.002689
( )
( )
∑
∑
=
= =
= =
n i
i i s n i
i i l
P P
L
1
1 (10)
[image:6.612.312.571.276.522.2]The minimum average end-to-end packet loss ratio for all systems could be seen in each traffic type at 1 average new connection rate and BER of 10-7. Meanwhile, the maximum average loss ratio values are at 5 average new connection rate and BER 10-6. The average packet loss ratio for VoD streaming traffic is higher than HTTP web and FTP traffics mainly due to the early packet drop process by the Diffserv and also selective packet drop by the priority queue. Besides that, the VoIP has the lowest average packet loss ratio because the traffic carries very small packet size and does not exceeds the fair use policy bandwidth fraction in most of the time.
C. Average End-toEnd Packet Throughput
The average end-to-end packet throughput (T) is calculated by dividing the total received packet (Pt) at the client side over
the total duration of each traffic type. The value is then multiplied by 8 and divided by 1000 to get the value in Kbps. The application traffic duration is calculated by subtracting the receiving time of last packet at the client side (tl) to the sending
time of first packet from the server side (tf) as shown in (11).
The traffic duration is slightly less than 1 hour of simulation time because each traffic type starts a few seconds after the network simulation scenario setup is completed.
1000 8 ) (
)
( 1 ×
− =
∑
==
f l
n i
i i t
t t
P
Kbps
T (11)
The average end-to-end packet throughput could be regarded as the conclusion of previous QoS parameters because the parameters are closely related as shown in (11). The average throughput is proportional to the total received packet variation and inverse proportional to the packet delay variation. Based on TABLE IX, X and XI, the average end-to-end packet throughput in Kbps is proportional to the increment of average connection rate, except for the VoD streaming traffic. The higher the average connection rate, the higher would be the Pt
value in (11). The VoD streaming traffic is exceptional in this case because it uses only 1 average new connection/minute. The total transmitted packets remain almost the same during the entire simulation while the delay value (i.e. divisor in (11)) keeps on increasing when the average new connection rate of other traffic type increased. However, the average throughput values in all traffic flows are lower when the BER equal to 10-6 compared to the flows with BER 10-7 due to many packets loss.
The maximum average end-to-end packet throughput could be seen in terrestrial-HRDP(1) system at BER 10-7 while the minimum average end-to-end packet throughput could be seen in terrestrial-GEO system at BER 10-6. The maximum average packet throughput is achieved at 5 average new connection rate for all traffics except the VoD streaming which is at 1 average new connection rate. The main reason other than the BER factor (e.g. as shown in TABLE VI, VII and VIII) that cause the lower average throughput in terrestrial-GEO system is also due to the higher end-to-end RTT (e.g. as shown in TABLE III, IV and V).
TABLE IX. AVERAGE THROUGHPUT OVER GEOSATELLITE (KBPS)
Average New Connection Traffic Type
& BER 1 2 3
10-7 343.5180 695.6649 1087.0275 HTTP
10-6 343.3279 695.6377 1086.8133 10-7 294.6074 677.6351 1098.4110 FTP
10-6 283.7430 675.9140 1087.3415
10-7 23.2299 43.0578 62.8611
VoIP
10-6 22.5959 42.9940 62.3761
10-7 1892.1931 1890.7961 1887.8901 VoD
10-6 1871.3099 1869.3138 1868.5890 Average New Connection
Traffic Type
& BER 4 5
10-7 1475.3433 1951.7460
HTTP
10-6 1468.5647 1924.8815
10-7 1426.6242 1826.3049
FTP
10-6 1426.5160 1762.0156
10-7 85.8065 111.3068
VoIP
10-6 85.4385 110.6742
10-7 1887.3420 1887.2406
VoD
[image:7.612.313.570.64.484.2]10-6 1868.5555 1867.3175
TABLE X. AVERAGE THROUGHPUT OVER HRDP(1)(KBPS)
Average New Connection Traffic Type
& BER 1 2 3
10-7 344.5814 696.3418 1087.5103 HTTP
10-6 343.5607 696.0549 1087.2995 10-7 300.2728 681.8100 1102.6363 FTP
10-6 299.9472 681.2453 1102.2178
10-7 23.5238 44.2878 63.2270
VoIP
10-6 22.8913 43.3615 62.8749
10-7 1897.7493 1893.8844 1892.6920 VoD
10-6 1896.3394 1890.4320 1888.7911 Average New Connection
Traffic Type
& BER 4 5
10-7 1481.9453 2055.0792
HTTP
10-6 1481.9407 2052.3165
10-7 1437.2996 1877.6182
FTP
10-6 1436.4719 1877.3339
10-7 85.9698 112.3490
VoIP
10-6 85.7534 110.7022
10-7 1891.6254 1888.9905
VoD
[image:7.612.315.568.518.719.2]10-6 1887.8191 1885.6149
TABLE XI. AVERAGE THROUGHPUT OVER HRDP(2)(KBPS)
Average New Connection Traffic Type
& BER 1 2 3
10-7 343.5757 696.0567 1087.1688 HTTP
10-6 343.4940 696.0443 1087.0990 10-7 299.1200 679.6220 1101.1449 FTP
10-6 298.5806 679.2519 1099.3751
10-7 23.3152 43.8924 62.9147
VoIP
10-6 22.6584 43.1670 62.3838
10-7 1893.0832 1891.4511 1891.4159 VoD
10-6 1888.8911 1887.8590 1885.4204 Average New Connection
Traffic Type
& BER 4 5
10-7 1481.9078 2052.3576
HTTP
10-6 1481.7544 2052.2844
10-7 1432.4263 1872.1286
FTP
10-6 1431.7865 1870.5350
10-7 85.9508 111.6345
VoIP
10-6 85.5202 109.6100
10-7 1891.0840 1887.3282
VoD
IV. CONCLUSION AND FUTURE WORKS
This paper has presented the simulation studies to show top-down comparison between the GEO satellite system and its equivalent hypothetical terrestrial data link system (i.e. ITU-R HRDP) for the end-to-end QoS performance evaluation of multiservice applications (i.e. HTTP web, FTP, VoD streaming and VoIP). The end-to-end QoS parameters (i.e. average packet delay, average packet loss ratio and average packet throughput) are measured against the average connection rate and BER variation for 1 hour of NS-2 simulation time. The studies show that the QoS parameters variations are proportional to the increment of average connection rates and BER values. In addition, other parameters that contribute to the QoS parameters variations are the queuing delay and the buffer size. Moreover, the studies found that the GEO satellite system has lower end-to-end QoS performance for multiservice applications compared to the standard ITU-R HRDP terrestrial system mainly because of the distinct differences in round-trip-time (RTT). In addition, the priority queue with selective packet dropped scheme provides suitable QoS for the delay-sensitive traffics (i.e. VoD streaming and VoIP).
The future works aims to enhance the end-to-end QoS of the multiservice applications by using cross-layer method which will involve the transport and network layers. The global QoS degradation due to TCP retransmission processes could be reduced with TCP Performance Enhancement Proxy (PEP) method. The PEP will improve the TCP performance by using split connections and dynamic window resizing based on the available bandwidth. This method will significantly reduce the TCP RTT especially in GEO satellite system. Besides that, the network layer enhancement may involve load balancing method with multipath routing in order to optimize the bandwidth utilization. Moreover, an admission control with Diffserv queue system could be placed in the terrestrial network to regulate and differentiate the traffic flows based on current delay and throughput in order to reduce the satellite workload for data processing.
ACKNOWLEDGMENT
L.Audah thanks the Malaysia Ministry of Higher Education for the generous financial support.
REFERENCES
[1] “Ka-Sat net-dedicated spacecraft lifts off,” http://www.bbc.co.uk/news/ science-environment-12065466.
[2] “Ka-Sat,” http://www.youtube.com/watch?v=H8eMEXz6Byo&feature= player_embedded.
[3] “Tooway,” http://www.tooway.com.
[4] G. Fairhurst, A. Sathiaseelan, C. Baudoin and E. Callejo, “Delivery of triple-play services over broadband satellite networks,” IET Journal of Communications, vol. 4, no. 153, pp. 1544-1555, September 2010. [5] G. Gardikis and A. Kourtis, “Using DVB-S2 adaptive coding and
modulation for the provision of satellite triple play services,” Journal of IEEE Communications, vol. 46, no. 12, pp. 128-135, December 2008. [6] L. Vignaroli, V. Migone, M. Rossini, A. Bertella, M. Tabone, A.
Vaccaro and G. Boccolini, “DVB-S2 ACM and ACM/QoS integration for triple-play bi-directional satellite services in the UNIC project,” in
Proceedings of 10th International Workshop on Signal Processing for Space Communications, SPSC 2008, Rhodes Island, Greece, October 2008, pp. 1-7.
[7] S. Kittiperachol, Z. Sun and H. Cruickshank, “Performance evaluation of on-board QoS support for multiservice applications on the integrated next generation satellite-terrestrial network,” in Proceedings of 4th International Conference on Advanced Satellite Mobile Systems, ASMS 2008, Bologna, Italy, August 2008, pp. 311-316.
[8] L.Audah, Z. Sun and H. Cruickshank, “End-to-end QoS of IP-Diffserv network over LEO satellite constellation,” in Proceedings of 2nd International ICST Conference on Personal Satellite Services, PSATS 2010, Rome, Italy, February 2010, pp. 99-113.
[9] M. Allman, D. Glover and L. Sanchez, “Enhancing TCP over satellite channels using standard mechanisms,” RFC 2488, 1999.
[10] “Hypothetical Reference Digital Paths for systems using digital transmission in the fixed-satellite service,” ITU-R S.521-4, International Telecommunication Union (ITU), January 2000.
[11] “Error performance of an international digital connection operating at a bit rate below the primary rate and forming part of an Integrated Services Digital Network,” ITU-T G.821, International Telecommunication Union (ITU), December 2002.
[12] Z.Sun, Satellite Networking: Principles and Protocols, 1st ed, John Wiley & Sons Ltd, 2005, pp. 212-214.
[13] J. Cao, W.S. Cleveland, Y. Gao, K. Jeffay, E.D. Smith and M. Weigle, “Stochastic models for generating synthetic HTTP source traffic,” in
Proceedings of 23rd Conference of the IEEE Communications Society,
INFOCOM 2004, Hong Kong, March 2004, vol. 3, pp. 1546-1557.
[14] A. Matrawy, L. Lambadarisand C. Huang, “MPEG4 traffic modeling using the transform expand sample methodology,” in Proceedings of 4th
International Workshop on Network Appliances, IWNA 2002,
Gaithersburg, USA, January 2002, pp. 249.
[15] A. Bacioccola, C. Cicconetti and G. Stea, “User-level performance evaluation of VoIP using ns-2,” in Proceedings of 2nd Performance Evaluation Methodologies and Tools, ValueTools ‘07, Nantes, France, October 2007.