The Structural Optimization of Ceramic Fuel Cells
Oleksandr Vasylyev
*, Mykola Brychevskyi, Yehor Brodnikovskyi
Frantcevych Institute for Problems of Materials Science, Ukraine
Copyright©2016 by authors, all rights reserved. Authors agree that this article remains permanently open access under the terms of the Creative Commons Attribution License 4.0 International License
Abstract The paper addresses questions concerning the
structural optimization of ceramic fuel cells (CFC) aiming to increase the ionic conductivity realized at long term operation of zirconia electrolyte in the very structure of CFC applying scandia as the stabilizer of zirconia cubic phase and electron beam physical vapor deposition as the production method of the CFC's electrolyte film. Its chemical composition would be optimized in a course of a few iteration processes of a substance transfer from virgin powders into the electrolyte phase of CFC laminated composite, which is changed by diffusion processes between CFC electrolyte and its electrode layers during CFC production and long-term operation. The final, optimized, chemical composition and structure of entire CFC would be tuned by taking into account the structural altering occurring during both production and operation.Keywords
Ceramic Fuel Cell, SOFC, Boundaries, Electrical Conductivity, Mechanical Behavior, 1Ce10ScSZ Zirconia Powders, EB-PVD, Structural Optimization1. Introduction
Ceramic Fuel Cell (CFC), or in their probably first definition – Solid Oxide Fuel Cell (SOFC), is a high temperature device that converts the chemical energy of fuel and oxidant’s interaction into electricity and heat through electrochemical reactions, i.e. directly with no any intermediate conversions.
Thereby, CFC as a fuel cell system can offer very high electrical efficiencies (twice as high as traditional converters, for instance, heat machines). They offer perspectives to decreasing fuel consumption for stationary (local combined heat and power, CHP), mobile (auxiliary power units, APU, or hybrid vehicles), or portable (battery replacer) applications, as well as reducing CO2, NOx and other
pollutant emissions due to both much higher efficiency of energy conversion and comparatively low operating temperature. No moving parts are involved in the energy conversion process and, thus, valves and air blowers comprise the only moving parts in the fuel cell system, which improves reliability and increases safety in the application.
At its very beginning, thanks to at least three of its pioneers – Humphrey Davy (1802), Christian Schoenbein (1838) and William Grove (1845), the fuel cell has been born and invented as a typical chemical device consisting of liquid aqueous electrolyte and two platinum electrodes placed in a vessel.
It was logical that the idea of the ceramic fuel cell was begun realizing as some analog of a fuel cell based on liquid electrolyte – as a set of solid parts, namely solid electrolyte, and anode and cathode electrodes applied to electrolyte as well as some interconnect. All the CFC parts were chosen as the best from the point of view of their properties to meet operating functions.
The solid oxide electrolyte is a principal substance of the CFC because namely this component makes the fuel cell phenomenon feasible. The solid electrolyte prevents the direct interaction of gases, fuel and oxygen, and does their reactions controlled in time and place, and not capable of an explosive behavior.
Readers could find the fascinating histories on solid electrolyte and fuel cell developments in [1-4].
The very idea of "the solid electrolyte" goes probably back to the time of Henry Cavendish (1774) who had observed an increasing conductivity of glass on heating. The early stage of solid oxide development is closely associated with particular activities of prominent scientists such as H. Davy (1802), who probably was the first who formulated the very idea of fuel cell, Michael Faraday (1833) with his well-known research on electrolytes, and Jean-Mathee Gaugain (1853), who discovered galvanic solid electrolyte gas cells. The need in solid electrolytes has grown in the late 19th century when Pavlo Jablochkoff (1877), Wilhelm
Ostwald (1894) and others have been developing fuel cell electrodes that could withstand aggressive liquid electrolytes such as molten alkali carbonates in order to realize the idea “Electricity Directly from Coal” that was then popular, and that, by the way, begun to be interesting now again [5].
In fact, the first SOFC in its current understanding was developed by Emil Baur and H.Z. Preis in 1937 [6]. For its electrolyte, they had used the so-called Nernst-mass (85-wt. % ZrO2 + 15-wt. % Y2O3) following Walter Nernst
(1897), who applied it in production of his incandescent lamps for filaments (glowers) [7-9].
Nernst-mass is practically the best ceramic electrolyte for high and 600 oC temperature fuel cells [10].
The current science and technology on fuel cells are based on properties of individual materials those make up them, though, the fuel cell phenomenon is realized by the whole fuel cell. The fuel cell consists of electrolyte and two electrodes, anode and cathode, which provide transportation of gases to the electrolyte and electrons to an external electric network. In total, the fuel cell has to ensure a stable long-term course of chemical reaction between the fuel and oxidizer.
The CFC is not being constructed from its individual parts joined between them mechanically. The CFC is being constructed as a single unit, in which the solid (ceramic) electrolyte is in an intimate mechanically inseparable contact with the electrodes. The basic chemical reactions between fuel and oxidant gases releasing useful electrical and heat energies occur at points of the electrolyte-electronic conductor-pore contacts. Taking into account its support that carries a thin, comparatively weak mechanically, CFC and its electrical contacts, such a system is a polyfunctional laminar composite, properties of which must be considered as the properties of the single unit. It is obvious that in order to secure the cell integrity and electrical contacts between cell layers their thermal expansion mismatch must be minimized. However, this important task is facilitated by the fact that the electrolyte material being as an ionic conducting part of both electrodes is forming a zirconia-ceramic skeleton made of one material. An electronic conductor of electrode is clinging to its ionic conductor through its open pores.
If CFC is built as supported on any electrode, the main property of electrolyte is its density and ionic conductivity. The near 100 % density is required in order to prevent any direct interaction of fuel and oxidant gases. They may react being only in ionic states exclusively. The attention is concentrated on ionic conductivity and its temperature dependence. According to these indicators, a chemical composition, which could ensure the necessary number of oxygen vacancies in electrolyte crystal and transportation of oxygen across it, is been chosen. Nano- and microstructures are influencing significantly on the ion movement that is why their impact is studied intensively.
If a fuel cell is built on the electrolyte as a holder of the whole CFC, the importance of electrolyte mechanical behavior is obvious also.
CFC is a high temperature device for very long operation, term of which is defined by decades of years. After European developers have exceeded the requirements of the US Department of Energy about 40,000 hours (~4.5 years) of the SOFC operation life, the European Horizon 2020 program has begun to demand more than 25 years?! At such the conditions, it more than obvious that knowledge on effect of temperature and time of operation on fuel cell behavior is required in order to predict possible long term changes of entire fuel cell energy systems.
And finally, in CFC that is a high temperature device, the
main part of which – electrolyte resides in a direct intimate contacts with electrodes under an electric tension of ~0.7-1.0 V, and hedges off reducing and oxidizing atmospheres. The thickness of the gas-tight electrolyte layer in the fuel cell consists of 5 – 10 µ. Namely through this thin partition – membrane, the transportation of oxygen ions, which may move in ionic crystal along chains of oxygen vacancies only, occurs. It is obvious that properties of this electrolyte film must be high and stable as possible.
CFCs are being made currently using high energy technologies, sintering or deposition from a vapor state, which facilitate interdiffusion between structural components. In typical sintered CFCs, this phenomenon was noticed for quite some time ago and doping of electrolyte by chemical elements from adjacent electrodes, first of all, Ni, Mn, La and Cr was detected there [11-19 and others]. In the CFCs made with electron beam – physical vapor deposition (EB-PVD) technique, the same reveals itself much faster.
At EB-PVD, the deposition process of electrolyte film of 10-15 µm onto NiO – ZrO2 porous anode substrate lasts
comparatively quickly, 10 – 20 min, its initial composition is distorted significantly due to diffusion of Ni and Y from the substrate. The amount of Ni in 1Ce10ScSZ (ZrO2 –
10-mol. % Sc2O3 – 1-mol. % CeO2) electrolyte is more than
2-wt. % at the anode-electrolyte interface. It means that amount of dopants negatively influencing on oxygen ionic conductivity is higher than might be admitted from the point of view of a phase stability of zirconia stabilized with scandia. As result, the conductivity of EB-PVD 1Ce10ScSZ film deposited on NiO-YSZ substrate is much lower (~one order of magnitude) than might be expected from the data on conductivity of bulk samples [19].
What does happen in the electrolyte film produced by traditional ceramic technique without application of electron beam is still unknown. It is known only that electrical properties of CFC become worse notably during the first 100-200 hours of operation. During this term, the electrolyte conductivity of bulk samples made of nano-powders decreases respectively. Then, the properties become practically unaltered for above 1500 hours [20]. Such the behavior might be as a result of completing structural equilibration in the CFC composite for so short time. It is quite possible too that the equilibration processes could occur much faster at EB-PVD method of the CFC production.
The similar processes take place in CFC electrodes. Their progress is burdened by gas atmospheres.
Anyhow, the above listed results in degradation of CFC properties. And, despite the obvious importance, they are not studied yet in a full measure in order to be used for further enhancement of CFC and prediction of their long-term behavior [21].
behaviors is the key to understanding of CFC properties, properties of entire device and its separate materials and their improvement after that. The main thing of this study is to get the necessary number of samples and tools for their processing that could provide the necessary set of material parameters to be suitable for a study and data comparison.
As our research practice says, the sufficient set of boundary properties could be ensured with different powder types and temperatures of their sintering for some fixed time. As to sintering temperature, it is easy question. The typification of powders is much heavier task. It requires huge ponderous comprehensive comparative structural research of ceramics made of different powders of comparatively the same chemical composition. Fortunately, the first crop has been harvested already.
The goal of the paper was to analyze the data accumulated on structure of 1Ce10ScSZ solid bulk electrolyte made of three types of powders and sintered at different temperatures, and thin EB-PVD electrolyte film, and its mechanical behavior related to grain boundaries, which could be revealed with biaxial bend loading and scanning electron fractography, and grain boundary electrical conductivity to be revealed with impedance spectroscopy, and formulate a concept of structural optimization of the CFC based on scandia stabilized zirconia operated at 600 oC.
2. Materials and Methods
10Sc1CeSZ (1-mol. % CeO2 – 10-mol. % Sc2O3 –
89-mol. % ZrO2) ceramics that is considered now as the most
promising electrolyte for CFC was made of three types of 10Sc1CeSZ zirconia powder of formally the same chemical composition, but using different initial raw materials and synthesis conditions resulting in different morphology, impurities composition and distribution. The powders were subjected to comprehensive characterization with traditional analytical techniques and analyzed in numerous literature.
The typification of powders has its origin in their morphological and chemical features, morphological and mechanical properties of their agglomerates, ability to be sintered and mechanical behavior of their ceramics consolidated with uniaxial and cold isostatic pressing. The listed properties were obtained at comparative studies. The Type I powder (developed by V. Vereshchak and produced at Vilnohirsk Mining & Metallurgical Plant and Zirconia Ukraine Ltd., Ukraine) was made by co-precipitation technique; the Type II powder delivered by Daiichi Kigenso Kagaku Kogyo, DKKK, Japan, was produced, as we could know, by the hydrothermal synthesis, and the Type III powder delivered by Praxair, USA, was made by spray-pyrolysis.
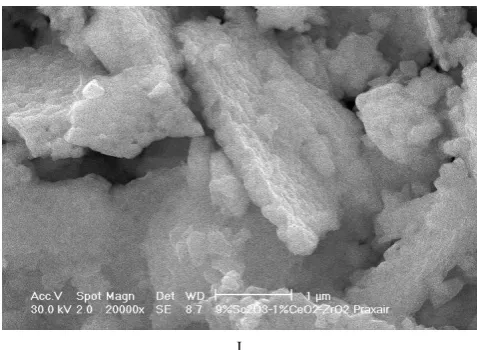
The structural and mechanical properties of these powders, the methods of manufacturing as well as the comparative results were reported earlier [20, 22, 23 etc.]. Here, we remind only that the Type I powder is agglomerated in ~2.5 µ semisoft-semirigid creatures of rod-like morphology consisting of 11±2 nm initial particles; the Type II is
practically non-agglomerated and consist of soft 73±20 nm particles of a isotropic morphology, and the Type III is agglomerated in ~1.3 µ rigid ceramic husk-like creatures, which are, in fact, as thin plates of well-sintered ceramics. For easier discussion of data, the electron microscopy pictures of the powders are gathered in Figure 1.
The powders were milled in alcohol for 24 h using ZrO2
ceramic balls and left to dry in air. Afterwards, 10Sc1CeSZ powders with no any sintering aids were uniaxially pressed at 30 MPa into discs of 20 mm in diameter and 1.5 – 2 mm thick. The samples were sintered in the temperature range of 1250-1550 °C for 1.5 h in air using VK 1600, Linn High Term furnace (Germany). Strength of the as-sintered samples was measured with biaxial bend loading technique at the self-made installation. The fracture surfaces of the samples were observed with the scanning electron microscope (SEM, Superprobe 733, JEOL).
Materials and methods of ceramics characterization are described in details in [20, 23 and others]. Here, we would like to remind that the initial carriers of dopants, contaminants or impurities are surfaces of initial particles and their agglomerates. During sintering they are redistributing between grains and their boundaries forming grain boundary complexions, which are transforming in the courses at their heat treatment at sintering. As to features of chemical composition of samples obtained with a wet-technique, the concentration of impurities in the bulk made of the Type I and the Type III powders is around 0.01-wt. %. The Type II is much purer; it contains only 0.001-wt. % of impurities. Regarding the nature of the contaminants, the Type I is contaminated mainly with silica (0.05 %) and alumina (<0.025 %) while in the Type III mainly silica (0.05 %) and titania (<0.14 %) are present. Additional minor contamination in the form of K, Na, Ca, and Fe was also found in Types I and III powders. From the point of surface-bulk distribution obtained with secondary ion mass spectroscopy, in the Type II, the surface of particles is enriched with Sc and Al; in the Type III, Sc and Si are mostly present on the surface. In the Type I, the surface is depleted with Sc; while Sc and Si are mostly localized in the bulk of the particles.
The electrical impedance of the samples was measured as a function of AC frequency using a Solartron 1260 impedance/gain-phase analyzer within the frequency range of 10-2-106 Hz at 600 oC in air. For these measurements, the
silver paste electrodes were deposited onto the sample surface and sintered. The diagrams were modeled by means of electrical equivalent circuits (EC), which consisted of two or three parallel RC-circuits and a resistor connected in series, and analyzed in [24, 25]. As a result, the model parameters such as the resistances and capacitances of the grains and grain boundaries, Ohmic resistances, and the parameters (α, Θ and β), which reflect the deviation of the impedance spectra from the Debye`s view, were obtained.
The data on bulk electrolyte are expounded first. They are followed by the data on EB-PVD thin electrolyte film, its nucleation and growth mechanisms as instruments of nano-size structure formation to be suitable for 3D microionic construction and structural optimization of the СFC. The discussion is completed by formulation of a concept of structural optimization of the zirconia ceramic fuel cells.
3.1. Scandia Stabilized Zirconia and Related Problems The realization of high oxygen ionic conductivity of solid electrolytes based on zirconia to be ensured with scandia is facing at least two problems.
A
B
C
D
F
G
H
I
Figure 1. The high-resolution (A), conventional transmission (B,D,G) and scanning (E,F,H,I) electron microscopy images of three 10Sc1CeSZ powder Types (A,B,D-F) and their agglomerates (C,G-I). A-C – Type I, D-F – Type II, and G-I – Type III [20,22].
The first one is a comparatively old problem of high temperature structural instability of scandia stabilized zirconia (SSZ) that results from arising in it high resistance phases [26,27]. The problem is solving by additional doping of zirconia with ~1-mol. % of the second stabilizer like ceria, alumina, titania etc. But the second doping decreases the conductivity significantly, reasons of which are still unclear. Both, chemical composition of electrolyte and its structure are not optimized yet. The first problem is related to electrolyte material that is considered as a separate substance, which is beyond the fuel cell, i.e., it has no direct contacts with electrode materials and is not loaded by high temperature gases, which are different at each side of electrolyte plate.
The second one is a comparatively "fresh" problem, which became considered only recently. It is determined as chemical and structural instability of electrolyte arising in it in a course of both production of CFC and its long term high temperature operation. It is clear that the first problem is a part of the second one, where the electrolyte material is not only influenced by temperature, but its thin layer gets in contact with other materials by high energy method and exposes to reducing and oxidizing gases through contacting gas permeable porous electrode materials for a long time.
The second problem is a degradation problem of film electrolyte essentially, which is placed in a structure of laminated composite and exposed to aggressive high temperature environments, which are different on its both sides. Moreover, the electrolyte film is nucleating and growing on supporting electrode material from vapor phase of electrolyte material excited by electrons.
[image:5.595.312.551.73.248.2]It sets the tasks to study as follows:
How does electrolyte condense from the vapor phase and grow on the porous heterogeneous substrate? What is happening with electrolyte film when it is
exposed by cathode material?
What is happening with a material of rather thin (<10 µm) electrolyte film, which is placed between two different materials of electrodes, anode and cathode, during a comparatively short time of production at temperature above 1000 oC in air at conventional
technological CFC route and vacuum, in the case of application of EB-PVD technique?
What is happening with electrolyte film during long term (thousands hours) operation at, e.g., 600-800 oC
being exposed by reducing or redox atmospheres (fuel) at one side (anode) and oxidizing atmosphere (air) at another side affected through permeable materials of corresponding electrodes?
We know already that the electrolyte film of ~20 µm thickness being deposited by EB-PVD technique on NiO-ZrO2 anode during a rather short (less 30 min) time
deposition process is enriched with nickel, concentration of which near the anode-electrolyte interface consists of around 2-wt. % and around 1-wt. % near free film surface [19,28,29]. We see that electrolyte film is not only structurally but also chemically heterogeneous, in which, e.g., Ni, as well as Y that is not shown here, a gradient distribution across the film thickness occurs. There are some data pointing out that NiO could stabilize cubic structure of zirconia acting similar traditionally used CeO2 etc. [30-32], and this phenomenon is
proposed to be used for correlation of the electrolyte composition. The similar phenomena occur probably on a cathode side of the electrolyte also.
The analogous changes in solid phases take place in the anode. Moreover, this phenomenon is enhanced under the action of hydrogen [33-35].
As to cathode, there are still no reliable data on its influence on structure of the electrolyte film.
Considering zirconia-based electrolyte materials as polycrystalline, it is usually believed that silica is decreasing conductivity of zirconia due to its segregation along grain boundaries. The logic is simple: smaller grain size – larger specific grain boundary surface – purer boundary – higher conductivity. However, as to silica, we see, the Type II electrolyte is generically more pure (more than one order of magnitude – 0.004-wt. % in it – against 0.05-wt. % in the Type I or the Type III ones). The similar situation is observed with alumina. Suppose that segregation of silica along grain boundaries has increased indeed due to grain growth during around 150 hours that results in significant conductivity decrease observed. After this term, the conductivity of the silica doped electrolyte becomes unchangeable vs. time and equal to the conductivity of the purer electrolyte that is the Type II one.
Thus, zirconia based electrolyte of technical purity, doped with silica and alumina, ensure the same level of
conductivity similar to its more pure analogue. In that time, there are some structural states of 10Sc1CeSZ electrolyte that ensure significantly higher conductivity. However, this high level of conductivity is suppressed by elements, which are mutually diffusing between electrolyte and electrodes that takes place at both production of CFC, especially when EB-PVD technique is used, and during its operation that is probably promoted by hydrogen.
The cases mentioned are saying that in order to keep the ionic conductivity high enough and stable or even increased at a long time of operation, chemical composition and structure of electrolyte film might be optimized or, saying by another words, be correlated by taking into account their changes during both making the CFC, especially with EB-PVD technique, and its operation at real environments. The correlation of electrolyte consists in modification of some initial chemical composition, which could be changed during the CFC production process and some (not very long) term of the CFC operation or its training, in order to produce finally some "ideal" composition that could ensure the best conductivity, which, additionally, might be even improved during operation instead of a traditional decrease with time.
In such a way, the electron beam might be considered as the effective tool of quick electrolyte modification that is able also to change the concepts of both the zirconia powder selection for electrolyte and the CFC production.
3.2. Structure and Properties of the Bulk Electrolyte Structural parameters of sintered materials depend on sintering temperature Ts. It is obviously that a dependence
of strength σ and mechanical behavior in general on sintering temperature might be defined as some function of structural constituents, first of all, porosity P, grain size d and some property γ, something like the surface energy, which describes quality of boundaries between structural constituents and depends on amount and ordering of admixtures along them.
In general, following [36], the strength σ in dependence on Ts might be described by a complex function as
σ(Тs) = f{P(Тs), d(Тs), γ(Тs)}.
Considering the effect of sintering temperature on structure and mechanical behavior of zirconia electrolytes as well as processes of powder consolidation and structure refinement at sintering as thermally activated, the relations installing dependencies between strength and grains and subgrains, porosity, quality of boundaries and sintering temperatures, as well as imaginary activation energies determining densification or porosity, grain size growth, boundary states and strengthening /weakening at cleavage or intergranular fracture mechanisms were determined.
The detailed analysis of the effect is given in [23]. As to the porosity P of 1Ce10ScSZ ceramics, its dependencies on sintering temperature Ts shown in Figure 2.
It is obvious that they might be approximated by the Arrhenius’s exponents as
where Uc is the imaginary activation energy of
densification.
It is seen that ability to densification is different in all the ceramics. The dependencies of porosity vs. sintering temperature are consisting of two parts: low- and high temperature ones. The transition between them occurs in withinity of 1400 – 1450 oC. Each part (except of high
[image:7.595.314.552.112.401.2]temperature one in the Type II ceramics where the densification does not observe) has own the imaginary energy of activation, which are 0.35 and 0.78 eV in the Type I ceramics, 1.4 eV in the Type II ceramics sintered in its low-temperature stage, and 1.38 and 3.99 eV in the Type III ceramics, respectively (Table 1).
Figure 2. The Arrhenius’s dependencies of porosity of 1Ce10ScSZ ceramics made of three powder types on sintering temperature, Type I; Type II, and Type III [23].
Except very different ability to densification, the ceramics have the different ability to grain growth also. The Arrhenius’s dependencies of the average grain size on sintering temperature are shown in Figure 3. It is seen that the dependencies might be described by exponents also, however, here, we have to note that the interval of sintering temperatures studied comprises both sintering stages, namely, the stage of a final sintering and the stage of an intraagglomerate consolidation. The transition from low- to high-temperature part takes place near 1400 – 1450 °С that is unexpectedly coinciding with data on temperature dependence of grain growth in structural tetragonal zirconia ceramics Y-TZP where tetragonal structure of zirconia is stabilized by 3-mas. % of yttria [37]. It is noted there that the transition from slow to fast grain growth occurs in withinity of 1400 oC. This transition results in a practically
double growth of the activation energy from 2.80 to 5.46 eV.
The imaginary activation energies, Ugg, of grain size
growth in 1Ce10ScSZ ceramics is given in Table 1. It is obvious that Ugg is radically different for different sintering
stages and depends strongly on the powder type also. At the final sintering stage, the imaginary energies of activation are 2.65, 2.90 and 4.21 eV for the Type I, the Type II and the Type III electrolytes, respectively. For interagglomerate sintering, Ugg is similar in ceramics of II and III Types, 0.96
and 1.01 eV respectively.
Table 1. The imaginary energies of activation of densification Uc, and
grain growth Ugg of electrolyte ceramics sintered of three types of
1Ce10ScSC ceramics at temperatures below and higher their inflection points To [23].
Powder type
Imaginary activation energy, in average, eV
Uc Ugg
Temperatures
<Tο >Tο <Tο >Tο
І 0.35 0.78 - 2.65
ІІ 1.4 ∼0 0.96 2.90
ІІІ 1.38 3.99 1.01 4.21
Figure 3. The Arrhenius’s dependencies of average grain size of 1Ce10ScSZ ceramics made of three powder types on sintering temperature, Type I; Type II, and Type III [23].
The dependence of the biaxial strength measured at room temperature on sintering temperature is shown in Arrhenius coordinates in Figure 4. Unlike dependencies of porosity and grain size, they are not similar. Furthermore, the Type II curve has a discontinuity at the inflection point in withinity 1375 oC. I.e., the strength of each ceramic type on
sintering temperature may be described by two exponents but their imaginary activation energies are so different, magnitude and sign, that in the case of the Type II ceramics we have to talk about weakening instead of strengthening. The imaginary energies of activation for strengthening / weakening, Us, of three Types of 1Ce10ScSZ ceramics is
given in Table 1.
Fracture mechanisms and strength of 1Ce10ScSZ electrolyte at room temperature are described in [20, 23].
[image:7.595.63.296.239.379.2]Figure 4. The Arrhenius’s dependencies of room temperature biaxial strength of 1Ce10ScSZ ceramics made of three powder types on sintering temperature, Type I; Type II, and Type III [23].
This picture is altering with sintering temperature that results from the boundary complexion transitions that might be defined as the transition of the second kind that is, in fact, the transition between boundary complexions, between subgrain boundary and grain boundary ones. The first kind of the transition is the boundary complexion transition, which occurs within the same category of boundaries, e.g., intergranular one that is traditionally discussed. The second kind is the transition between categories of boundaries, e.g., from subgrain category to grain one. It may occur, i.e., at refinement of grains with a heat treatment removing impurities or unwanted structural elements from the grain. As result, the grains are refined from the subgrain boundaries, contaminations are redistributed within the grains or removed from them onto their boundaries. In such a way, the boundaries of subgrains disappear in much extent, and the grain boundaries remain in their new state. It may happen at some critical temperature interval. As a final result, material properties may alter at this temperature of heat treatment / sintering abruptly. The authors are succeeded in observing these phenomena relating fracture behavior, fracture mechanism especially, and electrical conductivity that will be shown below.
We have to note that the boundaries in the Type I ceramics do not reveal themselves in fractures practically at all with the microscopes available as it is possible to see in Fig. 5A, 5B. Though, the thermally etched surfaces of its samples evidence that some internal boundaries are there (Fig. 6A).
The Type II ceramics allow observing subgrains, which have been as initial particles before the sintering, and have united and created grains in a course of sintering. These grain creatures are well-visible already in samples sintered at 1250 oC for 1.5 hour (Fig. 5C-5E). The fractographical
situation here is similar to that is observed at brittle fracture of deformed polycrystalline metals like Mo, W, Cr where two categories of boundaries may be observed simultaneously, namely boundaries of big initial grains and boundaries of small grains, which are as subgrains, which have arisen in material during plastic deformation. At 1300oC, the Type II particles are consolidated already well
enough (Fig. 5C). The sites of their joining, interparticle boundaries, are strong, stronger than of particle body;
particles fail with the cleavage fracture mechanism mainly. Increasing sintering temperature only for 50 oC, to 1350 oC,
results in dramatic increase of densification and new details in the fracture, so-called fragmentation that itself is fragmenting a large cleavage surface that is result of nano- and microcracking along boundaries of particles (Fig. 5D). Their joint effect is the maximal possible strengthening with particle boundaries that might be renamed as subgrain ones. The strength may reach above 400 MPa (Figure 4). Thermally etched surfaces reveal two categories of structure: subgrains and grains, both of which are clearly distinguished in samples sintered at 1350 and 1450 oC (Fig. 6B-6C).
At sintering temperatures above 1350 oC, the cracking
resulted from an interaction of cleavage crack with the particle / subgrain boundaries is disappearing. We observe the typical picture of cleavage fracture of brittle polycrystalline material decorated by river patterns and crack slopes on each grain boundary (Fig. 5E). As result, the strengthening effect by boundaries decreases abruptly and strength drops to ~200 MPa at 1400oC (Figure 4). It is
necessary to underline that material become slightly denser but significantly weaker because a number of strengthening elements decreases abnormally. Further increase of sintering temperature results in logical growing grain size and decreasing strength.
As to the Type III ceramics, their feature is that they fail with brittle interpartial and intergranular fractures mainly (Fig. 5F, 5H), and partially with cleavage in sintered at 1450oC samples (Fig. 5G), in vicinity of which the transition
from interpartial to intergranular fracture occurs where the strengths of particle bodies for cleavage and interpartial joining is probably equal. In vicinity of this transition temperature, that is near the inflection point on temperature dependence of grain size growth, its activation energy is altering from 1.01 to 4.21 eV [23]. The grains and their subgrains are clearly visible on thermally etched surfaces of samples (Fig. 6D).
Thus, the Type III ceramics manifest the second kind of the complexion transition also, but the transition from particle boundaries to grain ones is complicated by that fact that it occurs in the material, subgrain boundaries of which is contaminated heavily by SiO2 and TiO2. And, if the
complexion transition in the Type II ceramics occurs at a cleavage fracture mechanism mainly (Fig. 5C-5E), the transition in the Type III ceramics occurs at a fracture mechanism, the brittle crack of which is spreading along boundaries of particles at lower sintering temperatures and grains at higher temperatures (Fig. 5F, 5H). Only at temperature of the transition, that is around 1450oC, samples
[image:8.595.64.295.75.207.2]A
B
C
D
E
G
H
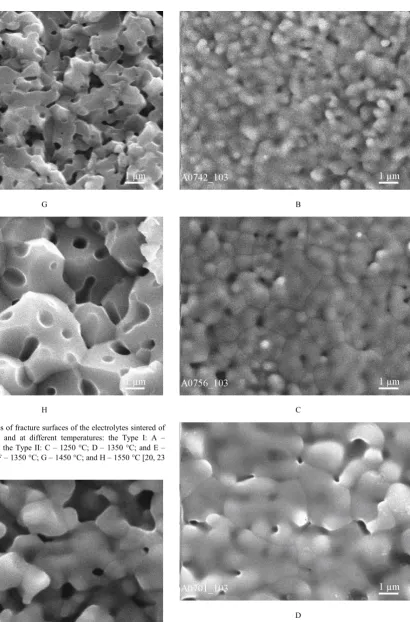
Figure 5. SEM images of fracture surfaces of the electrolytes sintered of different powder types and at different temperatures: the Type I: A – 1400 °C; B – 1550 °C; the Type II: C – 1250 °C; D – 1350 °C; and E – 1550 °C; the Type III: F – 1350 °C; G – 1450 °C; and H – 1550 °C [20, 23 etc.].
A
B
C
D
[image:10.595.133.544.65.688.2] [image:10.595.58.297.544.727.2]3.3. Electrical Conductivity of the Bulk Electrolyte The impedance spectroscopy allows distinguishing the contribution of each structural constituent into overall resistance of the material. It is traditionally applied for characterization of CFC materials. This non-destructive method is studying the system response to the application of a periodic small amplitude alternating current signal. These measurements are carried out at different frequencies. Analysis of the system response contains information about the boundaries, their structure and reactions taking place there.
The impedance spectroscopy data of ceramics obtained at the 600 oC test is given in [24] where the influence of the
grain and subgrain boundaries on electrical conductivity of the 1Ce10ScSZ electrolyte is considered. The required variety of the structural boundaries – subgranular and granular – are investigated for three types of the zirconia ceramics sintered at different temperatures and given below for each one separately.
3.3.1. The Type I Ceramics
As it was observed [24], the impedance spectra of the Type I samples have two or even three semicircles with the two intercepts on the real axis at higher frequencies corresponding to the total Ohmic and polarization resistances, respectively. The third semicircle in the low frequency range (<1 Hz) is due to the electrode effects and was observed only for the samples sintered at relatively low temperatures, 1250-1300 oC that had low mechanical
strength and were highly porous leading to high Ohmic resistances. The second intercept at the intermediate frequencies of 50-100 Hz is related to the blocking of charge carries due to the internal surfaces of the specimens also denoted as intergranular response (grain boundary). The first semicircle at high frequencies (with the peak frequency of 200-398 kHz was assigned to the bulk (intragranular) response (grain) and the intercept on the real axis in the high frequency range represented the total Ohmic resistance.
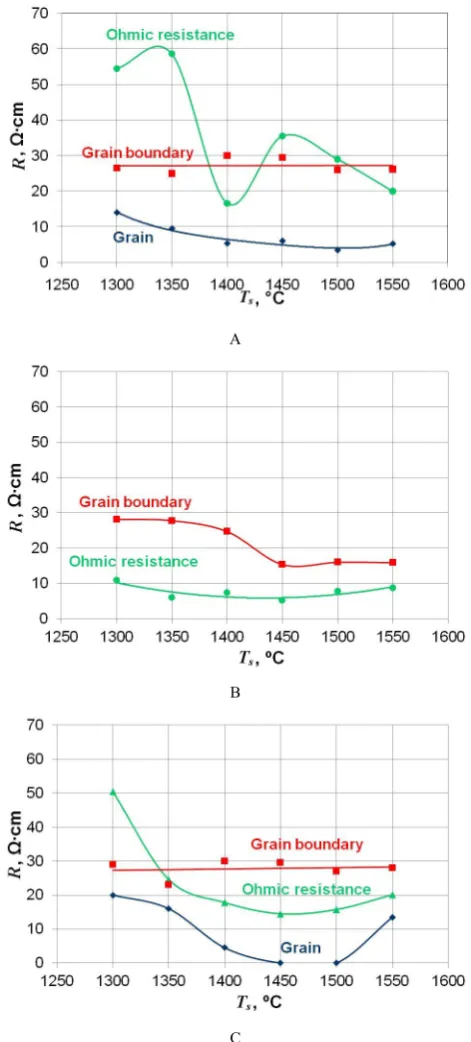
The grain boundary resistance of the Type I samples is about 30 Ω∙cm (Fig. 7A) that does not depend on the sintering temperature. The porosity of the samples decreases from 37 to 21 % with increasing sintering temperature from 1300 to 1550 °C, causing increase in the electrical conductivity of the samples. The results of the secondary ion mass spectroscopy showed [20] that the surface layer of Type I particles has a large amount of contaminants – Al3+, Si4+ and K+, which are known as
elements decreasing the ionic conductivity. The grain resistance of the Type I samples is equal to 14 Ω∙cm and 9.5 Ω∙cm at 1300 and 1350 °C sintering temperatures, respectively, and further temperature increase to 1400-1500 °С decreases it to ~ 5 Ω∙cm.
3.3.2. The Type II Ceramics
The Type II 10Sc1CeSZ samples have only one
semicircle indicating the grain boundary resistance in the frequency range of 50-79 Hz [24]. They have the highest total ionic conductivity due to near zero grain resistance. The grain boundary resistance of the samples obtained at 1300-1350oC is about 30 Ω∙cm, slightly decreases at
1400oC, and drops twice as much at 1450-1500 oC (Fig.
7B).
A
B
C
Figure 7. Grain, grain boundary and Ohmic resistances of the Type I (A), the Type II (B), and the Type III (C) samples vs. sintering temperature. Dots – experimental data, lines – model approximation [24].
[image:11.595.314.550.166.688.2]at the intermediate sintering temperatures and then increases again to the initial values at sintering temperature of 1550 oC. As result of the high purity of the Type II
powder (<10-3 wt. % of impurities) a considerable grain
growth during the sintering process is observed. Such behavior can be explained by the weak influence of the initial boundaries of the particles (subgrains) on a grain recrystallization during the sintering process. Due to this, identification of the grain edges (subgrains) is very complicated and the structure fragmentation totally disappears at the sintering temperatures above 1400 °C. We assume, that the absence of the grain response (explained by the extremely low impurities content and the decrease of the grain boundary resistance of the samples sintered at the temperatures above 1450 oC) is determined by the grain
boundaries improvement, for instance, homogenization of the impurities and structural changes of the grain boundaries.
3.3.3. The Type III Ceramics
As it is shown in Fig. 7C, the Type III samples sintered at 1300-1400 oC and 1550 oC have two semicircles
responsible for the grain boundary (63-316 Hz) and the grain bulk (316-794 Hz) resistances. All other Type III samples demonstrate only one semicircle related to the grain boundary response (126-158 Hz). Here, the grain boundary resistance (30 Ω∙cm) is similar to the Type I ceramics and is independent on the sintering temperature. However, taking into account significant densification and porosity decreases from 37 % at Tsint = 1300 oС to ~0 % at
Tsint = 1550 oС, the grain boundary resistance is increasing.
This can be explained by the electrical conductivity decrease relevant to the Al3+, Si4+, and K+ doping ions
found on particle surfaces in this and Type I powders at the first stage of sintering, and the porosity localization along grain boundaries at the second sintering stage. The grain bulk and the Ohmic resistances of the ceramics are decreasing with increasing sintering temperatures up to 1450-1500 °C, however, they are increasing at Tsint = 1550 oС. Unlike Type I, the Type III powder consists of
chips-like agglomerates that together with interpartial admixtures (TiO2, SiO2) accelerate the sintering. An
improved contact between the grains at Tsint = 1450-1500 oС
decreases the grain bulk and the Ohmic resistances (0 and 15 Ω∙cm), respectively. The increase of the grain bulk resistance to 13.5 Ω∙cm and Ohmic resistance to 20.2 Ω∙cm at Tsint = 1550 oС is related to the intragranular porosity
increase.
Comparing data on the electrical response, it was unexpected, that the electrical resistance responsible for boundaries in the samples made of all three powders sintered at temperatures up 1300-1400 оС is practically the
same and equal to ~30 Ω∙cm. Only at further increase of sintering temperature, the changes of an intergranular resistance related to the sintering temperature are observed.
In pure the Type II material, the grain boundary resistance drops abruptly by half. The relevant changes are
observed in mechanical strength that drops abruptly by more than half. The nanocracks related to subgrain boundaries disappear as relevant fractographical mark of the interaction between the cleavage cracks and the subgranular boundaries (Figs. 5C-5E). These complex properties may indicate that in the Type II electrolyte, the sintering at 1350-1400 oС results in a full dissolution of
initial particle boundaries, which play a role of subgrain boundaries and are observed as a fractographical fragmentation of grains fracture with cleavage (Fig. 5D) and high subgrain boundary resistance (Fig. 7B).
The data on the impedance spectroscopy and mechanical behavior (SEM fractography and strength) also indicate two different stages of the traditionally determined boundary or intergranular resistance. During the first stage, till the 1300-1400 оС critical temperatures, the boundary resistance
in 10Sc1CeSZ is ~30 Ω∙cm that is independent on contaminants and other properties of powders used for the electrolyte production. The improvement of interpartial or subgranular boundaries is reflected in a rapid growth of the electrolyte strength to more than 400 MPa at biaxial bend. High electrical resistance (~30 Ω∙cm) of these boundaries points out a weak influence on temperature at this stage of sintering.
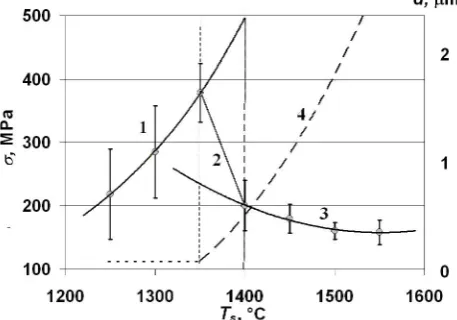
Figure 8. The generalized schematic representation of a Type II ceramics strengthening-weakening with sintering temperature that results from relative structural element altering. 1 – subgrain strengthening, 2 – transition from subgrain strengthening to grain weakening, 3 – grain growth weakening, 4 – size of effective structural element [23].
Considering an influence of sintering temperature on the structural parameters and mechanical behavior of 10Sc1CeSZ electrolyte we might conclude [23] that the sintering temperature of 1300-1400 oС is critical for the
Type II material. Namely at this temperatures, the activation energies of grain growth and densification, strengthening or weakening occur. Namely in vicinity of 1300-1400 oС, the
strength of the Type II electrolyte is decreased abruptly that is a result of replacement of basic strengthening constituent of the material when subgrains, which boundaries were improved with increasing temperature up to ~1375 oС and
dissolved with a further increasing temperature to ~1400 oС,
[image:12.595.317.546.375.535.2]here that the grain size does not reveal any evident deviations from the exponential growth that might cause such dramatic changes of the mechanical strength and its decrease from more than 400 to 150 MPa. Schematically, the results of the contradictory processes are shown in Figure 8, where the transition between strengthening elements and their sizes are given also. The reader is asked to compare Figs. 8 and 7B.
During the second stage, at temperatures above 1300-1400 оС, the situation is changed radically. Here, the grains, the boundary structure of which became rather perfect in order to be easy distinguished fractografically via as both disorientation like in pure the Type II electrolyte and admixture segregation additionally like in Types I and III electrolytes. The intergranular constituent of the resistance may be decreased with both abrupt decrease of a specific boundary surface like it happens in Type II electrolyte, and promoting chemical composition of a small amount of impurities segregating along grain boundaries.
In ceramic electrolytes containing a large number of contaminants, the grain boundary response has an unexpected behavior. The temperature increase and the adequate growth of the grain size that depends on amount of admixtures, which are either constraining grain growth like in the Type I electrolyte, or promoting grain growth like in the Type III electrolyte, do not reflect measurably in neither increase, neither decrease of the grain boundary resistance in spite of the influence significantly on the mechanical behavior. At the level of 30 Ω∙cm, the difference in neither chemical composition of admixtures and their amounts, nor in their distribution across structure of initial powder particles.
It is known that a deviation from the Debye`s model indicates a greater degree of structural heterogeneity [24]. The application of the Havriliak-Negami model [38] to the single semicircle may be as an evidence of continuous solid microstructure, where the grain and grain boundary phases cannot be distinguished, i.e., both the bulk of the grains and the intergranular layers have the same chemical composition that may explain the existence of the only one semicircle in a complex plane of Type II 10Sc1CeSZ electrolyte impedance. Thus, the solid phase of the Type II electrolyte is as single-phase in contrast to the Types I and III where there is the grain bulk and the phase of the intergranular layers of different origins.
In such a way, the heat treatment, determined by temperature and time, via sintering and the powder typification are the suitable and convenient thermodynamical and chemical tools for the boundary engineering with “useful or non-useful” admixtures to control the boundary complexions and their transitions in sintered materials such as stabilized zirconia electrolyte. Using this approach, the most full variety of structural parameters such as porosity, subgrain and grain size growth and redistribution of admixtures across structural constituents and their boundaries, and altering their states have become available for the study. Joint analysis of data
obtained with electron microscopy and related techniques, mechanical tests for strength, scanning electron fractography and impedance spectroscopy of structural constituents of electrical resistance is giving much more reliable information on the effect of boundaries and their complexions on properties of materials especially such as ceramic electrolytes where mechanical behavior is as important as their conductivity.
In the electrolyte made of three types of 1Ce10ScSZ powder, two kinds of boundary complexions, subgranular and granular, were observed. They are developing in both very pure and of technical purity materials with sintering temperature. Moreover, the transitions between complexions, those might be defined as the boundary complexion of the second kind, occur. The transition results in dramatic altering of electrolyte properties.
The first kind of the boundary complexion transition means usually the transition within the same category of boundaries, e.g., of subgrains or their grains. The second one is the transition between categories, e.g., from subgrains to their grains when the mechanical behavior and the boundary resistance become to be determined by grain boundaries, of course, jointly with the grain bulks.
The second kind of the boundary complexion transition caused by sintering in temperature interval 1250 – 1550 oC
occurs in both very pure 1Ce10ScSZ ceramics (the Type II), boundaries of which are contaminated with small amounts of Sc and Al, and in 1Ce10ScSZ of technical purity (the Type III), powder of which is contaminated with large amounts of silica (0.05 %) and titania (<0.14 %).
The Type I ceramics made of powder contaminated with silica (0.05 %) and alumina (<0.025 %) does not reveal any notable changes in properties those might be related to the boundary complexion transitions in the temperature interval of the sintering studied. The Type I ceramics does not reveal nor fracture mechanism change (it fails with cleavage only), nor boundary resistance change. The dependence of the grain size on sintering temperature of the Type I ceramics in Arrhenius coordinates has the inflection at ~1450 oC.
The boundary complexion transition in the Type II ceramics reveals itself as the transition from subgrain strengthening to grain weakening, which manifests the abrupt drop of strength resulting from any interaction of cracks with intragranular (subgrain) boundaries accompanied by cleaning the cleavage picture from any marks of cracking at boundaries. It occurs in samples sintered in the narrow temperature interval 1350 – 1400 oC
where the dependence of the grain size on sintering temperature in Arrhenius coordinates has the inflection.
The boundary complexion transition in the Type III ceramics reveals itself as the transition from the brittle interpartial fracture to the brittle intergranular one except a mixed with cleavage intergranular fracture at temperature 1450 oC where the dependence of the grain size on sintering
1Ce10ScSZ electrolyte is largely heterogeneous, and its degree of heterogeneity is determined by not only the type of the powder, but its sintering temperature. In many cases, the electrical resistance of the polycrystalline electrolyte samples is determined by the grain bulk and their intergranular layers. In some cases, like in the Type II electrolyte, the polycrystalline electrolyte exists as a single phase one where ionic conductivities of grain bulk and their boundaries are similar. This results in the electrical response with the only one semicircle characterizing the resistance of the boundary complexion.
It is surprising that the resistance of intergranular phase is near 30 Ω∙cm in all samples made of very different the Type I and Type III powders sintered at all temperatures studied, and does not depend on the type and the amount of admixtures (either SiO2 and Al2O3 in the Type I, either SiO2
and TiO2 in the Type III, either the third oxides (the total
number of Si, Al, Ti, Fe oxides is ~0.01 %) in the Type II at sintering temperatures below ~1375 oC) and their
distribution across the grains, grain size and general porosity.
Only in the Type II electrolyte sintered at temperatures above ~1375oС, the boundary resistance is abruptly
decreasing from ~30 to 17 Ω∙cm. Namely, in withinity of this temperature, the activation energy of numerous thermoactivated processes of powder consolidation is changed, the grain bulk is purifying from the subgrain boundaries as the fractography evidences. The mechanical strength decreases here abruptly from 400 MPa to 150 MPa as result of abrupt replacement of the effective strengthening structural element from subgrain for grain and, thereby, abrupt decrease of their number.
As to the grain bulk resistance, it can be concluded that in the Type I electrolyte, it decreases continuously from 14 to 6 Ω∙cm with porosity decrease at 1300-1450 oС and does
not depend on structural evolution considering the cleavage fracture mechanism that may evidence continuous altering in the grain bulks and their boundaries with no any transitions, at least at temperatures in the interval studied. In the Type II electrolyte, the grain body resistance cannot be detected indicating that the electrochemical properties of the grain bodies and their boundaries are the same, and the material looks like a single phase one. In the Type III electrolyte, the resistance decreases from 20 to 5 Ω∙cm at decreasing porosity and interpartial fracture mechanism at 1300-1400 oС; it becomes almost zero at mixed fracture
mechanisms containing intragranular cleavage (1450-1500oС), and increases to 13 Ω∙cm during the
recrystallizing grain growth.
3.4. Structure and Properties of EB-PVD Electrolyte Film
EB-PVD is a promising process that might enhance the electrochemical performance of CFC. EB-PVD deposited thin layers contribute to the CFC lifetime increase and their cost reduction. CFC based on 1Ce10ScSZ electrolyte
deposited by EB-PVD has demonstrated an area specific resistance of ~0.6 ohm∙cm2 at 600 oC and a He leakage rate
below 10-4mbar∙l∙cm-2∙s-1 [28]. The conductivity of EB-PVD
deposited films on a NiO-8YSZ anode is ~50 % higher than that of layers made with traditional SOFC technology [19]. The data were obtained at once with no any optimization.
This high performance is the result of a combination of 1Ce10ScSZ powder, ensuring high electrolyte conductivity, and the electron beam technique, ensuring dense unidirectional nano-sized structure on highly porous NiO-8YSZ anode substrate. Additionally, a strong adhesion of the EB-PVD electrolyte to the porous anode is achieved, which in itself is a very important prerequisite for high quality SOFCs. The EB-PVD films consist of columns (nanosized diameters and microsized length) and microlamellae; they have a cubic crystalline structure. In addition, the films made of 1Ce10ScSZ powders are doped with Ni and Y due to an interdiffusion of dopants between the anode substrate and the deposited EB-PVD film. The Ni content at the anode – electrolyte interface (AEI) can exceed 2-wt. % that may decrease its conductivity significantly in a course of CFC operation. An area of EB-PVD film bordering AEI has higher the elasticity modulus than average [29].
However, one problem that has yet to be solved is the comparatively high gas leakage through zirconia films deposited on porous NiO-ZrO2 substrates. This requires both
further elaborations of comparatively thick films deposited on highly porous two-phase substrates and comprehensive structural characterization of EB-PVD films. This not only refers to the bulk of a film, but mainly to its interface with the heterogeneous substrate.
3.4.1. Structure revealed at a micron level
A polished cross-section of the transitional zone between the electrolyte film and its NiO-ZrO2 substrate shows that the
EB-PVD film has a columnar and laminar structure that is invisible in fracture (Figures 9 and 10).
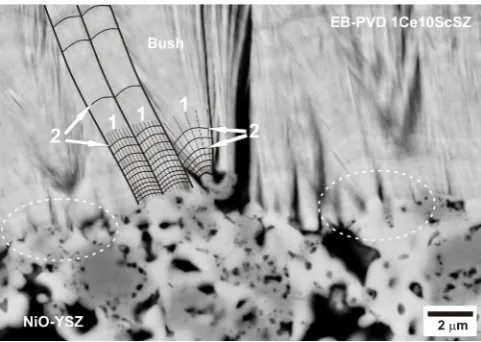
The porous substrate is well covered by film in spite of its rather big pores. With respect to structural features, columns and filaments, nano- and microlaminae, cracks between filaments and groups thereof and pores can be discerned. The interface line is discontinuous; it is interrupted by pores as it is seen in areas highlighted by the white ellipses. Some less structured layer with a lighter color can be distinguished in the electrolyte zone nearest to the anode.
Figure 10 displays the SEM image of a fracture cross-section of a ~65 µm thick film that has been fractured in a bi-axial bending test. As it is seen, the electrolyte film has a well-defined columnar nano-structure and has failed at the transcolumnar cleavage with some intercolumnar fracture that implies rather high adhesion between the columns.
Figure 9. SEM (back scattered electron) image of polished cross-section of the anode–electrolyte interface zone. In the anode part, white areas are ZrO2 (1Ce10ScSZ) phase; light grey ones are NiO phase; black areas are pores. In the electrolyte part, filaments (1), bushes of filaments and nano- and microlaminae (2) are clearly recognized. Black areas are interfilament cracks and pores. A lighter stripe bordering the NiO-YSZ composite can be clearly discerned. Ellipses highlight areas with interface discontinuities resulting from the nucleation in groupings of cell/filaments (bushes) [29].
Figure 10. SEM image of the anode-electrolyte interface zone revealed in a fracture cross-section of the NiO-8YSZ anode substrate – 1Ce10ScSZ EB-PVD electrolyte film [29].
It can also be seen that the porous structure of the anode is well covered by the electrolyte layer. There are no visible delamination cracks along the interface between the film and its NiO – 8YSZ substrate that might eventually lead to CFC failure. The EB-PVD film has no visible porosity. It can be seen also that the EB-PVD electrolyte film on the porous NiO-8YSZ substrate grows like bushes consisting of long branches, which have nano-sized diameter.
3.2.2. Structure revealed at a submicron level
The structure of the AEI area of the 1Ce10ScSZ film formed on 8YSZ grains of the anode (ZrO2-ZrO2 AEI) after
annealing at 1100 oC is shown in Figs 11A-11B. It is seen
that zirconia grain of the substrate is covered by a continuous, smooth, porous layer of 300 – 500 nm thickness, which has no any other visible structure. This layer is covered by columns or filaments those are almost perpendicular to the
AEI along all the visible (~7-8 µm) part.
The deposited columns / filaments surround the supporting 8YSZ grain like petals of daisy or sunflower. Schematically, the structure of 1Ce10ScSZ film on the 8YSZ substrate deposited with EB-PVD is sketched in Fig. 12A.
The porosity of the 1Ce10ScSZ layer is high and has no any visible order. The size of pores displays a large scatter of values in the 10-60 nm range.
The line of the 1Ce10ScSZ – 8YSZ AEI looks smoothly curved; it consists of an uniform chain of pores of around 10 nm size, which makes the AEI easy visible. It is possible to assume that the electrolyte layer was amorphous and very defective initially and the facetted pores in the layer have arisen during annealing.
The investigated columns / filaments have about 100 to 300 nm diameters. They are separated by discontinuous, longitudinal interfilament flaws of 100-200 nm width and a few µm lengths.
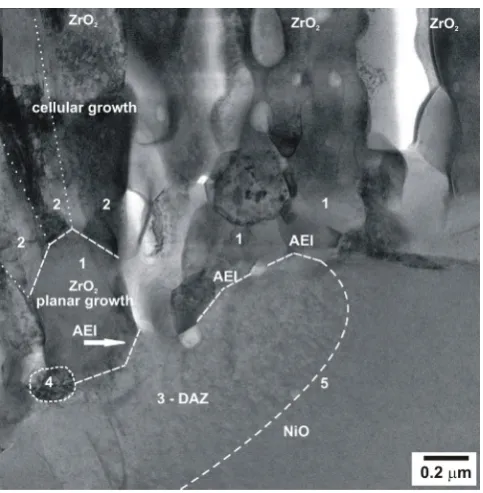
[image:15.595.57.298.74.245.2]With respect to the 1Ce10ScSZ – NiO part of the AEI, the structural features are somewhat more complicated as it is seen in Figs 11B. In contrast to the 1Ce10ScSZ – 8YSZ AEI, the 1Ce10ScSZ – NiO AEI is not smooth. Moreover, it is discontinuous and stepped. Its discrete parts or island are dense, monocrystalline or polycrystalline (Figure 13).
Fig. 11B displays a few zirconia (1Ce10ScSZ) dendrites, or bushes of columns / filaments, which have nucleated on a NiO grain along ~3.5 µm of its boundary length. In contrast to the 1Ce10ScSZ – 8YSZ AEI, the zirconia dendrites have nucleated here on some preferable crystallographic planes like trees on a hill terrace. Zirconia dendrites seem to nucleate and grow on the NiO substrate in one direction, probably [100]. In full analogy with bushes or trees, a trunk, branches / filaments, and even some 1Ce10ScSZ root in the NiO substrate may be distinguished. Moreover, the zirconia trunks seem to ingrow into the NiO grain. The nucleation on preferable crystallographic planes makes the 1Ce10ScSZ – NiO AEI line as discontinuous and terraced. The area bordering to the AEI on the NiO side has a different contrast than the rest of the NiO grain, and contains a few dislocations. The thickness of this area is around 0.5 µm. It might be stated that the 1Ce10ScSZ-tree was ingrowing into the modified part of the NiO grain. Some 1Ce10ScSZ-trunks look as monocrystalline; other trunks are polycrystalline, containing well-visible facetted grains of ~100-300 nm size. Pores between trunks along the line of their AEI as well as other pores and cracks located between trunks and their upper branch / filaments are observed. Some underdeveloped nucleus is observed also on the surface of the NiO grain inside the large pore between two 1Ce10ScSZ trunks. The height of trunks to their branching site is roughly around 0.5-0.7 µm. It is interesting that similar to usual trees, the trunks of ZrO2-trees have also some well-visible thickening
near the NiO "ground", i.e. at their very base.
Schematically, the processes of nucleation and growth of ZrO2 film on the NiO substrate at the EB-PVD process are
[image:15.595.57.298.336.508.2]A B
Figure 11. STEM micrographs of the anode – electrolyte interfaces (AEI) between 1Ce10ScSZ electrolyte film deposited on 8YSZ (A) and NiO (B)
grains of the porous NiO – ZrO2 anode composite with EB-PVD in the state after annealing at 1100 °C [29].
A B
Figure 12. The schemes of the EB-PVD 1Ce10ScSZ structures observed on the 8YSZ (A) and the NiO (B) substrates [29].
The presented data clearly show that vapors of the 1Ce10ScSZ compound (later – just as "zirconia" that also is meaning "cubic zirconia") produced with electron beam evaporation in a EB-PVD process condense on the two solid phases of the three phase substrate (two solid phases are 8YSZ and NiO, the third one is pores) with two different mechanisms of the film nucleation and growth. By other
words, zirconia is depositing and condensing on zirconium and nickel oxides in very different ways.
With respect to the condensation of zirconia on zirconia heated to 700-900 oC (that is around 0.3 to 0.4 of ZrO
2
melting temperature in absolute temperatures) the following conclusions could be drawn:
[image:16.595.87.521.390.645.2]zirconia grains presumably in terms of the Frank – Van der Merwe's "layer by layer" model [39].It might be assumed that these layers are amorphous and have defects, i.e., the deposition of a first zirconia portion occurs as the "amorphous layer on an amorphous substrate" model. During annealing this amorphous defective layer crystallizes and pores are formed (Fig. 11A). The chain of these pores makes the 1Ce10ScSZ – 8YSZ AEI well visible. Pores are observed across the band of 0.3 to 0.5 µm thickness where no other structural features are visible by TEM. Moreover, there is no visible order in the pore arrangement that could indicate any 3D-island growth. The porous band appears to be non-coherent defective material that is not densified fully even during heat treatment at 1100oC. In spite of the non-ideal structure of this porous
band, it is followed by cells / filaments, which can be seen as evidence that the mechanism of film growth was planar and it might be termed as "defective layer by defective layer".
In terms of the condensation developed for solidification of the liquid phase, the planar growth is realized as perfectly pure material, whose purity is ensured by pushing outwards any alloying elements or impurities at the front of the solid-liquid interface (i.e. the phenomena of zone refinement [40]).
The solid-liquid interface moves as a planar surface in a direction opposite to the direction of heat removal pushing impurities ahead its front where they are accumulated afterwards. Eventually, their segregated amount may become critical, i.e. enough for the so-called constitutional supercooling that means literally that the thermal supercooling is reached locally for the portion of liquid, which is enriched by the segregating elements in comparison with the pure liquid.
As result, the growth mechanism will be changed. A few new cells / branches / filaments will be nucleated at the solidification front, which will jump ahead due to quick solidification of the enriched liquid portion. The latent heat of fusion will be released at this moment that will result in some stop of the solidification front and redistribution of a new portion of impurities. The planar growth will be replaced by the cellular one since new nuclei will be created and conditions for solidification are changed chemically, or constitutionally. A superposition of at least three physical phenomena namely the thermal supercooling, the fusion latent heat release and the constitutional supercooling occur. It results in structural and chemical heterogeneity, or laminarity, which is well-visible at the micro level in single crystals, metallic welds [41]and EB-PVD films as we could observe here (Figure 13). It is generally accepted that some technical instabilities are reasons for the laminar growth.
In full analogy with the solidification of the liquid phase, with the condensation of ZrO2 on a monocrystalline zirconia
substrate (locally, within one ZrO2 grain of porous NiO-ZrO2
composite) heated up to 700-900 oC, we indeed see that
zirconia initially condenses according to a planar mechanism and the material grows by "layer by layer" [39] up to about
0.5 µm thickness. The only visible structural feature of the material condensed during this stage is nanosized porosity that is revealed after annealing.
It means that the conditions, which are able to change the EB-PVD film growth mechanism, are reached at the ~0.5 µm film thickness. The planar mechanism is changed by a cellular one. New nuclei are visible. These nuclei transform into cells, which may grow, in our case, as long filaments across all the film thickness. They were nucleated like islands but not on the original ZrO2 substrate (zirconia grain)
but the new zirconia film formed by the planar mechanism on the original zirconia substrate.
Beginning from this point, filaments grow in competition with their neighbors as branches of dendrites. The fact that filaments form as dendrite branches is seen in the flaws between the large bushes of filaments, tips of which have short secondary branches.
In planes of cleavage, broken filaments have spherical nodules on their tips, i.e. they look like heads of matches instead of being facetted that might be at a brittle fracture of zirconia. If this phenomenon could be observed on free surface like in an interbush flaw, these heads could evidence filament growth cessation, accumulation of admixtures, latent heat release and tip melting. But the "match heads" are observed in a dense bush body. In this case, fritted appearance of a broken filament tip may evidence a release of energy localized in nano-sized filament due to limited heat dissipation at its deformation before fracture similar to observed spheroids in metallic glasses [42].
In the course of their growth, the filaments create their own condensation laminarity, a collective picture of which is clearly seen on the polished cross-sections of bulk samples (Figure 9). The filaments bend to the vapor flow in order to grow like plants, which bend and turn to the sunlight in order to ensure their growth. As the filament is growing, conditions favoring supercooling may arise again; as a result, secondary filaments will nucleate on the tips of the primary ones.
So, the moment when the filament bush can be formed is approaching. Nevertheless, it has to be kept in mind, that in the very beginning, the cell-filaments arise perpendicularly to the substrate surface, which may result in the formation of a ‘fan’ around the substrate ZrO2 grain as can be seen in Fig.
11A and sketched in Fig. 12A.
The high nano-porosity formed at the stage of planar growth of the ZrO2 layer on the ZrO2 substrate and observed
in samples annealed at 1100 oC (Fig. 11A) cannot yet be
![Figure 3. The Arrhenius’s dependencies of average grain size of 1Ce10ScSZ ceramics made of three powder types on sintering temperature, Type I; Type II, and Type III [23]](https://thumb-us.123doks.com/thumbv2/123dok_us/8787792.907816/7.595.314.552.112.401/figure-arrhenius-dependencies-average-ceramics-powder-sintering-temperature.webp)
![Figure 4. The Arrhenius’s dependencies of room temperature biaxial strength of 1Ce10ScSZ ceramics made of three powder types on sintering temperature, Type I; Type II, and Type III [23]](https://thumb-us.123doks.com/thumbv2/123dok_us/8787792.907816/8.595.64.295.75.207/figure-arrhenius-dependencies-temperature-strength-ceramics-sintering-temperature.webp)
![Figure 11. STEM micrographs of the anode – electrolyte interfaces (AEI) between 1Ce10ScSZ electrolyte film deposited on 8YSZ (A) and NiO (B) grains of the porous NiO – ZrO2 anode composite with EB-PVD in the state after annealing at 1100 °C [29]](https://thumb-us.123doks.com/thumbv2/123dok_us/8787792.907816/16.595.87.521.390.645/figure-micrographs-electrolyte-interfaces-electrolyte-deposited-composite-annealing.webp)
![Figure 14. SEM pictures of fracture of NiO-8YSZ composite (A) and 1Ce10ScSZ ceramics (B) [29]](https://thumb-us.123doks.com/thumbv2/123dok_us/8787792.907816/19.595.56.300.343.730/figure-sem-pictures-fracture-nio-composite-scsz-ceramics.webp)
