UNCORRECTED
PROOF
12
Identifying exogenous drivers and evolutionary stages in FLOSS projects
3
Karl Beecher
*, Andrea Capiluppi, Cornelia Boldyreff
4Q1 Centre of Research on Open Source Software – CROSS, Department of Computing and Informatics, University of Lincoln, UK
5 7
a r t i c l e
i n f o
8 Article history:
9 Received 11 January 2008
10 Received in revised form 22 October 2008 11 Accepted 24 October 2008
12 Available online xxxx
13 Keywords:
14 Opensourcesoftware 15 Software evolution 16 Software repositories 17
1 8
a b s t r a c t
19 The success of a Free/Libre/Open Source Software (FLOSS) project has been evaluated in the past through
20 the number of commits made to its configuration management system, number of developers and
num-21 ber of users. Most studies, based on a popular FLOSS repository (SourceForge), have concluded that the
22 vast majority of projects are failures.
23 This study’s empirical results confirm and expand conclusions from an earlier and more limited work.
24 Not only do projects from different repositories display different process and product characteristics, but
25 a more general pattern can be observed. Projects may be considered as early inceptors in highly visible
26 repositories, or as established projects within desktop-wide projects, or finally as structured parts of
27 FLOSS distributions. These three possibilities are formalized into a framework of transitions between
28 repositories.
29 The framework developed here provides a wider context in which results from FLOSS repository mining
30 can be more effectively presented. Researchers can draw different conclusions based on the overall
char-31 acteristics studied about an Open Source software project’s potential for success, depending on the
repos-32 itory that they mine. These results also provide guidance to OSS developers when choosing where to host
33 their project and how to distribute it to maximize its evolutionary success.
34 Ó2008 Published by Elsevier Inc.
35 36
37 1. Introduction
38 The environment in which software is deployed is known to
39 have a direct effect on its subsequent evolution. Lehman’s first
40 law of software evolution anticipates that useful real-world
soft-41 ware systems (i.e., E-type) must undergo continuing change in
42 response to various requirements, in other words they must evolve
43 (Lehman et al., 1997). The LAMP stack (Linux, Apache, MySQL, Perl/
44 PHP/Python), the Mozilla Foundation and the BSDs family are
well-45 known examples of open source E-type software systems, and as
46 such are no exception to this rule.
47 The successful evolution of such open source software projects
48 has been made possible (among other factors) also by their
attrac-49 tion of large communities of both users and developers, two
cate-50 gories that notably are not mutually exclusive in open source
51 software. Users initiate the need for change and the developers
52 implement it (Mockus et al., 2002). The extent to which an open
53 source project is successful has often been evaluated empirically
54 by measuringendogenouscharacteristics, such as the amount of
55 developer activity, the number of developers, or the size of the
pro-56 ject (Crowston et al., 2006; Godfrey and Tu, 2000; Robles et al., 57 2003). As an example, a thorough study of Sourceforge.net (a
pop-58 ular repository of more than 200,000 open source projects)
con-59
cluded that the majority of projects housed there should be
60
considered ‘‘tragedies” by virtue of their failure to initiate a steady
61
series of releases (English and Schweik, 2007).
62
The general success of open source software projects has
63
accompanied the wider establishment of organized repositories
64
aiming to facilitate their development and management. In a
pre-65
vious workBeecher(XXXX)the authors examined a collection of
66
open source projects, and studied instead the exogenousdrivers
67
acting upon them and established to what extent the repositories
68
in which a project is located affects its evolutionary characteristics.
69
By comparingequally sizedrandom samples from two open source
70
repositories and also tracking the evolution of projects that moved
71
between them, this earlier study concluded that a repository
typi-72
cally has statistically significant effects upon characteristics such
73
as the number of contributing developers as well as the period
74
and amount of development activity.
75
This work extends and expands the previous study in two ways.
76
First, it encompasses a greater number of repositories; instead of
77
the original two, this paper formulates hypotheses and gathers
78
empirical evidence from data extracted from six different FLOSS
79
repositories, and provides further empirical evidence for the earlier
80
assertions. By making multiple comparisons between them, a
81
structured body of knowledge has been constructed regarding
82
the key practical differences between the individual FLOSS
reposi-83
tories being studied. Secondly, the paper formulates a framework
84
of evolution for FLOSS projects, based on the repository to which
0164-1212/$ - see front matterÓ2008 Published by Elsevier Inc. doi:10.1016/j.jss.2008.10.026
* Corresponding author. Tel.: +44 01522 886858. Q2
E-mail address:[email protected](K. Beecher).
Contents lists available atScienceDirect
The Journal of Systems and Software
j o u r n a l h o m e p a g e : w w w . e l s e v i e r . c o m / l o c a t e / j s s
Soft-UNCORRECTED
PROOF
85 they belong, comprising a typical path of evolution betweenrepos-86 itories, which exploits better process and product characteristics of
87 projects in particular repositories.
88 The paper is articulated as follows: Section2explores previous
89 work and shows how the findings of this paper extend and expand
90 upon past literature on the subject. Section3tailors the
Goal-Ques-91 tion-Metric methodology to this specific case study, and introduces
92 the empirical hypotheses on which this study is based, the null
93 hypotheses and their alternative counterparts, and discusses how
94 they have been operationalized. It also describes which
reposito-95 ries have been selected, how the data has been extracted from
96 them, and which attributes have been used to characterize their
97 process and product aspects. Sections4 and 5illustrate the results
98 gathered, and verifies whether the hypotheses have to be rejected.
99 Section 6provides the discussion for the empirical findings and
100 introduces the framework for the evolution of FLOSS projects along
101 repositories; Section 7 explores the threats to the external and
102 internal validity of this empirical study, while Section8provides
103 the key findings of this research.
104 2. Previous work
105 There are two main types studies found in the FLOSS literature,
106 one termedexternaland the otherinternalto the FLOSS
phenome-107 non (Beecher,XXXX). Based on the availability of FLOSS data, the
108 former has traditionally used FLOSS artefacts in order to propose
109 models (Hindle and German, 2005), test existing or new
frame-110 works (Canfora et al., 2007; Livieri et al., 2007), or build theories
111 (Antoniol et al., 2001) to provide advances in software engineering.
112 The latter includes several other studies that have analyzed the
113 FLOSS phenomenonper se(Capiluppi, 2003; German, 2004; Herraiz 114 et al., 2008; Stamelos et al., 2002) with their results aimed at both
115 building a theory of FLOSS, and characterizing the results and their
116 validity specifically as inherent to this type of software and style of
117 development. In this section a selection of works from the latter
118 category is reviewed.
119 The success and failure of FLOSS projects has been extensively
120 studied in the past; some specific repositories have been analyzed,
121 and metrics have been computed from data extracted from them.
122 Examples include the use of the vitality and popularityindexes,
123 computed by the SourceForge maintainers, which have been used
124 to predict other factors on the same repository (Stewart and 125 Ammeter, 2002), or to compare the status of the projects between
126 two different observations (Feller et al., 2002). Also data has been
127 collected from SourceForge about community size, bug-fixing time
128 and the popularity of projects, and has been used to review some
129 popular measures for success in information systems related to
130 the FLOSS case (Crowston et al., 2003). Popularity of FLOSS projects
131 has also been assessed using web-search engines (Weiss, 2005).
132 Other studies have observed projects from SourceForge, and from
133 their release numbers, their activity or success within a sample
134 (Crowston et al., 2006) has been inferred; while other research
135 has sampled the whole SourceForge data space, and has concluded
136 that the vast majority of FLOSS projects should be considered as
137 failures (Rainer and Gale, 2005). Finally, other researchers have
138 created 5 categories for the overall SourceForge site, based on
dy-139 namic growth attributes, and using the terms ‘‘success” and
‘‘trag-140 edy” within the FLOSS development. Again, it has been shown that
141 some 50% of the FLOSS projects should be considered as tragedies
142 (English and Schweik, 2007).
143 This study is intended as an extension of a previous study to
144 amplify a promising set of findings when comparing the
character-145 istics of two different FLOSS repositories, Debian and SourceForge
146 (Beecher,XXXX). It was found that projects in the Debian
reposi-147 tory consistently achieved larger sizes and more developer activity
148
than their SourceForge counterparts; in addition, it was found that,
149
within the Debian sample, these increased measures could be
ob-150
served typically after the projects were included in the Debian
151
repository. The present study expands the previous data base and
152
results by considering four other repositories (KDE, GNOME,
Ruby-153
Forge and Savannah), extracts similar samples from each of the
154
resulting six repositories (50 projects each from the repository’s
155
‘‘stable” pool), and studies four product and process characteristics
156
of the projects in the samples. Based on these experiments, this
157
study also provides a more general framework for the evolution
158
of FLOSS projects.
159
There are several tools and data sources which are used to
ana-160
lyze FLOSS projects. FLOSSmole1is a single point of access to data
161
gathered from a number of FLOSS repositories (e.g., SourceForge,
162
Freshmeat, Rubyforge). While FLOSSmole provides a simple querying
163
tool, its main function is to act as a source of data for others to
ana-164
lyze. CVSAnaly2is a tool which is used to measure any analyses from 165
large FLOSS projects (Robles et al., 2004). It is used in this paper to
166
determine such measures as the number of commits and developers
167
associated with a particular project.
168
3. Empirical study definition and planning
169
The Goal-Question-Metric method (GQM)Basili et al. (1994) 170
evaluates whether a goal has been reached by associating that goal
171
with questions that explain it from an operational point of view
172
and provide the basis for applying metrics to answer these
ques-173
tions. The aim of the method is to determine the information and
174
metrics needed to be able to draw conclusions on the achievement
175
of the goal.
176
In this study, the GQM method is applied firstly to identify the
177
overall goals of this research; then to formulate a number of
ques-178
tions related to FLOSS repositories and their exogenous (or
exter-179
nal) effects on the underlying process and product characteristics
180
of the FLOSS projects they comprise; and finally to identify and
col-181
lect adequate product and process metrics to determine whether
182
the identified goal has been achieved. In the following, the goal,
183
questions and metrics used are introduced and commented upon.
184
(1) Goal: The long-term objective of this research is to evaluate
185
characteristics and associated metrics to identify successful
186
FLOSS projects, and to investigate whether different
reposi-187
tories can be heldexternallyresponsible for this success. In
188
this particular work, the aim is to establish whether (and if
189
so to what extent) inclusion of a project within a repository
190
causes a project to increase its ‘‘success”, and hence establish
191
a cause-effect relationship. As a corollary goal, this work
192
aims to provide guidelines to FLOSS developers about
prac-193
tical actions to take in order to foster the successful
evolu-194
tion of their applications.
195
(2) Question: The purpose of this study is to establish
differ-196
ences between samples of FLOSS projects extracted from
var-197
ious repositories. Two research questions have been
198
formulated for evaluation; one is thoroughly comparative,
199
and one is related to a formulated framework of reference
200
for FLOSS repositories. The first deals with a direct
compari-201
son; the evolutionary characteristics of the projects have
202
been compared with projects from other repositories. The
203
second clusters the repositories in distinct groups and
formu-204
lates hypotheses based on the effectiveness of each group on
205
the observed characteristics. As a summary, the two main
206
questions underlying this study can be formulated as follows:
1
http://ossmole.sourceforge.net/. 2
http://cvsanaly.tigris.org/.
Soft-UNCORRECTED
PROOF
207 (a) Are the various repositories significantly different208 from each other, in terms of both process and product
209 characteristics?
210 (b) Based on the same characteristics, do repositories
211 cluster in different groups? Are these groups
signifi-212 cantly different from each other, when comparing
213 these characteristics?
214
215 (3) Metrics: This study uses two sources of data to answer the
216 above questions: the repositories themselves, which have
217 been mined to select random samples of projects; and each
218 project’s own repository (either their CVS or SVN) which has
219 been studied to analyze activity and the outputs recorded by
220 the configuration management systems. In each case the
221 metrics have been taken from the project’s source code
222 repository log (CVS or SVN); exceptions and filtering of noise
223 in data has also been performed, as detailed in the following
224 sections. Two types of metrics have been collected
through-225 out this study, and these are detailed below:
226
227 Process metrics number of distinct developers and
devel-228 opers’ effort (in the form of distinct
229 touches);
230
231 Product metrics size achieved in terms of SLOC (sources
232 lines of code) and duration of the effort
233 (number of days of activity observed in
234 either the CVS or SVN repository).
235 236 237
238 3.1. Code repositories
239 This study mines data from six FLOSS repositories (listed below)
240 to address the above questions. In order to achieve a reasonable
241 comparison, in all cases, the samples have been drawn from a pool
242 of ‘‘stable” projects from these repositories described below:
243 (1) The Debian project (http://www.debian.org/) hosts a large
244 number of FLOSS projects under a common name. At the
245 time of writing, more than 20,000 projects are listed under
246 the ‘‘stable” label of the latest version. Projects analyzed in
247 this study must have this label.
248 (2) GNOME (http://gnome.org) is a desktop environment and
249 development platform for the GNU/Linux operating system.
250 Its software repository is organized into more than 600
soft-251 ware programs. Whilst GNOME has no method of explicitly
252 designating projects as ‘‘stable”, projects sampled for this
253 study come only from the main development trunk – other
254 locations such as branches or incubators are not considered.
255 (3) KDE (http://kde.org) is another desktop environment and
256 development platform for the GNU/Linux operating system.
257 Like GNOME, KDE does not explicitly label the development
258 status of projects, so samples are drawn from the main
259 development trunk only.
260 (4) The RubyForge website (http://rubyforge.org) acts as a
261 development management system for over 4,500 projects
262 programmed in the Ruby programming language, 360 of
263 which are labelled as ‘‘Production/Stable”.
264 (5) The Savannah project acts as a central point for the
develop-265 ment of approximately 2850 free software projects (http:// 266 savannah.gnu.org and http://savannah.nongnu.org). The
267 Savannah sample has been drawn exclusively from the set
268 of projects marked ‘‘Production/Stable”.
269 (6) Finally, the SourceForge site (http://sourceforge.net) hosts
270 more than 150,000 projects. The sample from SourceForge
271 has been extracted from only the pool of projects whose core
272
developers have labelled the status of the project with the
273
tag ‘‘Production/Stable”.
274 275
Each repository has a sample of 50 individual projects chosen
276
from it by a randomizer, and a checkout has been performed on
277
each member project of each sample (from either their CVS or
278
SVN source control repositories). The list of analyzed projects is
279
shown inAppendix. Each of these sources has been analyzed to
ob-280
tain the metrics needed to perform the investigation; the measures
281
for the study are introduced in the section below.
282 3.2. Measured characteristics
283
In order to compare these repositories with their different
char-284
acteristics, scope and underlying communities, the following,
com-285
mon characteristics have been measured to build a table of results
286
for each project. Those noted inboldare the actual attributes used
287
in the paper to evaluate and test the empirical hypotheses. The
rel-288
evant definitions and measured characteristics are as follows:
289 Commit: the atomic action of a developer checking in one or
290
more files (being source code or other) into a central repository.
291 Committers: this information has been recorded in two ways:
292
firstly by assigning the activity to the actual developer who
293
placed the file into the repository, and automatically recorded
294
it; and secondly by using any further developers who were
men-295
tioned in the commit, by means of mentioning his/her
involve-296
ment in the coding or patching. This information has been
297
used to characterize the involvement of distinct developers in
298
each project.
299 Modules and subsystems: at a fine granular level, both CVS and
300
SVN repositories record activity on files (here termed as
‘‘mod-301
ules”) and their containing folder (termed ‘‘subsystem”).
302 Date: CVS/SVN repositories record the time when the module
303
and its subsystem was modified or created from scratch,
typi-304
cally in the ISO formatting ‘‘YYYY-MM-DD”. For the purpose of
305
this work, a date in the form ‘‘YYYY-MM” has been recorded,
306
hence this work has analyzed the activity and the involvement
307
of developers on a monthly basis only.
308 Size: the size of the project has been detected from the source
309
code, which is measured in SLOCs. It has been shown in the past
310
that this metric, when used within a sample of FLOSS projects,
311
had similar growth patterns to other metrics related to size,
spe-312
cifically number of files or modules (Herraiz et al., 2006) and
313
number of folders containing source code (Capiluppi et al., 314 2004). Moreover this metric is part of the most widely used
315
techniques in various research fields, for example cost
estima-316
tion (Boehm et al., 2000). Although several criticisms were
317
raised in the past, it is possible to postulate that it is a viable
318
approach for measuring size of a software system. Alternative
319
measures to SLOCs such as function points are also affected by
320
problems and weaknesses, given their strong theoretical support
321
based on Halstead’s software science (Hamer and Frewin, 1982; 322 Shen et al., 1983).
323 Duration: the age of the project is measured by number of days
324
over which the project has been developed. This has been
eval-325
uated using the earliest and the latest available dates in the CVS/
326
SVN repositories. This measurement shows thetime-spanover
327
which FLOSS developers adopted a Software Configuration
Man-328
agement server in order to enable distributed development to be
329
properly performed.
330 Distinct touches: since many modules and subsystems can be
331
committed in the repository within the same commit, and the
332
same module could have been modified by more than one
devel-333
oper in the same commit, the term ‘‘touch” has been used to
iso-334
Soft-UNCORRECTED
PROOF
335 and unique union on module and subsystem. As an example, if a336 project obtains 200 commits in a given month, but those apply
337 to the unions {subsystemA/moduleA,e.g.100 commits},
{sub-338 systemB/moduleB,e.g.80 commits} and {subsystemC/moduleC,
339 e.g.20 commits}, the activity recorded for that specific month is
340 only 3. This information is gained automatically by parsing the
341 CVS/SVN log for the project (seeFig. 1); in this case, the
commit-342 ter (yakk) is held responsible for the effort together with the
343 author of the patch ([email protected]).
344 Distinct developers: information on distinct contributing
devel-345 opers is obtained by analyzing commit logs (see the sample in
346 Fig. 1). Every touch has an committer ID attached to it and this
347 is recorded. The information is then filtered through a ‘‘distinct”
348 clause: specifically, the number of unique developers per month
349 is recorded, in order to record the real involvement of
develop-350351 ers and to avoid cumulative effects.
352
353 3.3. Distribution of data in the repositories
354
The distributions of the projects within the samples are
repre-355
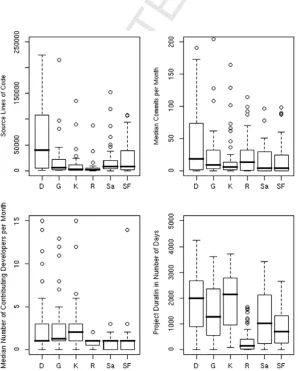
sented in boxplots (Tukey, 1977) inFig. 2. Both the distributions
356
of SLOCs and Project Duration (top left and top right, respectively)
357
are composed of one measurement per project per repository: the
358
SLOCs at the time of extraction (October 2007) and the length (in
359
days) of the configuration management logs retrieved respectively
360
for each project. The other two boxplots represent a measure of the
361
activity, in terms of distinct commits, and the involvement of
dis-362
tinct developers (bottom left and bottom right, respectively). Since
363
nearly all the projects in each sample span several months, a single
364
value in each case (i.e.the median) has been recorded, per project
365
and per repository, to summarize the evolution of these attributes.
366
As is visible inFig. 2, the sample from the Debian repository
ap-367
pears to achieve the largest sizes in SLOCs, with several outliers
'
'
[image:4.595.143.442.369.741.2]Fig. 1.Excerpt from a sample SVN log file showing one commit that touches two files.
Fig. 2.Boxplots of the four attributes under investigation for (D)ebian, (G)NOME, (K)DE, (R)ubyForge, (Sa)vannah and SourceForge (SF).
Soft-UNCORRECTED
PROOF
368 skewing its distribution (median: 39,590 SLOCs). The samples from369 the other repositories, excluding the outliers, appear comparable
370 with one another, in terms of medians. In contrast, observing the
371 three distributions of duration, commits and developers, a first
372 group (Debian, KDE and GNOME) appears as achieving consistently
373 larger values than a second group (RubyForge, Savannah and
374 SourceForge). This is especially true for the number of distinct
375 developers per month, which is typically capped by at most ‘‘one
376 developer” in the second group; and for the activity of monthly
377 commits, which has a larger variance in the first group.
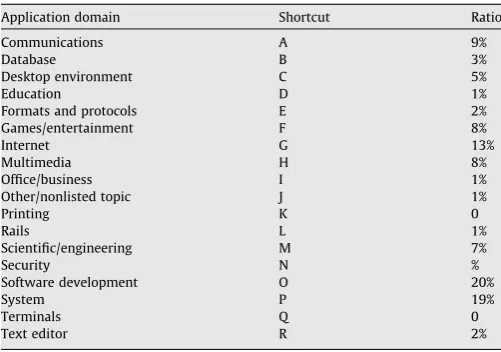
378 The application domains of the six samples has also been
stud-379 ied.Table 1summarizes the domains as collected for every project
380 composing all the samples, and shows the relative percentage of
381 each domain of the sample. These domains are those used within
382 SourceForge site to effectively cluster the FLOSS projects. As visible,
383 the back-end applications (‘‘System” and ‘‘Software Development”)
384 together form some 40% of all the topics.Appendix,details the
do-385 mains for each sample. Several different domains are detected also
386 in KDE and GNOME, although one would expect that most of their
387Q3 projects to fall into a ‘‘Desktop Environment”category (seeTable 2).
388 The initial observation of these distributions has led to the
for-389 mulation of the following research questions:
390 Is it true that all the repositories produce similar results in terms
391 of the process and product characteristics studied?
392 Is it possible to group repositories into categories that achieve
393 statistically different results?
394
395 In the following Section4, the first of these questions will be
396 analyzed statistically, by comparing each distribution with the
oth-397 ers on the four presented characteristics.
398 3.4. Statistical Tests
399 Each data set is compared to another using the unpaired
Wilco-400 xon test. The critical information of this test is as follows:
401 Itspurposeis to test whether or not the two samples are from
402
different probability distributions.
403 Itassumesthat the probability distribution is non-parametric,
404
and that the two samples are independent.
405 406
The resultant value (thep-value)informs of the probability that
407
random sampling of two populations would lead to a difference
408
between the sample means as large (or larger) than that observed
409
in the samples. By convention 0.05 or less is the desiredp-value.
410
4. Results:research question1 –hypotheses
411
The further research to answer the first question has been
de-412
signed as a direct comparison between the six samples of stable
413
projects extracted from the repositories, and its objective is to
414
highlight any significant difference based on the chosen
character-415
istics. Four hypotheses have been formulated and evaluated
empir-416
ically. Given the null hypothesis and the alternative hypotheses in
417
the second and third columns ofTable 3, a statistical test ( Wilco-418 xon, 1945) will allow the null hypothesis to be either rejected or
419
confirmed. The threshold for the significance of thep-valueswill
420
be modified with the Bonferroni correction (Cabin and Mitchell, 421 2000); although this approach has suffered from criticisms in the
422
past (Perneger, 1998), it is relevant here because multiple tests
423
are being carried out. The R programming language has been used
424
to carry out these tests based on evaluation of the data extracted
425
earlier from the respective repositoriesDalgaard, 2002. A summary
426
of the tests and their results will be provided at the end of this
sec-427
tion to draw together the relevant conclusions. Each hypothesis is
428
briefly introduced in the following:
429 Hypothesis 1.1 – Sizeachieved: The first hypothesis postulates
430
that the typical size of a project differs significantly for each
431
repository, in terms of SLOC, with the null hypothesis stating
432
that all the repositories have similar project sizes, to be rejected
433
if project sizes are shown to be significantly different.
434 Hypothesis 1.2 – Activity (touches): The second hypothesis for
435
question 1 postulates that the amount of observed activity (or
436
output) differs among repositories. Specifically, the null
hypoth-437
esis states that, on average, individual projects in one repository
438
will have a number of distinct touches that does not differ
signif-439
icantly from that found among the others. This may be rejected
440
if it is shown that specific repositories tend to have significantly
441
[image:5.595.42.293.471.647.2]more active projects than others.
Table 1
Summary of the application domains. The shortcut is also used inAppendix.
Application domain Shortcut Ratio
Communications A 9%
Database B 3%
Desktop environment C 5%
Education D 1%
Formats and protocols E 2%
Games/entertainment F 8%
Internet G 13%
Multimedia H 8%
Office/business I 1%
Other/nonlisted topic J 1%
Printing K 0
Rails L 1%
Scientific/engineering M 7%
Security N %
Software development O 20%
System P 19%
Terminals Q 0
Text editor R 2%
Table 2
Summary of statistical tests used and their purpose per hypothesis. Statistical test What the test establishes Hypothesis 1 Bi-directional unpaired
Wilcoxon
If the two samples are from different probability distributions
Hypothesis 2 One-directional unpaired Wilcoxon
If one sample is from a probability distribution that differs from another in a specified direction
Table 3
Summary of the hypotheses, tests and metrics. Hypothesis 1.1: distribution of size – Test T1.1 H1.1 (null): Projects from all
repositories have a similar size
H1.1 (alternative): Projects from repositories have different sizes
SLOCs
Hypothesis 1.2: overall touches – Test T1.2 H1.2 (null): Projects from all
repositories have a similar amount of touches
H2.1: Projects from repositories have significantly more or fewer touches
Distinct touches
Hypothesis 1.3: distinct developers – Test T1.3 H1.3 (null): Projects from all
repositories have a similar amount of developers
H1.3 (alternative): Projects from repositories have significantly more or fewer developers
Distinct committers
Hypothesis 1.4: days of evolution – Test T1.4 H1.4 (null): All projects have
similar time-spans
H1.4 (alternative): Projects from repositories have significantly longer or shorter time-spans
Days
Statistical test used: bi-directional unpaired Wilcoxon test, tolerance 5%
Soft-UNCORRECTED
PROOF
442 Hypothesis 1.3 – Developers:This hypothesis posits that thenum-443 ber of distinct developers that work on a project monthly is, on
444 average, significantly different for each repository, measured
445 according to the number of distinct developers who have
con-446 tributed source code. The null hypothesis states that all the
pro-447 jects have approximately an equal number of contributing
448 developers, to be rejected if this is not the case.
449 Hypothesis 1.4 – Period ofactivity: The final hypothesis posits
450 that the duration of time that projects from each repository have
451 been evolved over differs significantly, measured by the number
452 of days for which activity could be observed on a project’s
repos-453 itory. In statistical terms, the null hypothesis underlies the
pre-454 sumption that FLOSS projects come from different populations;
455 based on their original repository, they have a different
time-456 span. The null hypothesis should be rejected if the sample
pro-457 jects display significant differences between repositories.
458
459 4.1. Results of thetests–research question1
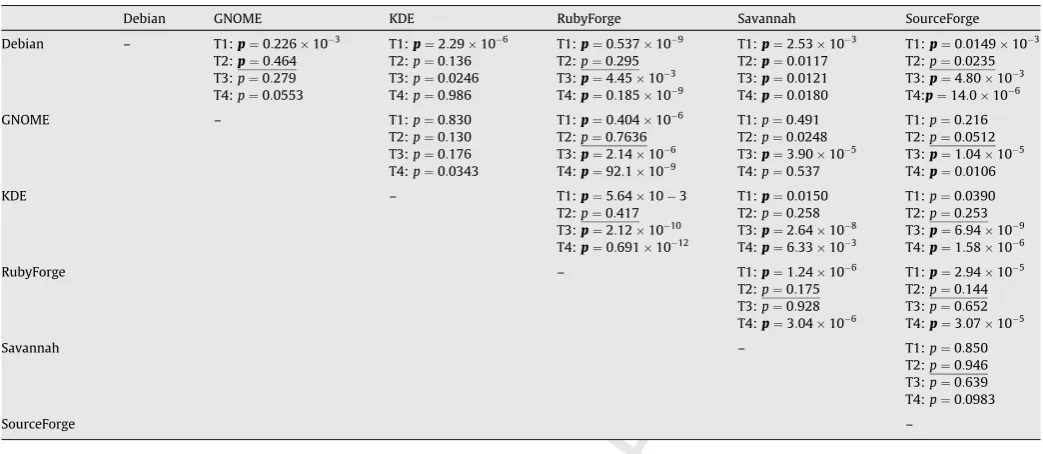
460 The empirical evaluation of the first research question has led to
461 a total of 15 direct comparisons among the 6 repositories, and has
462 been based on the 4 hypotheses expounded above. The results of
463 the tests are reported inTable 4where each comparison between
464 two repositories is displayed along with the test name(T1–T4)and
465 a report of thep-valuefrom the Unpaired Wilcoxon TestWilcoxon, 466 1945. Since the stringent difference between two repositories is
467 being tested, a two-sided test has been performed in all cases;
468 the Bonferroni correction has been applied giving a significance
469 threshold ofp-value60:01.Bold figures denotep-valuesthat are
470
lower than (or extremely close to) this threshold; underlined
fig-471
ures denotep-valuesthat are higher than this threshold, but
corre-472
spond with a large Cohen’s Effect Size(seeTable 5).
473
The following observations have been made, based on the direct
474
comparisons amongrepositories: (seeTable 6)
475
(1) Size achieved:Table 4clearly shows significant differences
476
between repositories based on their project sizes.
Observa-477
tions are as follows:
478 Debian differs significantly from all other repositories;
479 GNOME and KDE do not differ – both repositories’ results
480
are mixed when compared to others;
481 Savannah does not differ from SourceForge, whereas
482
RubyForge differs from them both.
483 484
(2) Commits:After performing corrections on thep-values,no
485
repositories indicate significantly different levels of activity
486
from each other. The results also suggest that RubyForge
487
activity is comparable to that of all other repositories (with
488
the exception of KDE). However it can be seen inFig. 2that
489
RubyForge projects have a significantly shorter life than
490
those found in all other repositories, which increases their
491
perceived rate of activity. Hence the perceived rate of
activ-492
ity of RubyForge projects should be treated with suspicion.
493
(3) Committers:Table 4allows the following observations to be
494
made about the number of contributing developers to each
495
repository:
496 Debian does not differ significantly from GNOME and
497
KDE, but thep-valuesare borderline when compared to
498
[image:6.595.32.554.84.311.2]RubyForge and SourceForge;
Table 4
Results – question 1. T1 = SLOCs, T2 = commits, T3 = committers, T4 = days. Underlined entries have a non-significantp-value, but a large Cohen’s Effect Size.
Debian GNOME KDE RubyForge Savannah SourceForge
Debian – T1:p¼0:226103
T1:p¼2:29106
T1:p¼0:537109
T1:p¼2:53103
T1:p¼0:0149103 T2:p¼0:464 T2:p¼0:136 T2:p¼0:295 T2:p¼0:0117 T2:p¼0:0235 T3:p¼0:279 T3:p¼0:0246 T3:p¼4:45103 T3:p
¼0:0121 T3:p¼4:80103 T4:p¼0:0553 T4:p¼0:986 T4:p¼0:185109 T4:p
¼0:0180 T4:p¼14:0106
GNOME – T1:p¼0:830 T1:p¼0:404106 T1:p¼0:491 T1:p¼0:216
T2:p¼0:130 T2:p¼0:7636 T2:p¼0:0248 T2:p¼0:0512 T3:p¼0:176 T3:p¼2:14106 T3:p
¼3:90105 T3:p
¼1:04105 T4:p¼0:0343 T4:p¼92:1109 T4:p
¼0:537 T4:p¼0:0106
KDE – T1:p¼5:64103 T1:p¼0:0150 T1:p¼0:0390
T2:p¼0:417 T2:p¼0:258 T2:p¼0:253 T3:p¼2:121010 T3:p
¼2:64108 T3:p
¼6:94109 T4:p¼0:6911012 T4:p
¼6:33103 T4:p
¼1:58106
RubyForge – T1:p¼1:24106 T1:p¼2:94105
T2:p¼0:175 T2:p¼0:144 T3:p¼0:928 T3:p¼0:652 T4:p¼3:04106 T4:p
¼3:07105
Savannah – T1:p¼0:850
T2:p¼0:946 T3:p¼0:639 T4:p¼0:0983
SourceForge –
Table 5
Summary of Cohen’s effect size – (SLOCs; commits; committers; days)
Debian GNOME KDE RubyForge Savanah SourceForge
Debian – (0.59; 0.41; 0.06; 0.37) (0.65; 0.08; 0; 0.52) (0.71; 1.82; 0.85; 0.43) (0.25; 0.43; 0.77; 0.04) (0.49; 1.12; 0.59; 0.55) GNOME – (0.24; 0.34; 0.07; 0.29) (0.56; 1.36; 1.05; 0.07) (0.25; 0.04; 0.92; 0.18) (0.24; 0.66; 0.65; 0.33)
KDE – (0.34; 1.82; 1.24; 0.26) (0.32; 0.37; 1.09; 0.26) (0.46; 1.08; 0.77; 0.02)
RubyForge – (0.38; 1.21; 0.14; 0.2) (0.71; 0.84; 0.19; 0.3)
Savanah – (0.2; 0.88; 0.72; 0.1)
SourceForge –
[image:6.595.29.554.683.759.2]Soft-UNCORRECTED
PROOF
499 GNOME and KDE do not differ significantly from each500 other, but they both show a significant difference from
501 RubyForge, Savannah and SourceForge;
502 RubyForge, Savannah and SourceForge do not differ from
503 one another.
504
505 (4) Duration:InTable 4the absence of significant differences
506 between repositories suggests:
507
508
509 Debian and KDE have a significantly different average
510 project age from RubyForge and SourceForge;
511 GNOME has a significantly different project age from
512 RubyForge;
513 Savannah does not differ from SourceForge.
514
515 In summary, a significant difference has been identified
be-516 tween the characteristics of the repositories, dividing them firmly
517 into two groups:
518 Group 1: Debian, GNOME and KDE (with GNOME and KDE
dis-519 playing very notable similarities);
520 Group 2: RubyForge, Savannah and SourceForge (with Savannah
521 and SourceForge displaying very notable similarities).
522
523 5. Results:research question2 –hypotheses
524 The first research question has been designed as a comparison
525 between all repositories, and its objective is to highlight any
signif-526 icant differences between them. Having established these
differ-527 ences the second question is designed to establish their direction
528
and hence the supremacy of one repository over any other with
re-529
gards to the characteristics under study.
530
In each hypothesis it has been posited that the repositories in
531
group 1 (labelled in Section4.1) have a superior value to those of
532
group 2.
533 Hypothesis 2.1 – Period ofactivity: This hypothesis posits that
534
projects from group 1 (Debian, GNOME and KDE) have been
535
developed for greater periods of time than group 2 (RubyForge,
536
Savannah and SourceForge), and hence possess a significantly
537
longer duration of activity.
538 Hypothesis 2.2 – Sizeachieved:This hypothesis postulates that
539
the group 1 projects are typically larger than their group 2
coun-540
terparts and hence have significantly larger SLOCs.
541 Hypothesis 2.3 – Developers:This hypothesis posits that the
pro-542
jects from Debian, GNOME and KDE are more successful at
543
attracting developers than projects from RubyForge, Savannah
544
and SourceForge. They should therefore show evidence of a
sig-545
nificantly greater number of developers.
546 Hypothesis 2.4 – Activity(touches):The final hypothesis
postu-547
lates that group 1 projects typically receive more development
548
effort than those of group 2, evidenced by a significantly larger
549
rate of touches.
550
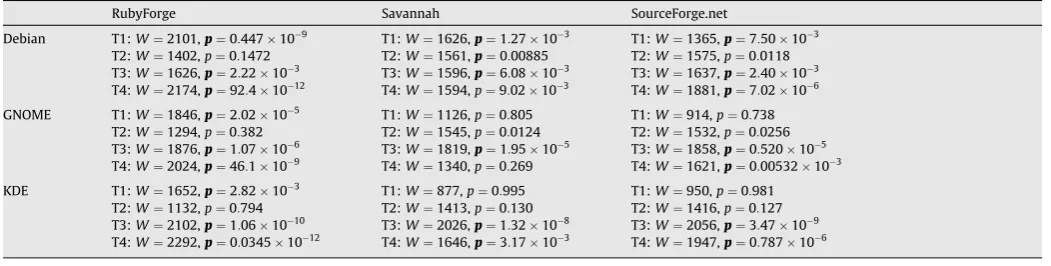
Each repository has been compared to each counterpart repository
551
of the opposing group. With three repositories in each group this
552
has resulted in nine such comparisons. In each such comparison
553
it has been hypothesized that there is a significant difference in a
554
specified direction, which has been estimated by inspecting the
555
boxplot for the relevant attribute (Fig. 2). The results of the tests
556
are summarized inTable 7. As in Section4.1, each comparison is
557
[image:7.595.42.565.86.213.2]displayed by test name (T1–T4) showing the resulting p-value
Table 6
Summary of the hypotheses, tests and metrics Hypothesis 2.1: distribution of size – Test T2.1
H2.1 (null): Projects from the two groups have similar size H2.1 (alternative): Projects from the first group have larger sizes SLOCs Hypothesis 2.2: overall touches – Test T2.2
H2.2 (null): Projects from the two groups have a similar amount of touches
H2.2: Projects from the first group have significantly more touches Distinct touches
Hypothesis 2.3: distinct developers – Test T2.3
H2.3 (null): Projects from all the two groups have a similar amount of developers
H2.3 (alternative): Projects from the first group have significantly more developers
Distinct committers Hypothesis 2.4: days of evolution – Test T2.4
H2.4 (null): Projects from the two groups have similar time-spans H2.4 (alternative): Projects from the first group have significantly longer time-spans
Days
Statistical test used: one-directional unpaired Wilcoxon test, tolerance 5%
Table 7
Results – question 2. T1 = SLOCs, T2 = commits, T3 = committers, T4 = days
RubyForge Savannah SourceForge.net
Debian T1:W¼2101,p¼0:447109 T1:W¼1626,p¼1:27103 T1:W¼1365,p¼7:50103 T2:W¼1402,p¼0:1472 T2:W¼1561,p¼0:00885 T2:W¼1575,p¼0:0118 T3:W¼1626,p¼2:22103
T3:W¼1596,p¼6:08103
T3:W¼1637,p¼2:40103 T4:W¼2174,p¼92:41012 T4:W
¼1594,p¼9:02103 T4:W
¼1881,p¼7:02106 GNOME T1:W¼1846,p¼2:02105 T1:W¼1126,p¼0:805 T1:W¼914,p¼0:738
T2:W¼1294,p¼0:382 T2:W¼1545,p¼0:0124 T2:W¼1532,p¼0:0256 T3:W¼1876,p¼1:07106
T3:W¼1819,p¼1:95105
T3:W¼1858,p¼0:520105 T4:W¼2024,p¼46:1109 T4:W
¼1340,p¼0:269 T4:W¼1621,p¼0:00532103 KDE T1:W¼1652,p¼2:82103 T1:W¼877,p¼0:995 T1:W¼950,p¼0:981
T2:W¼1132,p¼0:794 T2:W¼1413,p¼0:130 T2:W¼1416,p¼0:127 T3:W¼2102,p¼1:061010
T3:W¼2026,p¼1:32108
T3:W¼2056,p¼3:47109 T4:W¼2292,p¼0:03451012
T4:W¼1646,p¼3:17103
T4:W¼1947,p¼0:787106
[image:7.595.41.567.624.757.2]Soft-UNCORRECTED
PROOF
558 obtained from a one-sided unpaired Wilcoxon test; the Bonferroni559 correction has been applied giving a significance threshold of
560 p60:0083.
561 5.1. Results of thetests–research question2
562 The following observations can be made in this case:
563 Activity:the directional Wilcoxon tests (Table 7) show that the
564 median commits per month is the only indicator that does not
565 display any significant differences, although on average Debian,
566 GNOME and KDE all have greater average commit rates
567 (between 5 and 18) than Savannah and SourceForge (around 4
568 commits per month each). Recall that RubyForge commit rates
569 are suspected of being artificially high.
570 Sizeachieved: the directional Wilcoxon test (seeTable 7)
con-571 firms that KDE and GNOME projects are smaller on average than
572 Savannah and SourceForge projects. Debian contains the largest
573 projects of all repositories under study.
574 Number ofdevelopers: the directional Wilcoxon tests (Table 7)
575 show that there is a divide between Debian, GNOME and KDE
576 as one group, and RubyForge, Savannah and SourceForge as
577 another. The former group have between 20 and 32 projects with
578 a number of contributors exceeding one, whereas the
Source-579 forge sample (the best performing for this indicator in the latter
580 group) had only 6 projects with more than one contributor.
581 Projectduration: the directional Wilcoxon tests again shows a
582 clear divide between Debian, GNOME and KDE which
consis-583 tently have olderprojectsand RubyForge, Savannah and
Source-584585 Forge (which consistently have younger projects).
586
587 6. Discussion –a frameworkfortransitionsof FLOSSprojects
588 The empirical evidence gathered by analyzing data to answer
589 the two research questions above shows a significant divide
be-590 tween one group (Debian, KDE and GNOME) and a second group
591 of repositories (RubyForge, Savannah and SourceForge). In previous
592 works, those of the first group have already been characterized.
593 The Debian repository has been extensively studied, and its
inter-594 nal product and process characteristics have been described in
595 terms of a successful product Michlmayr and Senyard, 2006, 596 2007. Also KDE and GNOME have been evaluated as successful
597 repositories, based on the characterization of their development
598
processes and recruitment rates Hemetsberger and Reinhardt 599 (2004) and Koch et al. (2002)respectively.
600
As already reported above, an earlier work highlighted the
dif-601
ferences between SourceForge and Debian (Beecher,XXXX). These
602
were not only statistically significant, but also directional (Debian
603
achieves better results than SourceForge). Investigating further, it
604
was also found that a subset of projects had transited from
Source-605
Forge to Debian. In these cases, the projects being incorporated
606
into Debian from SourceForge achieved, from that point in time
607
on, an improvement in the overall activity and an increased
num-608
ber of developers.
609 6.1. Transitionframework–typesofrepositories
610
The earlier results and the differences between the two groups
611
outlined in this work are here contextualized by a wider
frame-612
work of evolution developed as part of this research, visualized
613
here inFig. 3. The terms used within the framework formulation
614
are as follows:
615
(a) Open Forge – the term is applied to those FLOSS repositories
616
with a low barrier to entry: RubyForge, Savannah and
617
SourceForge all guarantee any FLOSS developer the
availabil-618
ity of web-space and management tools (e.g. CVS, forums) to
619
host a software project (see lower part ofFig. 3).
620
(b) Controlled Forge – this term is instead used for those
repos-621
itories which apply various filters and guidelines to newly
622
joining projects (top part ofFig. 3). Debian, KDE and GNOME
623
clearly have underlying rules, standards and specific tools
624
for developers to adhere to or to adopt when joining. Debian
625
accepts a new project only after an advocate from within
626
Debian issues a request to include it (Laat and Paul, 2007).
627
KDE requests new developers to adhere to programming
628
standards, and to comply with an existing C++ code-base
629
(Kuniavsky and Raghavan, 2005). Finally, GNOME requests
630
the knowledge of the basic GTK graphical platform, and its
631
Application Programming Interfaces (API) (German, 2004).
632
Within this group, the nature of the repository and the
633
empirical results showed the following distinction between
634
two subgroups:
635
(b.1) Distributions: Debian should be considered a
distribu-636
tion, since the FLOSS projects it hosts are all part of a
637
larger Linux operating system. From the point of view
Fig. 3.Framework of progression for FLOSS projects through various types of repositories.
Soft-UNCORRECTED
PROOF
638 of the process, Debian developers are not typically639 programming for other Debian projects.
640 (b.2) Meta-Projects: KDE and GNOME should be instead
641 considered as meta-projects because the projects they
642 contain are subsystems of a wider system (the KDE
643 and GNOME desktop environments, respectively),
644 and developers work on several glue projects.
645 The main difference between distributions and meta-projects is
646 in the higher acceptance threshold of the former. As already
men-647 tioned, a software project becomes part of a distribution only
648 under specific conditions, such as, for instance, the Debian
advo-649 cates with new FLOSS projects (Laat and Paul, 2007).
650 651
652 6.2. Transitionframework–typesoftransitions
653 The transitions among the repositories are noted with two types
654 of arrows:
655 – Asper thebold arrowofFig. 3, the study reported above ( Bee-656 cher,XXXX) empirically showed not only how a subset of
pro-657 jects transited from an Open Forge (SourceForge) into a
658 Controlled Forge (Debian). It also showed that this transition
659 had an effect on the two selected aspects of product and process;
660 the transited projects were shown to have benefited from more
661 developers and displayed an increased activity. FLOSS projects
662 within the KDE and GNOME repositories have an easier entry
663 point within Debian, since the distribution typically ships both
664 the two meta-projects; for this reason, also this transition is
665 depicted as a bold line. Projects belonging to ‘‘open repositories”
666 have a less straight-forward entry-level into major distributions;
667 at least one Debian developer has to act as an ‘‘advocate”, or
668 ‘‘sponsor” for its introduction within the distribution, otherwise
669 it will be considered as‘‘non-interesting”.3
670 – Thedashed linesdepicted inFig. 3represent instead proposed
671 transitions between repositories; projects have been observed
672 to migrate along the dashed lines, but no empirical study on
673 the benefits of these transitions has been performed in this
674 research. Among the sample from SourceForge, for instance, it
675 is possible already to detect projects which transited to a
676 meta-project (e.g., thekpictorialproject is also included in the
677 KDE repository,Appendix). A transition from a meta-project to
678 a distribution has also been observed; a subset of projects have
679 been observed transiting between the KDE meta-project to the
680 Debian distribution (e.g., the ark from the KDE repository,
681 Appendix). As also stated in (Michlmayr, 2007), one of the
682 advantages of being part of a larger distribution consist of
hav-683 ing a more pressing schedule due to the release management.
684 Open Forges do not use a formal way of imposing schedule
con-685 straints and deadlines; controlled Forges typically do, thus
plac-686 ing an heavier burden on the developers and requiring higher
687 productivity within the contained projects.
688
689 6.3. Transition Framework –discussion
690 Regarding the general goal stated in Section 3, this research
691 shows that a general framework relating differenttypesof FLOSS
692 repositories provides a better context to describe the variety of
re-693 sults (in terms of success) of the average FLOSS project. This
frame-694 work establishes the possible routes that may be taken to achieve
695 these results and their relative benefits and challenges.
696
The corollary of this objective, also stated above, is that useful
697
findings and practical actions could be extrapolated for the use of
698
developers and practitioners. As shown in (Capiluppi and Michlm-699 ayr, 2007) both of the so-called ‘‘cathedral” and ‘‘bazaar” modes of
700
operation can co-exist within FLOSS; projects begin in a cathedral
701
mode and may, if they wish, change later to a bazaar mode and
702
thereby increase visibility, activity and size. Fig. 4, taken from
703
(Capiluppi and Michlmayr, 2007), summarizes that FLOSS projects
704
can just achieve one state (the ‘‘cathedral”, left part of figure),
705
while in the life cycle of other projects, the ‘‘bazaar” state can
fol-706
low the cathedral phase, thus achieving an increased effort and
707
greater output. Building on this earlier result, we can claim that
708
some forges (SourceForge, RubyForge, Savannah) on average host
709
projects mostly in their cathedral phase; if developers wish to
up-710
grade the status of their project, and exploit the advantages of the
711
wider FLOSS communities, they should consider being included
712
into a meta-project or a distribution repository. This, however, is
713
not a mandatory move; and making such a transition may require
714
the project to alter their working practices and follow a more
man-715
aged release strategy.
716
7. Threats to thevalidityof this study
717
The following aspects have been identified which could lead to
718
threats to validity of the present empirical study; they have been
719
grouped into threats to construct, internal and external validity
720
as follows.
721 Construct validity (relationship between theory and
observa-722 tion)Missing historical data –thestudy has been able to make
723
use only of available data. It is possible, for example, that the
724
project initialization pre-dates the first measurable piece of
his-725
torical data and is therefore beyond the reach of our analysis.
726 Internal validity (confounding factors can influence the findings)
727
(1) Status of the projects –asindicated, all projects studied
728
are chosen for being ‘‘stable”, in order to counter the
prob-729
lems of comparing projects at differing stages of
evolu-730
tion. However the lesser threat remains that the projects
731
studied are at differing stages of evolution because the
732
definition of ‘‘stable” varies across the repositories and
733
is somewhat subjective.
734
(2) Outliers –avery small number of outliers were
discov-735
ered within the data, and were subsequently excluded
736
from the analysis. Specifically the following have been
737
excluded:
738 Size:asingle extreme outlier was identified in each of
739
the Debian and Savannah samples.
740 Activity: a single outlier was identified in the Savannah
741
sample. Upon investigation, it appeared that an
exist-742
ing project with a long history had been imported all
743
at once and was then never worked upon again. Since
744
the addition of each file constitutes a commit, the
aver-745
age of commits per month was artificially large.
746 747 748 749 External validity (how results can be generalized)
750 751 752
(1) Union of sets –thepermissive nature of FLOSS development
753
means that it is possible, even encouraged, for individual
754
projects, or parts of them, to be included in more than one
755
repository. Hence, when randomly sampling projects from
756
individual repositories, it is possible that a sampled project
757
may be found in another location and that its evolution is
758
also influenced by this unknown repository. The assumption
759
is therefore made that any such confounding effect, if
pres-760
ent, is negligible.
3 The specific Debian process to become a developer, or how to include a new project within the distribution is detailed underhttp://people.debian.org/mpalmer/ debian-mentors_FAQ.html.
Soft-UNCORRECTED
PROOF
761 (2) Size of the populations –perhapsthe most variablecharac-762 teristic of the repositories was the number of available
pro-763 jects. To promote the fairness with which projects could be
764 compared we endeavoured to select ones considered
‘‘sta-765 ble”. Consequently the number of projects available ranged
766 from approximately 400 (in the case of RubyForge) up to
767 the order of 20,000 (for SourceForge). The static sample size
768 of 50 resulted in each sample being not necessarily
propor-769 tionate to all others.
770 (3) Further generalization –foreach repository type proposed
771 within this work, it has been represented by a small number
772 of repositories (between one and three). This approach holds
773 the risk that results may be biased by any peculiarities of
774 individual repositories. However, this study is relative easily
775 replicable on other repositories of the types identified. For
776 example, other meta-projects exist with development
777 emphasis on other domains not covered in this study, such
778 as Mozilla or Apache.
779
780 8. Conclusions andfuture works
781 This study has been carried out as an extension of previous
re-782 search (Beecher,XXXX), aiming to amplify a promising set of
find-783 ings obtained when comparing the characteristics of two different
784 FLOSS repositories, Debian and SourceForge. The present study
ex-785 panded the previous data base with four other repositories,
ex-786 tracted similar samples from each of the resulting six
787 repositories (50 projects each from the repository’s ‘‘stable” pool),
788 and studied four product and process characteristics of the projects
789 in the samples.
790 Testing whether similar results can be obtained by researchers
791 when studying any FLOSS repository, it was found that not only do
792 repositories differ from each other in terms of product or process
793 characteristics (or both); but also that two groups showed
signifi-794 cant differences between them. A first group (Debian, KDE and
De-795 bian) showed consistently different characteristics in comparison
796 with a second group (RubyForge, Savannah and SourceForge).
La-797 ter, it was also shown that two repositories (Debian and KDE) in
798 the first group achieve significantly better results than those in
799 the second group.
800 Combining the two above findings, a framework for the
evolu-801 tion of FLOSS repositories has been proposed. RubyForge,
Source-802 Forge and Savannah do not pose any barriers to entry to software
803 projects (although RubyForge projects are generally expected to
804 be related to the Ruby programming language) and named ‘‘open
805 forges”. On the other hand, repositories such as Debian (‘‘controlled
806 forges”) set up a higher threshold to admittance, typically by
intro-807 ducing new projects in a stricter, controlled way. Among these,
808 both full distributions such as Debian, and meta-projects, such as
809
KDE or GNOME, offer the potential of a wider spectrum of
develop-810
ers and increased activity.
811
Transitions were also studied: FLOSS projects transiting from an
812
‘‘open forge” to a ‘‘controlled forge”, will be able to exploit the
ben-813
efits of a larger audience of users and developers, and become, on
814
average, also larger projects. The transition between a
‘‘meta-pro-815
ject” to a ‘‘distribution” has also been postulated as a further
ad-816
vance in the evolution of a FLOSS project; however, from the KDE
817
and GNOME samples, it was not possible to observe any cases
818
where a project was introduced in the Debian distribution, in order
819
to evaluate the effects of the Debiantreatment.
820
The presented work has two main research strands which we
821
propose to consider further in our future work. The first is to
822
introduce other repositories (or forges) into the quantitative
823
study, in order to achieve an improved understanding of the
dis-824
tribution of FLOSS projects within repositories. Major repositories
825
such as Tigris4 or FreshMeat5 could be analyzed, following the 826
same approach, characteristics and hypotheses used above. Given
827
their policies, which make these two more similar to SourceForge
828
than Debian, the framework as proposed in Section6would place
829
them into the ‘‘Open Forges” category. A research hypothesis would
830
then be used to test whether these two repositories achieve (on
831
average) worse results than KDE, GNOME or Debian. Other,
special-832
ized forges such as OW26could be also analyzed; given its policy of
833
semi-openness, our framework would place it under the ‘‘Controlled
834
Forges”, hence (in theory) achieving better results than an open
835
forge.
836
The second research strand yet to be pursued is a closer,
quan-837
titative, investigation of the transitions as proposed in the
frame-838
work; we propose to conduct an observational study where a
839
known subset of projects from either KDE or GNOME, which have
840
been introduced at some stage in the Debian distribution, is
stud-841
ied both before and after their introduction. This will give a
stron-842
ger, empirical foundation to the framework, and allow the dashed
843
(i.e., proposed) transitions to be replaced with continuous (i.e.,
ob-844
served) lines.
845
Overall, additional metrics could provide even more insights
846
into FLOSS quality and support for understanding better how
pro-847
jects from the various forges perform on quality aspects (apart
848
from their already studied productivity). We plan to introduce
849
metrics related to software complexity (such as the cyclomatic
850
number of methods and functions, or the coupling among
meth-851
ods, files and packages), and a better characterisation of thetouch 852
metric, by considering the amount of code modified in each touch
853
(i.e. with the ratio SLOCs/touch) in our future studies.
Fig. 4.Transition between Cathedral and Bazaar, taken from (Capiluppi and Michlmayr, 2007).
4http://www.tigris.org. 5
http://freshmeat.net. 6
http://objectweb.org.
Soft-UNCORRECTED
PROOF
854 Appendix A. List of projects and application domains855 References
856 Antoniol, G., Casazza, G., Penta, M.D., Merlo, E., 2001. Modeling clones evolution 857 through time series. In: Proceedings of the IEEE International Conference on 858 Software Maintenance 2001 (ICSM 2001), Fiorence, Italy, pp. 273–280. 859 Basili, V.R., Caldiera, G., Rombach, D.H., 1994. The goal question metric approach. In: 860 Encyclopedia of Software Engineering, John Wiley & Sons, pp. 528–532, see also 861 <http://sdqweb.ipd.uka.de/wiki/GQM>.
862 Beecher, K., Boldyreff, C., Capiluppi, A., Rank, S. Evolutionary success of open source 863 software: An investigation into exogenous drivers, Electronic Communications 864Q4 of the EASST 8.
865 Boehm, B.W., Clark, Horowitz, Brown, Reifer, Chulani, Madachy, R., Steece, B., 2000. 866 Software Cost Estimation with Cocomo II with Cdrom. Prentice Hall PTR, Upper 867 Saddle River, NJ, USA.
868 Cabin, R.J., Mitchell, R.J., 2000. To bonferroni or not to bonferroni: when and how are 869 the questions. Bulletin of the Ecological Society of America, 246–248. 870 Canfora, G., Cerulo, L., Penta, M.D., 2007. Identifying changed source code lines from 871 version repositories. Mining Software Repositories 0, 14.
872 Capiluppi, A., 2003. Models for the evolution of OS projects. In: Proceedings of ICSM 873 2003 2003 IEEE, Amsterdam, The Netherlands.
874 Capiluppi, A., Michlmayr, M., 2007. From the cathedral to the bazaar: an empirical 875 study of the lifecycle of volunteer community projects. In: Feller, J., Fitzgerald,
876 B., Scacchi, W., Silitti, A. (Eds.), Open Source Development, Adoption and
877 Innovation, International Federation for Information Processing. Springer, pp.
878 31–44.
879 Capiluppi, A., Morisio, M., Ramil, J.F., 2004. Structural evolution of an open source
880 system: a case study. IWPC, 172–182.
881 Crowston, K., Annabi, H., Howison, J., 2003. Defining open source software project
882 success. In: Proceedings of ICIS 2003, Seattle, Washington, USA.
883 Crowston, K., Howison, J., Annabi, H., 2006. Information systems success in free and
884 open source software development: theory and measures. Software Process
885 Improvement and Practice, 123–148.
886 Dalgaard, P., 2002. Introductory Statistics with R. Springer.
887 English, R., Schweik, C., 2007. Identifying success and tragedy of floss commons: A
888 preliminary classification of sourceforge.net projects. In: Proceedings of the 1st
889 International Workshop on Emerging Trends in FLOSS Research and
890 Development, ICSE, Minneapolis, MN.
891 Feller, J., Fitzgerald, B., Hecker, F., Hissam, S., Lakhani, K., van der Hoek, A. (Eds.),
892 . Characterizing the OSS Process. ACM.
893 German, D.M., 2004. The gnome project: a case study of open source, global
894 software development, software process: improvement and Practice 8 (4) 201–
895 215 <URLhttp://dx.doi.org/10.1002/spip.189>.
896 German, D.M., 2004. Using software trails to reconstruct the evolution of software.
897 Journal of Software Maintenance and Evolution: Research and Practice 16 (6),
898 367–384.
DEBIAN GNOME KDE RF SAV SF
acpidump P alacarte C ark P actsasfo-rmatted O a2ps H Aquila G
apmud P anjuta R dolphin P classifier O acct P audiobo-okcutter H
boson F astrolabe P fifteen-applet F cmdctrl P alive P Beobach-ter P
cdpara-noia H atspi O kaddress-book A debug-print P autoconf O cdlite H
cherokee G bakery O kamera H explain-pmt A avrdude P cotvnc P
clamav P cheese H kate R family-connect G bubble-mon P cpia G
dia M criawips I kback-gammon F forkma-nager G carbon-kernel M criticalcare F
enigmail A damnedlies P kbattle-ship F geokit L cdump P csUnit O
EtoileWi-ldMenus O daybook G kcron P gewee F cflow O eas3pkg M
fig2ps H esound H kdebug-dialog O hatena-graphup G clustersim M edict J
flac H evolutionjescs A kfeed A inifile G codeeditor F expreval M
fte O evolutionsharp A kfileplugins P iowa G fluxus P fitnesse O
geomview M garnome P kfind P jabber4r A freehoo F fnjavabot A
gosa G gdm P kgamma P matlabruby M freepooma H formproc G
grass6 M geadow R khangman F mechanize G gcl O fourever E
grub P gfloppy P khtml P mms2r A gfo M freemind H
gwenview H gimphelp2 H kioclient G morse A ghome-mover P galeon C
jToolkit R glibjava O kjsembed O netnetrc G gnumed A genromfs P
kdegames F gnomebuild O kjs E object-graph O gtktalog P gvision O
kdenet-work G gnomefileselector P klink-status G pseudo-cursors P gvpe H hge F
kmouth H gnomereset P kmag H qwik A hitweb R icsDrone F
kphoneSI A gnometestspecs P kmailcvt A railshasflags B libmath-eval M interme-zzo P
libax25 O gnomewebwml G kmoon F randomdata M mcron O jtrac O
liboil O gob O kmouse-tool C rapt L mp3tag H juel O
libsoup O gopersist C kmouth H rateable-plugin L myspwi-zard B kpictorial F
mimede-code P greg P knetwalk F roxml O oroborus C modaspdotnet G
modauthkerb F gthumb H knetwork-conf P rparsec O osip O moses A
myphp-money M gtkmmroot O knewsti-cker A rriki B phpcom-pta G nbcheck-style O
noteedit R guikachu O kpat F rssfwd A phpgroup-ware G neocrypt N
octaveforge G imperl A kppp G rtplan I ply A netstrain A
openafs G libbonobojava O krfb P rubyamf G psg P ogce G
Pike O libglass O kross-python O rubyexiv2 H radius G oliver G
prcs1 H libgnomeui O ksim P rubyibm B radius-plugin G ozone B
preludemanager G libpreview I ksquares F rubypytst O ratpoison C perpojo A
ProofGene-ral M libwnck C kstart C ruport B sather P pf P
rlplot H libxmlpp O kteatime F sahara O sdcdc O Qpolymer M
ruby O narwhal B ktnef A s7eep O sins F seagull O
scid F nautilusmozilla G kuiserver P simplesi-debar C stow P simple-soap D
shorewall P nautilusrc G kxmlrpc-client A snmplib A texi2html E simplexml O
skel P nautilussendto P kxsconfig C soks G texinfo R source G
sylpheed A oaf O liloconfig P sstruct J tiger P swtjaspe-rviewer K
syncekde C present C lskat F stdlibdoc O tong F toolchest C
tcl O pygtk O marble F timcha-rper G twinlisp O txt2xml O
tdb P pygtksou-rceview O nntp A trie M vihmauss F uniportio P
tiobench P rhythmbox H qtruby O ttt2db I wasp P ustl O
txt2html E SashCom-ponents O shell P utilrb O webpu-blish G whiteboard D
vlc H sawfish C solid O verhoeff M xmakemol M winssh-askpass Q
wxWidgets O silkywww G sonnet O voruby M xmod O wxactivex G
xmakemol M viciousbuildscripts O strigianalyzer P watchcat G xsltxt E xmlnuke G
yaml4r M vte P umbrello O xspf O yafsplash C xqilla B