Volume 43– No.9, April 2012
Quasi-Dynamic Scheduling in Wireless Broadcast
Networks
Bikromadittya Mondal
Sarit Chakraborty
Sharmistha Bhattacharjee
Department of Computer Science & Engineering
B. P. Poddar Institute of Management & Technology, Kolkata, India
ABSTRACT
The broadcasting nature of wireless networks provides an inherent advantage of utilizing the broadcast gain. To improve the efficiency of the network gain associated with multiuser diversity should be optimally exploited simultaneously keeping in mind the problems of wireless networks. One of the most notable problems which we have focused in this paper is the degradation of Signal-to-Noise Ratio (SNR). This paper proposes a quasi-dynamic scheduling algorithm ensuring the maintenance of a good SNR in all transmissions following the first transmission and then opportunistically selects a receiver of each transmission as the transmitter for the following transmission. Following this algorithm we have attained a throughput comparable to dynamic-optimal multicast algorithm at a lower message complexity.
Keywords
Rayleigh Distribution Curve, Channel fading, Signal-to-Noise Ratio,Multiuser diversity gain, Optimal Throughput.
1.
INTRODUCTION
Channel Fading is one of the major problems of wireless networks. Prominent reason of channel fading is due to shadowing from obstacles affecting wave propagation. Channel fading leads to degradation of SNR. Most of the previous works[1, 2] have identified that minimizing channel fading i.e., improving the SNR immensely improves the average throughput of the network. Our work schedules the transmissions in such a way so as to maintain a good SNR.
Among the previously studied algorithms, Static Optimal Multicast Scheduling[1] have shown best throughput based on a probabilistic determination of user-selection ratio which remains constant for a constant average SNR of the system. The Median Scheduling algorithm[3, 4] chooses to maintain this user-selection ratio constant at 50% for all values of average SNR of the system. The Dynamic Opportunistic Multicast Scheduling[2] focused on finding out the optimal user-selection ratio by maximizing the average network throughput. All these algorithms were centralized algorithms that are vulnerable to node failures[5].
We propose a distributed scheme for broadcast scheduling in our work. In this paper, we proposed a scheme to determine the user-selection ratio based on a simple characteristic of the Rayleigh Distribution Curve. The proposed algorithm utilizes Opportunistic Scheduling technique[6]. In wireless communication, different user undergoes various degrees of fading, which can be used to transmit information at the peaks
to multiple users with different instantaneous channel conditions. Unlike the works[1-4] which considers an average SNR for the whole network, this paper considers a heterogeneous model of network with variation of SNR among the users while optimizing the user-selection ratio. The main focus of this paper is on scheduling those users in each transmission which possess good SNR with respect to the transmitter.
2.
MULTICAST-SCHEDULING
STATEMENT
The problem of Multicast Scheduling is how to schedule part of the users so as to efficiently exploit multiuser diversity gain and broadcast gain in order to attain high throughput of the network. First, we need to find out the channel gains of each user through perfect channel estimate as
ℎ𝑡,1, ℎ𝑡,2, ℎ𝑡,3, … … … . ℎ𝑡,𝑘
wheret is the transmission slot varying from 1 to T. For a particular transmission and Knumberof users who receive simultaneously in that single transmission slot, the channel condition is assumed to remain constant and can therefore be arranged as
ĥ1≤ ĥ2≤ ĥ3≤ ⋯ ≤ ĥ𝑀≤ ⋯ ≤ ĥ𝐾
Our problem can now be defined as finding out the optimal number of users in a single transmission slot and position of user M so that M to K can receive packets correctly. The Probability Distribution Function(PDF) is
𝐹 𝑥 = 𝑃 𝑥͂1≤ 𝑥, … , 𝑥͂𝑘≤ 𝑥, 𝑥͂𝑘+1> 𝑥, … , 𝑥͂𝐾> 𝑥 𝐾
𝑘=𝑀
= 𝐶𝐾𝑖 1 − 𝑒−𝑥2 𝑖
𝑒−𝑥2 𝐾−𝑖
, 𝑥 ≥ 0
𝑁
𝑖=𝑀
Thus, the problem is to find out the maximum of the average network throughput. This average network throughput is formulated as
𝑅𝑡𝑜𝑡 = 𝐾 − 𝑀 + 1 𝑙𝑜𝑔(1 + 𝜌𝑥). 𝑑𝐹(𝑥) ∞
0
3.
PROPOSED WORK
3.1
System Model and Assumptions
Volume 43– No.9, April 2012 Let 𝑅𝑡 denote the total throughput obtained in each
transmission following the first transmission slot. Thus, for a total of T transmissions, the total network throughput can be defined as
𝑅𝑡𝑜𝑡 = 𝑅𝑚𝑒𝑑 + 𝑅𝑡 𝑇
𝑡=2
Therefore, Average Network Throughput can be defined as
𝑅𝑎𝑣𝑔= 𝐸 1𝑇 𝑅𝑚𝑒𝑑 + 𝑅𝑡 𝑇
𝑡=2
Where 𝑅𝑚𝑒𝑑 is the throughput obtained from the first transmission adopting Median Scheduling algorithm[3,4] and
𝑅𝑡 is the throughput obtained in each of the remaining transmissions scheduled in a distributed manner.
𝑅𝑚𝑒𝑑 is defined as
𝑅𝑚𝑒𝑑 =𝑘2𝐸 log2 1 + 𝜌𝑎𝑣𝑔 ℎ𝑘 2(1) 2
Where 𝑘 is the total number of users receiving in the network,
𝜌𝑎𝑣𝑔 is the average SNR of the whole network.
𝑅𝑡can be defined as
𝑅𝑡= 𝑘𝑡𝐸 log2 1 + 𝜌𝑎𝑣𝑔 ∗ ℎ1 𝑡 2
Where 𝑘𝑡 is the total number of users who receive the information in the 𝑡𝑡ℎ transmission slot, ρavg* is the SNR
within the periphery of the transmitter which almost remains constant for every particular transmitter.
Following the Rayleigh Distribution Curve(Fig 1), if ρavg is
the Average SNR over the whole network then
𝜌𝑎𝑣𝑔 ∗≥ 𝜌𝑎𝑣𝑔
The sinusoidal wave-like distribution of a wireless signal as shown in Fig 1 forms due to the fact that an electromagnetic signal travelling in a wireless medium undergoes various degrees of fading in different directions. In fact, attenuation of signal occurs when the components of the sinusoidal wave vary with independent and identical distribution and are unable to reconstruct the original signal sent by the source at the receiver station. The requirement that there be many scatterers present means that Rayleigh fading can be a useful model in heavily built-up city centers where there is no line of sight between the transmitter and receiver and many buildings and other objects attenuate, reflect , refract and diffract the signal.
[image:2.595.326.530.43.215.2]The view of a single Rayleigh Curve in as follows
Fig 1: The Rayleigh Distribution Curve
In Fig 1 we have identified regions having almost similar fading characteristics with respect to the single source. A top view of the above curve(Fig 1) can be viewed as a series of concentric circles with various degrees of fading as shown in Fig 2.
Fig 2: Regions of Rayleigh Distribution Curve with various degrees of fading
The model that we have adopted for scheduling our transmissions is that of a different source placed in each of the different concentric circles (regions) so that retransmission from this source schedules only the users within the region it is present in thereby greatly minimizing channel fading and ensuring the receivers have a high SNR value.
As visible from Fig 3, the position of maximum channel fading of the signal transmitted by the original source lies in a preferably better SNR position with respect to the 4th Source. Also, the 4th Source lies within the best SNR periphery of the
3rd Source which again lies within the best SNR periphery of the 2nd Source that lies within the best SNR periphery of the
Original Source. Thus, each of the users possesses a high SNR with respect to the source that acts as a transmitter for it.
Position of Maximum Channel Fading
Regions of similar
fading Position of Source Distance
Position of Maximum Channel Fading Position of Maximum
Channel Fading
[image:2.595.317.541.302.401.2]Volume 43– No.9, April 2012
Fig 3: Proposed Model of Distributed Scheduling
3.2
Quasi-Dynamic Scheduling Algorithm
We have proposed the following algorithm which decides the user-selection ratio dynamically for each transmission except the first, thus naming it as quasi-dynamic scheduling algorithm. Steps:1. When a new signal arrives at a base station, it schedules 50% of its best receivers in the first transmission following Median-User Scheduling algorithm[3,4] considering an average SNR for the whole network.
2. For each of the following transmissions
Until no neighbouring requesting receivers remains unserved
do
(a) One of the receivers of the previous transmission, whoseneighbouring receivers have not yet received the transmitted information, is selected as the transmitter for the current transmission.
(b) The new transmitter schedules its immediate neighbouring receivers and transmits the signal at a rate equal to the channel characteristics of the worst receiver scheduled in the current transmission.
(c) Consequently, all the scheduled receivers with channel characteristics at and above the transmitted rate receive the signal at a good SNR.
4.
SIMULATION RESULTS AND
ANALYSIS
On the basis of Fig 4, the observed results can draw a firm conclusion that our proposed algorithm provides a very preferable throughput in comparison to the static, median-scheduling and dynamic-suboptimal algorithms. The reasons for exhibiting this improvement lies in the fact that our algorithm does not assume a static user-selection ratio for the transmissions and the scheduling of the users is made at the beginning of each transmission on the basis of information
the average SNR value of the whole network to be 20db and that of the immediate neighbours to the transmitter to be 35db.
However, our algorithm may stand comparatively degraded to the dynamic-optimal scheduling algorithm for larger number of users. This observation can be attributed to the fact that our proposed work takes dynamic decisions about a subset of the users which lie within a fixed distance from the sender. This way of decision-making has two significant advantages:
Minimizing the degradation in the signal-to-noise ratio which consequently ensures minimal channel fading
Minimizing Message complexity as channel conditions of fewer number of users need to be observed by the transmitter
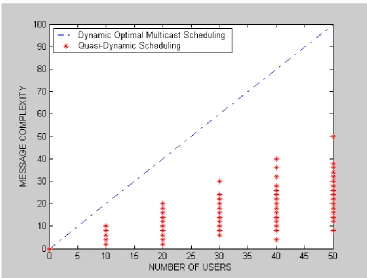
On the basis of the Fig 5 we can fairly conclude that there is a significant reduction of the message complexity of our proposed algorithm in comparison to the Dynamic-optimal algorithm. In the Dynamic-optimal algorithm, channel conditions of every un-received user need to be known by the transmitter before scheduling them. Whereas, in Quasi-dynamic algorithm, a transmitter needs to be acknowledged about the channel conditions of its immediate neighbouring receivers only before scheduling a transmission thereby decreasing the message complexity.Fig 5 compares the message complexity of dynamic-optimal algorithm with Quasi-dynamic scheduling algorithm, of 0 through 50 users during different transmissions of the same slot for a total of 25 such slots. Apart from the simulations, Quasi-dynamic scheduling algorithm has some preferable pros listed below:
Scheduling of 50% of the users in the first transmission aids in the reduction of the number of transmissions required to satisfy all users.
The transmissions conducted by the receiver of the previous transmission relieves the base station from any further scheduling overheads.
The choice of transmitting to immediate neighbours Original Source
4thSource 2nd Source
3rdSource Amplitude
of Signal
Distance
Volume 43– No.9, April 2012
Fig 4: Number of Users verses Average System Throughput (bps/Hz)
[image:4.595.113.481.379.657.2]Volume 43– No.9, April 2012
Fig 6: Number of Users verses User-Selection Ratio
Scheduling the transmissions following our model of distribution(Fig 3) provide a better user-selection ratio at higher number of users(Fig 6) when the channel conditions of users are uniformly distributed. For fewer numbers of users in the network, some of the users with extremely poor channel conditions are unable to intercept the signal due to the absence of a neighbouring transmitter.
5.
CONCLUSION
The view of the Rayleigh Distribution Curve adopted in this paper has proved to be very efficient and effective as far as the distributed scheduling is concerned. On the basis of the simulation results obtained we can conclude that the proposed algorithm provides far better throughput than some of the previously best-known algorithms [1-4]. The message complexity of our algorithm is found to be significantly less when compared to dynamic-optimal algorithm. Our proposed algorithm could prove to be very efficient in heavily congested environments where wireless signals are vulnerable to shadowing from frequent obstacles.
6.
REFERENCES
[1] Jiang Yu, YouyunXu, Wei Xie, Static Throughput Optimal Scheduling For Wireless Multicast, Future Information Networks, 2009. ICFIN 2009. First International Conference, 14-17 Oct. 2009 , page(s):146-149.
[2] Tze-Ping Low, Man-On Pun, C.-C. Jay Kuo, Optimized Opportunistic Multicast Scheduling Over Cellular Networks, Acoustics, Speech and Signal Processing,
2009. ICASSP 2009. IEEE International Conference,19-24 April 2009.
[3] Praveen Kumar Gopala and Hesham El Gamal, “Opportunistic Multicasting”, in Proc. TheAsilomar Conference On Signals, Systems and Computers, Pacific Grove, CA, November 2004.
[4] Praveen Kumar Gopala and Hesham El Gamal, “On the Throughput-delay tradeoff in Cellular multicast”, in Proc. International Conference On Wireless Networks, Communications and Mobile Computing, Maui, HI, June 2005.
[5] Errol. L. Llyod, “Broadcast Scheduling for TDMA in Wireless Multihop Networks”, Ch-16, Handbook of Wireless Networks And Mobile Computing, edited by Ivan Stojmenovic.
[6] Tse, D. and P.C. Viswanath, Fundamentals of Wireless Communication. 2005: Cambridge University Press.
[7] Viswanath, P., D.N.C. Tse and R. Laroia, Opportunistic beamforming using dumb antennas. Information Theory, IEEE Transactions on,2002. 48(6): p. 1277-1294. [8] Singh, S.C.S. Raghavendra and J. Stepanek.
Power-Aware Broadcasting In mobile Adhoc networks,1999. [9] Javad Akbari Torkestani, Mohammad Reza. Mobility