Using Genetic Algorithm for Fuel Consumption
Optimization of a Natural Gas Transmission Compressor
Station
Golnaz Habibvand
Department of
Gas Processing and Transmission Petroleum University of Technology
Ahwaz, Iran
Reza Mossayebi Behbahani
Department of
Gas Processing and Transmission Petroleum University of Technology
Ahwaz, Iran
ABSTRACT
In this study the goal is to optimize the compressors’ fuel consumption through manipulating the compressors’ affecting parameters as well as the operating condition parameters of the turbines and the air coolers within a gas compression station unit in operation phase by using Genetic Algorithm. The simulation part is written in a custom-built computer program and is checked by known software and optimization is through the use of Genetic Algorithm. By considering the complexity of these systems, GA is used to do the optimization part in a proper manner. The results show that in compressor stations with same turbo compressor packages which are designed in recent years, despite nonlinear relations, linear load sharing will be the most optimized choice (the effect of air coolers and line pack has been studied too). And also Genetic Algorithm optimization method is a good one for optimization of gas transmission systems.
Keywords
Genetic Algorithm, Optimization, Compressor Station, Gas Transmission System
1.
INTRODUCTION
Gas transmission systems have been utilized to transport large quantities of natural gas across long distances for decades. Typically, gas flow through a pipeline network results in a pressure loss due to friction and heat transfer to the surrounding. Therefore, natural gas compressor stations are located at regular intervals along the pipelines to boost the pressure lost. These compressors consume part of the transported gas, and thus result in an important fuel consumption cost and also CO2 emission to the environment. Therefore, the optimized fuel consumption plays an important role in operating cost of the stations. The difficulties of such optimization problems arise from several aspects. First, compressor stations are very sophisticated entities. They might consist of a few dozen compressor units with different configurations, characteristics and nonlinear behavior. Second, the set of constraints that define feasible operating conditions in the compressors along with the constraints in the pipes constitute a very complex system of nonlinear constraints. Third, the considered optimization problem often involves both continuous and integer variables. Moreover, the treatment of industrial-size problems may render the problem highly combinatorial.
Mathematical modeling of process units is one of the proper ways of analyzing different situations which is mostly used in recent researches. In gas transmission systems the utilization of the steady state analysis methodology and tools are quite
popular due to simplicity of the analysis and the utilitarian nature of results. Lots of researches have been done in the case of gas transmission networks by using different optimization methods and concepts.
Larson and Wong [1] used Dynamic programming for the steady state optimal operating conditions for fuel consumption minimization of a non-branched natural gas pipeline with compressors in series to the optimum suction and discharge pressures. Edgar et al [2] used both NLP and Branch and bound scheme for optimal design of gas transmission systems. Osiadacz [3] used hierarchical system theory for Dynamic optimization of high-pressure gas networks. Wolf and Smeers [4] used mixed integer nonlinear programming known as MINLP for fuel cost minimization. Mercado et al [5] proposed a heuristic solution procedure pro fuel cost minimization for a gas transmission system with a cyclic network topology. Kabirian and Hemmati [6] applied an integrated nonlinear optimization model and also heuristic random search method for design and development of natural gas transmission pipeline networks. Chebuba et al [7] applied Ant Colony Optimization (ACO) for the first time, for fuel consumption minimization problem in natural gas transportation systems. For gas pipeline operation optimization the ant colony algorithm is a new evolutionary optimization method. Zhang and Chen [8] applied the fuzzy optimization for design of gas pipeline.
The first application of GA to pipeline optimization was introduced by Goldberg and Kuo [9] where they demonstrated its application on a liquid pipeline system. They demonstrated that GA's are computationally more demanding than conventional optimization algorithms, but offer many advantages over conventional methods. Current development involves hybrid optimizations, which combines the advantages of both categories of optimization methods. Genetic algorithms were employed for the first time in 1985 for the optimization of the natural gas pipelines [10].
Montoya et al [11] applied the modified GA to optimize the design of gas transmission networks operating under steady state conditions, the gas network optimization system implemented by GA that executed an "intelligent search" in a gas transmission networks space. It obtained automatically and with a low computational work a distribution of pipeline segment diameters for a minimum investment cost, accomplishing some restrictions initially fixed.
regarded from several aspects: 1. The compressor stations usually contain some complicated turbo compressor packages which are different or the same; 2.A set of nonlinear equations and correlations has to be established to determine an acceptable operational point compatible with the function of compressors, gas turbines, air coolers and pipelines.
This study presents the methodology adopted for such simulation and optimization which is based on GA with the known constraints of booster compressor operating boundaries, gas turbine performance limits, and climatic conditions. An example of a compressor station on the 5th Iranian gas transmission system by three equal compressors driven by similar gas turbines (SGT 600) as well as same size coolers was considered to demonstrate the optimization approach. Results include single-objective optimization to minimize fuel consumption for a compressor station to reach a specified set pressure at next station.
2.
OPTIMIZATION METHODOLOGY
There are lots of fundamental objective functions that can be defined for a gas pipeline network both in design and operation phase such as total energy consumption (or cost), throughput, profit maximization, line pack, and total life cycle cost minimization. The present project deals with fuel consumption minimization in a compressor station from suction of the firs station, by considering the pipeline, till suction of the next station. The objective function of the problem is the summation of the fuel consumption mass flow rates over all the drivers of the compressor units existing in the stations of the network. By having the Total fuel consumption, mft, the objective function of this project is
determined by the following equation:
=
Eq.1The following limitations shall be considered too (Nr shows the compressor speed in rpm):
< <
Eq.2 Minimum Head < Head < Maximum Head Eq.3 To minimize fuel consumption for gas pipeline systems, often multiple unit compressor stations presented significant challenges to the optimization tool. This is because several feasible solutions might exist which satisfy both the minimum objective function and associated constraints. Local minima might occur leading to a no convexity optimization problem [12]. Therefore, a detail station optimization tool (like the one used in the present work) should be incorporated in the overall system optimization to arrive at the optimum solution of station operation for a given set of control parameters. Gradient-based optimization methods have been used to analyze gas pipeline networks in the past [13]. Like the name implies, they rely on the derivative of the function being optimized with respect to all control variables that define the system. The derivative, or slope, of the function at a sampleddependent on the initial (starting) point. These methods have also been extended to transient pipeline optimization [16], however only on relatively smaller systems. Optimizations based on dynamic programming have been attempted, e.g. those based on Bellman’s Optimality Principle [17], again limited only to pipelines with series stations.
The other category of optimization methods is based on stochastic methods such as Recourse Methods, Simulated Annealing and Genetic Algorithm (GA). GA, however, offers great advantages for large systems with many interlinked control variables and a large number of possible cases (hence large search space). As the algorithm evolves through generations (similar to iterations in a typical algorithm), the objective function tends towards an optimum value. Due to the pseudo-random nature of the algorithm and its independence from objective function gradients, it does not become fixed in a local optimum point.
As mentioned earlier, multiple unit compressor stations could produce many local minima, but there is a fundamental requirement to find the global minimum regardless of the initial starting point. Secondly stability of the optimization procedure while managing the computational times, suggested that GA would best suit optimization of the power train system under consideration in the present work.
3.
COMPRESSION POWER TRAIN
SYSTEM
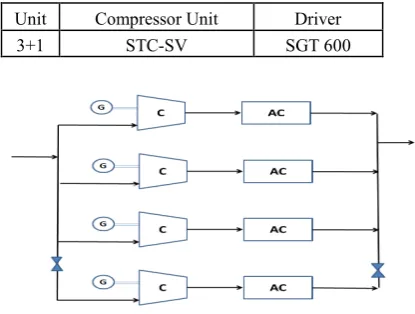
[image:2.595.323.531.483.640.2]A 3+1 compressor station on the IGAT 5th is considered as an example of a complex power train system named Khormoj. It comprises three similar compressor units driven by three similar gas turbines as shown in Table 1. The station includes three aerial coolers of same sizes in series with compressors. The downstream section of the pipeline to the next station (130 km downstream) is composed of a 56 inches line to the next station.
Table 1. Three similar Turbo Compressor Packages
Fig 1: Schematic of Khormoj Compressor Station Unit Compressor Unit Driver
Table2. Specifications of the Aerial Coolers
Aerial Cooler ABAN
NO. OF PASSES 2
NO. OF BAYS 5
BARE SURFACE AREA/BAY (M2) 427.68
SURFACE / UNIT-FINNED(M2) 62347
NO. OF FANS PER BAY 2
FAN DRIVE TYPE MOORE
TUBE MATERIALS SA 179
Seamless
FIN MATERIALS Aluminum
TUBE LENGTH (M) 12.192
FAN POWER (DESIGN) (KW) - FOR
ONE FAN 28.7
FAN POWER (MOTOR) (KW) - FOR
ONE FAN 37
NO. OF BUNDLES OF TUBES PER BAY 2
NO. OF TUBES PER BUNDLE 276
TUBE O.D (MM) 25.4
TUBE WALL THICKNESS (MM) 2.108
TUBE I.D (MM) 28.45
AIRQUANT./FAN(ACT)(M3/HR) 122
FOULING RESIST.[M2.K/W] 0.00018
[image:3.595.313.543.69.254.2]
Fig 2: Normalized Pressure Drop through Coolers
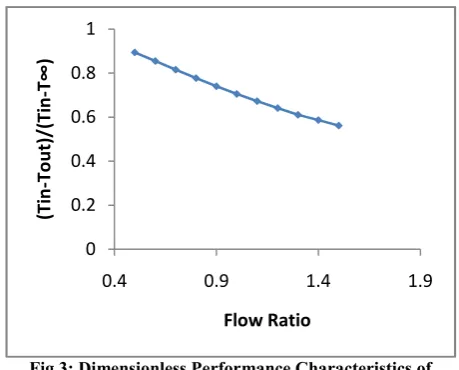
Fig 3: Dimensionless Performance Characteristics of Coolers
The pressure drop is normalized to the flow rate and inlet temperature of the fluid and fitted to a polynomial function, while the outlet temperature of the coolers is normalized with respect to the flow rate and inlet temperature, and fitted to the following functions too:
∆P =a + bx + cy + dx2 + ey2 + fxy + gx3 + hy3 + ixy2 + jx2y;
Eq.4 Where x is Flow Actual/Nominal Actual Flow, y is Tin in ◦C and:
a= 395.3655825; b = 11.41387753; c = -16.0755339; d = 57.7550772; e = 0.21758505; f = -0.21261279; g = -0.55461205; h = -0.00098126; i = 0.001340932; j = 0.218196579;
-Outlet temperature as a function of flow and inlet temperature in a constant pressure:
T2 = a + bx + cy + dx2 + ey2 + fxy + gx3 + hy3 + ixy2 + jx2y; Eq.5 Where x is Flow Actual/Nominal Actual Flow, y is Tin in ◦C and:
a = 67.42477182; b = -29.215843; c = -0.58504924; d = 7.64521707; e = 0.005583279; f = 0.552693029; g = -0.82556333; h = -2.3337e-05; i = -0.00010861; j = -0.10165083;
The compressor performance characteristics are shown in Figure 4.
0 20 40 60 80 100 120 140 160 180
0.4 0.9 1.4 1.9
P
re
ss
u
re
D
ro
p
K
p
a
Flow Ratio
0 0.2 0.4 0.6 0.8 1
0.4 0.9 1.4 1.9
(T
in
-T
o
u
t)
/(
T
in
-T
∞
)
[image:3.595.65.270.86.619.2]Fig 4: Performance Characteristics of the Compressors
By having maps of turbo compressors (shown in figure 4), using a digitizer program, and some fitness program, coefficients of compressors characteristics can be found. Two set of data have been found, as below, to regenerate the compressor performance curve and coefficients (b1...b8) to use
in simulator (Table3).
3 4 2 3 2 1 2 + + + = r ac r ac r ac r N Q b N Q b N Q b b N H Eq.6 3 8 2 7 6 5 + + + = r ac r ac r ac id N Q b N Q b N Q b b η Eq.7
Table3. Required Data from Performance Maps of Compressors
Head Table
Number Head
[KJ/Kg]
Inlet flow
[M3/hr]
Speed
[rpm]
Efficiency Table
Number Efficiency
[%]
Inlet flow
[M3/hr]
Speed
[rpm]
[image:4.595.331.522.195.544.2]The temperature increase in a compressor is modeled as an irreversible adiabatic process. Upon mixing of streams of different temperatures at the discharge from compressor units, the mixed temperature is calculated using conservation of enthalpy. The AGA-Fully Turbulent equation and hall- Yarborough equation of state are used in determining the various physical and thermodynamic properties at each condition of the gas, given the prevailing gas mixture composition and compressor station specifications shown in Table 4 and 5.
Table4. Gas Mixture Composition
ITEM COMPOSITION Mole %
1 METHANE 87.424
2 ETHANE 5.492
3 PROPANE 0.751
4 I-BUTANE 0.100
5 N-BUTANE 0.101
6 I-PENTANE 0.024
7 N-PENTANE 0.015
8 N-HEXANE 0.005
9 NITROGEN 3.202
10 CO2 2.097
11 H2S 0.786
12 H2O 0.002
13 M-MERCAPTAN 0.00
14 E-MERCAPTAN 0.00
15 COS 0.00
16 TOTAL 100%
Table5. : Input Parameters for the Power Train System
ITEM SPECIFICATIONS Unit
1 OPERATING PRESSURE Barg 68.8/92
2 DESIGN PRESSURE Barg 100
3 TOTAL LENGTH KM 130
4 CAPACITY MMSCFD 3200
5 NOMINAL PIPE SIZE INCH 54
0 10 20 30 40 50
0 20000 40000
H e a d K j/ K g Flow m3/hr 8085 7700 7592 6930 6160 5390 0 20 40 60 80 100
0 20000 40000
The control variables are:
• Compressor load sharing in terms of the mass flow split to each compressor unit.
• Compressor performance curve limitations • Aerial cooler pressure drop and temperature
For optimization in this case, a chromosome by 18 bit length is considered, 1 bit for status of on/off of compressor, and two seven string for load sharing of each compressor and 3 bit for status of on/off of the air coolers.
Population size is considered 35, and the population type is bit string. The generation is set on 200 and stall generation limit is considered 10 to do the optimization. These large numbers make any unorganized search of all configurations for the best case impossible.
Effort has also been devoted to achieve convergence with minimum computational effort and without compromising the accuracy of the results.
4.
Results
The results of the optimization in some sample flows are presented in table 6.
0 10000 20000 30000 40000 50000 60000 70000 80000 90000
2000 2500 3000 3500 4000
P
o
w
e
r
H
p
[image:5.595.55.296.331.524.2]Flow MMSCFD
Fig 5: Power versus Flow Diagram
By considering the results gathered from optimization it was seen that the load sharing became equal for equal turbo compressor packages. According to results, up to flow 2300, one of the compressors will be set off and the other will be in work by approximate 50% of flow in use.
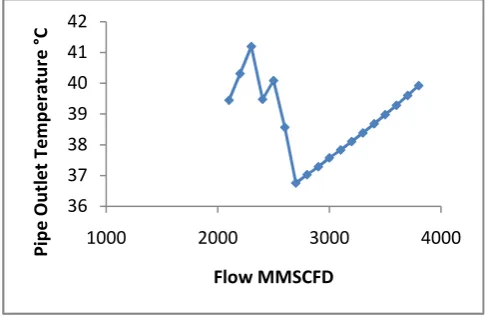
Fig 6: Pipe Outlet Temperature versus Flow Diagram
Optimum horse power of the compressors will increase by increasing the flow rate, the gap produced between lower points of power curves is according to the air coolers in service and consequently the inlet temperature of flow to the pipe (figure 5 and 6).
It can be seen that up to this flow all three air coolers are not needed to be in service (pressure drop of zero means air cooler is off), in flow 2400 and 2500 one air cooler from three is enough to get to the pressure of required at suction of next compressor station, in flow 2600 one of the air coolers shall be stopped and in all other flows all three air coolers shall be in service.
The result of simulation part has been checked by a known simulator either.
Both from known simulator and this project simulator results, it can be achieved that the load sharing and consequently fuel consumption in all three compressors are the same. This is because of that as the pressure at inlet of next station is fixed, the search cannot be done in a big interval from nominal working condition. As the flow increases, pressure drop inside pipe line increases too, so the compressors have to produce bigger head and in this compressor map ,by increasing flow so the rpm and required head will be increase, and by considering the efficiency curve of compressors, the efficiency will be decreased, the fuel consumption will increase. And from what can be seen from efficiency curve for lower flow all rpm curves are laid on each other and the efficiency became the same. And therefore the load sharing will be the same to work in best efficiency.
It can be concluded this station was design in an optimum condition for these ranges of flow and the operator shall be capable of shutting down one of the compressors and every air coolers whenever needed to save energy.
Here It shall be explained what it was mentioned in literature survey, for fuel consumption minimization. In all mentioned cases the turbo compressors of a station was from two or more different company and these different curves (in at least one of them the playing roll interval is very big) make the search space bigger and therefore led to the optimized results. But as it was mentioned before, in Iran there is not such stations.
5.
CONCLUSIONS
The following concluding remarks can be drawn from the present work:
1. Genetic Algorithm optimization method is a good one for optimization of gas transmission systems. This is due to the nature of the variables involved which are made of continuous and discrete ones and can change several parameters simultaneously and its utilization in the pertinent nonlinear problem does not make it entrapped in the local optimum spots.
2. Written simulator and optimizer package was successfully developed for entire power train of compressor stations to the suction of next station. It can calculate all required data to control stations in an optimized manner.
36 37 38 39 40 41 42
1000 2000 3000 4000
P
ip
e
O
u
tl
e
t
T
e
m
p
e
ra
tu
re
°
C
[image:5.595.53.297.590.750.2]6.
ACKNOWLEDGMENTS
Our thanks are dedicated to Dr H. Golshan for his supports and guidance through the work.
7.
REFERENCES
[1] Tabkhi, F., 2007, Optimization of gas transmission networks, Ph.D Thesis, France.
[2] Edgar, T.F., Himmelblau, D.M., 1988, T.C. Bickel, Optimal design of gas transmission networks, Texas, SPE 6034.
[3] Osiadacz, A. J, 1994, Dynamic optimization of high Pressure gas Networks using hierarchical systems theory, 26th annual meeting of Pipeline Simulation Interest Group, 13-14 October, Sandiego, USA.
[4] Wolf, D.D., Smeers, Y., 2000, The gas transmission problem solved by an extension of the simplex algorithm, Management Science, Vol. 46, No. 11, p 1454-1465.
[5] Guillén, G., Badell, M., Espuña, A. , Puigjaner, L., 2006, Simultaneous optimization of process operations and financial decisions to enhance the integrated planning/scheduling of chemical supply chains, Computers and Chemical Engineering, vol. 30, no. 3, pp. 421-436.
[6] Kabirian, A., Hemmati, M.R., 2007, A strategic planning model for natural gas transmission networks, Energy Policy 35.
[7] Chebouba, A., Yalaoui, F., Smati, A., Amodeo, L., Younsi, K., Tairi, A., 2009, Optimization of natural gas transmission pipelines using Ant Colony Optimization, Computers & Operations Research 36.
[8] Zhang, Q., Chen, N., Luo, J., 2009, Fuzzy optimization design of gas pipeline, Fuzzy info. and eng., volume 2, AISC 62, pp. 1201-1208.
[9] Goldberg, D.E. and Kuo, C.H., 1985, Genetic Algorithms in Pipeline Optimization, Pipeline Simulation
Interest Group, Annual Meeting, Albuquerque, New Mexico, October 24-25.
[10]Botros, K.K., Sennhauser, D.J., Jungowski, K., Poissant, G., Golshan, H. and Stoffregen, J., 2004, Effects of Dynamic Penalty Parameters on the Conversion of MOGA in Optimization of a Large Gas Pipeline Network, 10th AIAA/ISSMO Multidisciplinary Analysis and Optimization Conference, Albany, New York. [11]Montoya, S.J., Jovel, W.A., Hernandez, J.A., Gonzalez,
C., 2000, Genetic Algorithms applied to the optimum design of gas transmission networks, SPE 59030. [12]Boyd, E.A. and Scott, L.R., 1997, Evaluating the Quality
of Pipeline Optimization Algorithms, Pipeline Simulation Interest Group, 29th Annual Meeting. [13]Goslinga, J., Kaulback, M., Witczak, K. and McNeill, B.,
1994, A Method for Pipeline Network Optimization, ASME Offshore Mechanics and Arctic Engineering, Volume V, Pipeline Technology, pp.31-43.
[14]More, J.J. and Wright, S.J., 1993, Optimization Software Guide, Society for Industrial and Applied Mathematics, Philadelphia.
[15]Sood, A.K., Funk,G.L. and Delmastro, A.C., 1971, Dynamic Optimization of a Natural Gas Pipeline Using a Gradient Search Technique, Int. Journal of Control, Vol. 14, No. 6, pp. 1149-1157.
[16]Tsal, R.J., Gordon, E., Simpson, K.O. and Olson, R. R., 1988, Optimal Gas Pipeline Design via Dynamic Programming with Variable Stages, Pipeline Simulation Interest Group, Annual Meeting, New Orleans, LA,October 30-31.
[17]Hawryluk, A., Botros, K.K., Golshan, H., Huynh, B., 2010, Multi-Objective Optimization of Natural Gas Compression Power Train with Genetic Algorithms, 8th International Conference, Calgery, Alberta, Canada