Voltage Stability Analysis comparing Generator
Sensitivity based Method with V-Q Curve Method for
Optimal Placement of STATCOM
Neena Ramesh
Asst Professor /EEE
SRM Easwari Engineering
College ,Chennai
B.V Sanker Ram
Professor/EEE
JNTUCEH
Hyderabad
Vedam Subrahmanyam
Professor/EEE
RMK Engneering College
Chennai
ABSTRACT
This paper compares the coherent groups of load buses based on Reactive Reserve Margin (RRB) obtained from the V-Q curve analysis and a novel generator sensitivity based method for optimal placement of STATCOM. The V-Q curve is one of the popular methods to study voltage instability problems in power systems during the post transient period or critical peak loads. The reactive reserve margin obtained is used to determine which generators will have an impact on the maximum permissible loading of a bus. For reactive power compensation a comprehensive power injection model of STATCOM is utilized in Newton Raphson load flow algorithm.
A sensitivity based method is proposed here to determine the coherent bus groups of a power system with similar reactive reserve basins under normal operating and critical load conditions. This method requires comparatively less V-Q curve computation which is a laborious procedure. The buses are categorised on account of their loading limitations.
The investigations for V-Q Curve and the novel generator sensitivity method are carried out and compared on Anderson and Fouad 9 Bus Test system.
Keywords
STATCOM, Voltage Stability, Generator Sensitivity based Method, V-Q Curve Analysis, Coherent Bus Groups, RRB, Anderson and Fouad 9 Test Bus.
1.
INTRODUCTION
Deregulation and restructuring of power systems have brought in tremendous changes .They are operated closer to their stability limits and voltage instability is one of the major issues of concern in the area of power security. The reactive characteristics of AC transmission lines, transformers and loads are one the main reasons for in limiting the maximum power transfer. During voltage instability the receiving end voltage falls below acceptable value and does not come back even after adopting restoring mechanisms and reactive compensation .This is followed by avalanche of events resulting in voltage collapse [1].
Static contingency analysis and ranking is mostly based on transmission line current limits and bus voltage magnitude limits [2]. Nowadays focus is more on dynamic contingency analysis, but computation of differential equations is tedious. But voltage stability analysis, is however static based [3].The common methods associated with voltage stability analysis are PV curve analysis wherein the loadability P margin and the QV curve analysis , wherein the reactive power Q margin
suitable for loading limits and does not reflect voltage condition. But the Q margin is a better index for indication of voltage performance. The disadvantage of this method is that power flow solutions have to be repeated for each bus to get the curve for each bus. Also determination of the critical bus is a selective random procedure [3].
The other methods of voltage stability assessment like L-index and line stability L-index FVSI, LMN [2], [3], [4] identifies the critical bus of a power system or the stability of each line. The indices provide pointers towards the proximity of voltage instability in a power system.
An important point to remember is that voltage stability analysis focuses on an area than a single critical bus. The work by Schlueter [9] is an ingenious method of voltage stability analysis. Voltage instability is largely due to loss of voltage control. The concepts of voltage control area, reactive reserve basin and the corresponding index based on local or global reactive reserves is more applicable to voltage stability analysis . Determination of the voltage control area, is a computational burden because the VQ curve has to be drawn for every bus in the system
The boundaries between different transmission groups of buses, is a prime reason of voltage instability [4]. The groups of buses, in geographically similar regions, have similar voltage changes for a disturbance called as voltage control areas (VCAs) [5]. Voltage control in a particular voltage control area may have relatively less impact in controlling the voltages of other voltage control areas .Such loss of voltage control within such a voltage control area may result into voltage collapse in that area . In this method critical voltage control areas instead of a single critical bus are identified, and the remaining network is reduced to equivalent nodes. Such reduction aids in fast voltage stability analysis and reactive power compensation. Voltage control areas are computed by different methods.
Buses having almost identical V-Q curve minima and reactive reserve basin i.e. the set of generators reaching its Q-limits while reaching minima point are clubbed together and form voltage control areas near nose point.
For reactive power compensation a comprehensive power injection model of STATCOM is incorporated in Newton Raphson Load Flow algorithm and tested on Anderson and Fouad 9 Bus Test System. The optimal placement of STATCOM is based on the voltage control area which is determined by V-Q curve and the sensitivity based method.
2.
THE STATCOM
STATCOM (Static Synchronous Compensator) provides bus bar voltage support by supplying and/or absorbing reactive power into the system. The STATCOM is a shunt connected compensator designed to electronically emulate reactive loads both inductive and capacitive. STATCOM when compared to static VAR compensator SVC have faster response time and the reactive power output is independent of AC system voltage [2]. Furthermore, the use of naturally commutated thyristor valves in these compensators often injects significant amount of undesirable harmonics into the AC system. The STATCOM provides outstanding performance for both steady state and dynamic operation as a pure static device with no switched passive elements.
The converter is connected to a medium voltage DC link .The VSI synthesizes a sinusoidal waveform from a DC voltage source. The switching devices in the VSC circuit is switched on and off at a high frequency (several kHz) and high frequency harmonics and ripples will be limited by connecting filters at the AC side of the VSC [10].
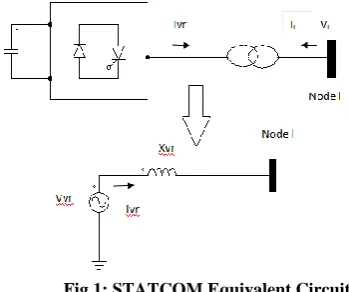
[image:2.595.339.498.74.314.2]Fig 1 shows STATCOM connected to the node which controls the voltage at the connected bus to the reference value by adjusting voltage and angle of internal voltage source.
Fig 1: STATCOM Equivalent Circuit
Fig. 2 illustrates the voltage-current characteristic of STATCOM and SVC [3]. Thus, the The ability of STATCOM to supply a wider range of reactive power at low system voltage .The STATCOM operates with its rated current even at reduced voltages. In addition, as long as the reactive current stays within its minimum and maximum values imposed by the converter rating ,the voltage is regulated to its reference value, However, a voltage droop (usually between 1% and 5% at maximum reactive power output) is normally used, for the V − I characteristic. Also the STATCOM is smaller in size compared to the SVC for the same power ratings.
Fig. 2. Voltage-current characteristic of a) SVC and b) STATCOM.
2.1
STATCOM Simulation Model
A general software has been developed in MATLAB with Newton Raphson Algorithm for load flow analysis incorporated with a power injection model of STATCOM [6].
There are three regions of operation with different steady state control characteristics responding to voltage change.
Linear control region Q = k( Vref-V) Const capacitance region Q = Ymax V2 Constant reactance region Q = Ymin V 2
The active and reactive power transfer, between the bus and VSC can be expressed as follows
PVR= V1 Vvr Sin θ / XVR
QVR= V1 |²/XVR - |V1||VVR| cos(θ1- θ VR) /XVR
Where XVR is the reactance of both the interconnection transformer and the STATCOM filter and θVR is the angle of V1with respect to VVR .
│Vl│2-│Vl││VVR│/ XVR
Where (θ1- θ VR ) =1 for the case of lossless STATCOM
If |V1|> |VVR| then QVR becomes positive and the STATCOM absorbs reactive power.
On the other hand QVR becomes negative if |V1 | < |VVR| and the STATCOM generates power.
[image:2.595.63.238.411.557.2]A novel power injection model of the STATCOM in a Newton-Raphson power flow algorithm is described in this section. It is a simple and efficient model based on the use of a variable voltage source, which adjusts automatically in order to achieve a specified voltage magnitude. In this case, the node at which the STATCOM is connected is a controlled node where the nodal voltage magnitude and the nodal active and reactive powers are specified while the source voltage magnitude is handled as a state variable.
Based on the representation given the following equations can be written
IVR = YVR( VVR -- Vl) ,where YVR = 1/ZVR = GVR + jBVR
The active and reactive powers injected by the source may be derived using the complex power equation:
SVR = VVRI*VR = VVR Y*VR(V*VR – Vl*)
Taking the variable voltage source to be VVR =│VVR│
(cosθVR+jsinθVR) and after performing some complex
operations, the following active and reactive power equations are obtained
PVR=│VvR│2GVR -│VVRVl│{GVR cos(θVR- θl) + BVR
sin(θVR - θl}
QVR = -│VvR│2BVR -│VVRVl│{GVR sin(θVR- θl) + BVR
cos(θVR - θl}
If the STATCOM is connected at node l and it is assumed that its conductance is negligibly small and that there is no active power exchanged with the AC system, i.e. GVR = 0 and θVR = 0
PVR = 0
QVR = - │VVR│2 BVR+│VVR││Vl│BVR
Based on these equations, the linearized STATCOM equation is given below, where the variable voltage magnitude,VVR is taken to be the state variable.
At the end of iteration (r), the variable voltage magnitude is updated.
│VVR│(r+1) = │VVR│(r) + ∆│VVR│(r)
2.2 STATCOM
Simulation Parameters
XVR: Inductive Reactance of Series Converter (p.u.) VVR: Initial condition of shunt source voltage mag (p.u.) PSP: Target active power flow (p.u.)
QSP: Target reactive power flow (p.u.)
TVR: Initial condition of the shunt source voltage angle
2.3 Key Power Components Modeling
The main components of power system like generator , voltage dependant load, induction motor ,transformer and the transmission line is based on conventional power flow models being represented by their steady state equivalent circuit.
In a generator when either field current or armature current limit is reached the relationship between ΔP, ΔQ, ΔV, Δθ are given by the steady state synchronous machine equations [12].The under excitation limit is modelled as a constant lower reactive limit. When a generator is operated within the limits the AVR drooping and load compensation provision is not taken onto account .The generator active power output is assumed constant. .
The loads are modelled as constant power loads
The other controlling devices like ULTC and switchable capacitors are not taken into account, since they are operated at random and come under long term calculations. Also voltage stability study involving contingency will have fast control or slow control studies incorporating ULTC and static VARs on the Jacobean matrix formation.
Hence only peak load variation gradually until collapse point is considered in this paper. The dynamics of the power system is not considered but approximated by selected device modelling at an instant of system conditions.
3.0 VOLTAGE STABILITY ANALYSIS
Different methods have been listed carrying out a steady state voltage stability analysis. The conventional methods can be broadly classified into the following types.[1]. P-V curve method for P loading margin Q-V Curve method for Q loading margin Sensitivity based Indices
V-Q curve method for RRB Modal Analysis.
Fig 3: V-Q Curve Minima
3.1 V-Q curve method
bus is noted from the power flow solutions and plotted against the specified voltage. The operating point for zero reactive power is when the fictitious source is removed from the critical bus.
The system is voltage stable at a given operating point if at every bus the voltage magnitude increases as the reactive power injection is increased .Voltage stability of a bus is closely related to the reactive power reserve, which can be easily found from the V-Q curve.
The reactive power margin (RRM) is the MVAR distance between the operating point and the nose point of the V-Q curve. Stiffness of the bus can be qualitatively evaluated from the slope of the right portion of the V-Q curve. The greater the slope is, the less stiff is the bus, and therefore the more vulnerable to voltage collapse it is. The critical point or nose point of the characteristics corresponds to the voltage where dQ/dV becomes zero. If the minimum point of the V-Q curve is above the horizontal axis, the system is reactive power deficient. Additional reactive power sources are needed to prevent a voltage collapse .Buses having V-Q curves below the horizontal axis have a positive reactive power margin. It may be still be reactive power deficient, depending on the desired margin.
The voltage stability assessment proposed by Schlueter(1998) determines the coherent bus groups in a system with the V-Q curve analysis performed at the bus. The V-Q curve minima at which the set of generators that exhaust or reach their reactive power limit at the curve minima is referred to as reactive reserve basin RRB for this load bus. Schlueter calls these groups of coherent buses as Voltage Control Areas and their associated generators as RRB .They have the most impact on the permissible reactive loading of a bus According to him these are the prime sources of voltage instability. The disadvantage in Schlueter’s method is laborious computation of V-Q Curves at a number of buses before the individual coherent bus groups are identified.
This paper proposes the above V-Q method and the sensitivity based method which determines the sensitivity of the reactive power injection of a generator to an injection of reactive power at a load bus to identify the coherent bus groups without drawing the V-Q curve. The load buses are grouped in such a way that if two adjacent buses have similar generator branch sensitivity values within a reasonable range of 5 percent say, it indicates that the system generators will be affected in a similar manner as load is increased at these buses. This sensitivity method of determination of coherent bus groups can be used to improve the voltage stability assessment methods by Schlueter (1998) and Aumullar and Saha (2003)
3.2 Generator Sensitivity Method
Formulation
N bus system is assumed with one slack bus and NV voltage controlled buses.
The load buses are therefore N-1-NV. The equations
[J] ΔX =
P QéD ù
ê ú
êD ú
ë û
--- [1]
ΔX = [J]
-1 P QéD ù ê ú êD ú ë û
--- [2]
X = [
d
, V
The reactive power at the Kth bus is given as
Q
K(X) = V
Kå
V
m(
)
(
)
KM K M
KM K M
G
Sin
B
Cos
d
d
d
d
é
-
ù
ê
ú
ê
-
-
ú
ë
û
---[3]
For PV Bus VK is costant
For Slack Bus
d
k is constant.Linearising QK ie allowing for small deviations
ΔQ
K=
KQ
X
X
é
ù
ê
úD
ê
ú
ë
û
---[4]
Using equation [2] in equation [4]
ΔQ
K=
[ ]
1 T K
Q
P
J
X
Q
-
é
ù
é
ù
ê
D
ú
ê
ú
ê
ú
ê
ú
D
ë
û
ë
û
=
T T
K K
A
B
Q
Q
P
D
E
V
Q
d
æ
öé
ù
é
ù é
ù
ç
÷
ê
D
ú
ê
ú ê
ú
ç
ç
÷
÷
֐
ú
ê
ú ê
ú
è
ø
D
ë
û ë
û
ë
û
--- [5]
Where ABDE are sub matrices of Jacobean Inverse. Since we are considering only reactive power ΔPis made to zero
Hence sensitivity of generator to load buses is given by
=
1 1
np np
K K K
iM jM
i j
M j
Q
Q
Q
B
E
Q
¹d
¹V
=
+
å
å
--- [6]
K Ɛ Generator Buses M Ɛ Load Buses
.
3.2 AlgorithmGenerator Sensitivity Method
1. Obtain power flow solution and the Jacobean matrix [J] which gives the variation of injected powers to voltage magnitude and phase angles using Newton Raphson method in power flow.
J =
P P V Q Q V d dæ¶ ¶ ÷ö
ç ÷
ç ÷
ç ¶ ¶ ÷
ç ÷
ç ÷÷
ç¶ ¶ ÷
ç ÷
ç ÷
çè¶ ¶ ø
2.
Invert the power flow Jacobean[J]
-1[J]
-1=
A B D E æ ö÷ ç ÷ ç ÷ ç ÷ è øWhere ABDE are sub matrices of Jacobean Inverse. Since we are considering only reactive power ΔPis made to zero
Hence sensitivity of generator to load buses is given by
= 1 1
np np
K K K
iM jM
i j
M j
Q
Q
Q
B
E
Q
¹d
¹V
=
+
å
å
--- [6]
3. Invert the power flow Jacobean [J]-1
[J]
-1=
A B D Eæ ö÷
ç ÷
ç ÷
ç ÷
è ø
Linearising QK to get equation [5] and let ΔP=0
4. Determine the sensitivity values of reactive power injection of a generator to an injection of reactive power at a load bus by using equation[6]
5. To identify coherent groups create a matrix X identical to Y bus matrix with all zero elements replaced with the value 1
6. Remove lower triangular section of the X matrix by setting all elements to zero. The X matrix is symmetrical and this lower section is a mirror image of the triangular section.
7. The matrix elements are checked for similar sensitivity values with a range of 5 percent. The other elements not satisfying above condition are removed.
8. The groups of interconnected buses after elimination are coherent bus groups.
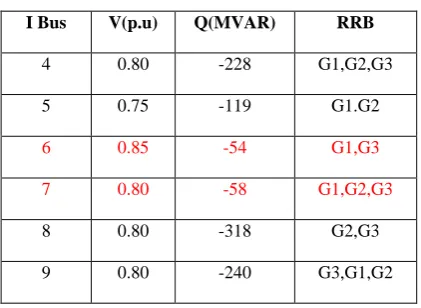
For identification of voltage control areas or coherent bus groups to place STATCOM optimally, V-Q minima has been determined all load buses as shown in Table I along with their associated reactive reserve basins (RRB). The order of generator exhaustion is also shown. For example when a VQ curve is being computed for bus 6 generator G1 was the first to exhaust its Q reserve followed by generator G2 and then G3.In V-Q analysis buses having almost identical V-Q curve nima and reactive reserve basin i.e. the set of generators reaching their Q-limits while reaching minima point have been clubbed together to form voltage control areas near nose point values.
From Table I we can see that buses 6 and 7 have similar V-Q minima and form a group .But RRB for them are different. It is because either bus 6 or bus 7 is not reactive reserve limited.
Tables II A and II B provide data on the V-Q minima found for the Anderson 9 test bus system when different sets of generators have their limits removed. The generator limits are effectively removed by setting their limits say to 12000 MVAR. Generators limits were removed for the set of Non - RRB generators associated with that bus as depicted in Table II A . Then the limits were removed for the RRB generators of that bus and finally for all the generators in the system as shown in Table II B.
Table II A clearly brings out that all the load buses 4 to 9 have same V-Q curve minima for both peak load case and when all Non RRB generators limits are removed .In the peak load case it is to be noted that the none if the generators limits were removed.
Similarly Table II B shows that the V-Q minima is same for all load buses except for bus no 7 for the two cases – when RRB generators limits are removed and when all generators limits are removed. Bus 7 has Q minima of 212 (Mvar) and -295 (Mvar) at 0.6 voltage. This indicates that bus No 7 is not reactive reserve limited. Hence suffer from some degree of transmission limiting.
Thus by determining the reactive reserve margin it is possible to determine which generators have an impact on the maximum permissible loading of a bus .Thus this method of determining coherent bus groups or voltage control areas is very vital for voltage stability assessment. There by the
associated coherent bus group can stabilize the voltage much more effectively than ranking based on a critical bus alone as in PV curve method.
Table III shows the sensitivity values found for the proposed 9 test bus system .Group of coherent buses have been formed as shown in Table IV using generator branch reactive power flow sensitivities to reactive power injection at load buses. The sensitivity values for the three generators G1, G2 and G3 for changes in reactive injection at buses 6 and 7 were found to be within 5% of each other. Hence they are considered to form coherent group and clubbed to form voltage control areas. However, generator branch sensitivities may not remain same for change in operating condition or network topology
[image:5.595.338.549.299.453.2]Therefore the optimal placement of STATCOM from both the methods is chosen as the coherent bus group 6, 7. Since bus 7 is not reactive reserve limited, bus 6 has been identified as the ideal bus placement for reactive power compensation by STATCOM.
Table I: V-Q Curve Minima with RRB for all Load Buses
Table II A: V-Q Analysis with Non RRB Generators
I Bus V(p.u) Q(MVAR) RRB
4 0.80 -228 G1,G2,G3
5 0.75 -119 G1.G2
6 0.85 -54 G1,G3 7 0.80 -58 G1,G2,G3
8 0.80 -318 G2,G3
9 0.80 -240 G3,G1,G2
II A BUS
No
Peak Case
NON - RRB Limits Removed
V(p.u) Q(MVAR)
V(p.u) Q(MVAR)
4 0.8 -228 0.8 -228
5 0.75 -119 0.75 -119
6 0.8 -54 0.8 -54
7 0.8 -58 0.8 -58
8 0.8 -318 0.8 -318
Table II B: V-Q Analysis with RRB Generators
[image:6.595.48.291.100.218.2][image:6.595.48.257.258.447.2]
Table III: Generator Sensitivity Values
Table IV: Coherent Bus Groups
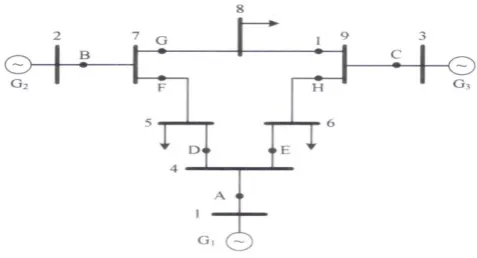
ANDERSON 9 TESTBUS SIMULATIONRESULTS
Fig 5 Anderson and Fouad 9 Bus Test System
The V-Q analysis has been tested on Anderson and Fouad 9 Bus Test System with and without STATCOM as shown in fig 5.
Slack Bus 1 PV buses 2, 3 Load Buses 5, 6, 8 Dummy Load buses 4, 7, and 9
The V-Q curve is usually drawn for post transient period or critical peak load. Hence the load flow results for 120 % peak load were first obtained. The contingency ranking is usually based on bus voltage magnitude for placement of STATCOM. But in this paper from the V-Q curve analysis and sensitivity based method as computed above the optimal placement of STATCOM has been chosen for the coherent bus group 3 at bus 6. Hence computationally allowed 120% peak load at bus 6 is considered for study here. The associated bus with STATCOM is treated as PV bus until violation of limits in the load flow analysis.
[image:6.595.321.534.459.603.2][image:6.595.47.266.485.573.2]
Fig 6 V-Q curve drawn at Bus 6 without STATCOM
Fig 7 V-Q curve drawn at Bus 6 with STATCOM II B
BUS No
RRB Limits Removed
All Generators Limits Removed V(p.u) Q(MVAR) V(p.u) Q(MVAR)
4 0.6 -353 0.6 -353
5 0.6 -225 0.6 -225
6 0.6 -149 0.6 -149
7 0.6 -212 0.6 -295
8 0.6 -355 0.6 -355
9 0.6 -271 0.6 -271
Bus No
III Generator Branch
G1 G2 G3
4 -0.8964 -0.2367 -0.2125
5 -0.7989 -0.4832 -0.2422 6 -0.6489 -0.2376 -0.4567
7 -0.6495 -0.2276 -0.4387
8 -0.2198 -0.6584 -0.5537
9 -0.1998 -0.2011 -0..8764
IV Coherent Bus Groups
Group
No 1 2 3 4 5
Group
Buses 4 5
[image:6.595.316.527.613.738.2]
The V-Q Curve analysis results with and without STATCOM is as shown in Table V. Fig 6 shows the minimum reactive power at minimum voltage i.e. the minima or the nose point of V-Q curve of the sample bus 6 lies below horizontal line at a meagre MVAR (- 0.54) thus clearly indicating reactive power deficiency even at Vmin 0.8. Additional reactive power sources are needed to prevent a voltage collapse. Curves for P=1.2 thus signify reactive power deficiency without STATCOM
Whereas Table V with Fig 7 shows the V-Q Curves drawn at bus 6 for P = 1.2 with STATCOM . The nose point of the curve with STATCOM lies deep below the horizontal line at (-7.559) p.u thus indicating almost no deficiency of reactive power even at critical load for a minimum voltage of 0.6. It depends on the converter ratings.
Table V: V-Q Curve drawn at Bus No 6
4. CONCLUSION
The minimum reactive power at minimum voltage i.e. the minima or the nose point of V-Q curve indicates reactive power deficiency. Additional reactive power sources are needed to prevent a voltage collapse. Curves for P=1.2 thus signify reactive power deficiency without STATCOM. Whereas the V-Q Curve with STATCOM indicates almost no deficiency of reactive power even at critical load for a minimum voltage of 0.6.
With the determination of Reactive Reserve Margin from V-Q Minima analysis it is possible to decide which generators will have an impact on the maximum permissible loading of a bus. This is important information for voltage stability analysis and reactive power compensation.
Thus the novel sensitivity method to determine the coherent groups of load buses based on generator sensitivity values as illustrated in Table III and Table IV shows good agreement with the results shown in The V-Q curve analysis data shown in Table II A and II B. The group buses 6 and 7 have similar V-Q curve minima and sensitivity values. The differences between this method and the method proposed by Schlueter have been thus validated. The proposed method of determination of coherent bus groups can be used to improve the voltage stability assessment methods by Schlueter (1998) and Aumullar and Saha (2003).The optimal placement of STATCOM is chosen accordingly.
5.
REFERENCES
[1] Dushyant Juneja, Student Member, IEEE, Manish Prasad, and M. K. Verma
“
An Approach for Formation of Voltage Control Areas based on voltage stability” 16th National Power Systems Conference , 15th-17th DECEMBER, 2010[2] B.Gao ,G K Morison P Kundur Voltage stability Evaluation using Modal Analysis IEE Transaction Vol 7 Nov 1992.
[3] C. A. Cañizares, "Voltage Stability Indices, Chapter 4, Voltage Stability Assessment: Concepts, Practices and Tools”, IEEE-PES Power Systems Stability Subcommittee Special Publication, August 2002.
[4] Sode-Yome, A. Mithulananthan. N, Lee, K.Y. A Comprehensive Comparison of FACTS Devices for Enhancing Static Voltage Stability IEEE proceedings of Power Engineering Society General Meeting. June 2007 PP 1- 8
[5] Dalian, ChinaArthit Sode-Yome, Nadarajah Mithulananthan, Member, IEEE and Kwang Y. Lee, Fellow, IEEE “Static Voltage Stability Margin Enhancement Using STATCOM, TCSC and SSSC” IEEE/PES Transmission and Distribution Conference & Exhibition: Asia and Pacific, 2005
[6] Enrique Acha, Claudio R. Fuerte-Esquivel, Hugo Ambriz-Perez and Cesar Angeles-Camacho FACTS: “Modelling and Simulation in Power Networks” Wiley & Sons Publications2004.
[7] Enrique Acha, Vasselios Agelidis, Olimpo Anaya and T.J.Miller “Power Electronic Control in Electrical Power Systems Wiley
.
[8] C. R. Fuerte-Esquivel, E. Acha, and H. Ambriz-Perez, “A comprehensive Newton-Raphson UPFC model for the quadratic power flow solution of practical power V
Without STATCOM at 120% Peak load
With STATCOM at 120% Peak load
V Q(Mvar) V Q(Mvar)
0.6 -0.03 Vmin 0.6
Qmin -7.59
0.7 -0.433 0.7 -7.04
0.75 -0.501 0.75 -6.345
0.8 -0.534 0.8 -5.47
Vmin 0.85
Qmin
-0.54 0.85 -4.447
0.9 -0.522 0.9 -3.25
0.95 -0.48 0.95 -1.895
1 -0.425 1 -0.373
1.05 -0.295 1.05 -0.295
1.1 -0.252 1.1 -0.25
1.15 -0.1385 1.15 -0.136
1.2 -0.007 1.2 -0.007
networks,” IEEE Trans. Power Syst., vol. 15, no. 1, pp. 102–109, Feb. 2006
[9] G. K. Morison, B. Gao and P. Kundur, "Voltage stability analysis using static and dynamic approaches", IEEE Transactions on Power Systems, Vol. 8, No. 3, August 1993, pp. 1159–1171
[10] Schlueter R A “A voltage Stability Security Assessment IEEE Transactions of Power Systems” Nov 1998 ,Vol 13 Issue 4 pp 1423-1438.
[11] Craig Aumuller A, Saha TK “Determination of power system coherent bus groups by novel sensitivity-based
method for voltage stability assessment, IEEE Transactions on Power Systems, Vol 18,Issue 3
,
2003 , pp 1157 – 1164.[12] Craig Aumuller A, Saha TK “Analysis of assessment of large scale power system voltage stability by a novel sensitivity based method , IEEE Transactions on Power Systems, Vol 18,Issue 3