Color Image Segmentation using ERKFCM
C. Mythili
V.Kavitha
Assistant Professor Director
University college of Engineering, Nagercoil. University college of Engineering, Nagercoil.
ABSTRACT
Color image segmentation is an important task for computer vision. The segmented RGB color space is not more reliable and accurate for computer vision applications. For this purpose, the proposed approach combines different color spaces such as RGB, HSV, YIQ and XYZ for image segmentation. The combine segmentation of various color spaces to give more accurate segmentation result compared to segmentation of single color space. The images are segmented using K- means clustering and Effective robust kernelized fuzzy c-means(ERKFCM). Two significant criteria namely PSNR (Peak Signal to Noise Ratio) and MSE (Mean square error) are used to evaluate the performance.
Keywords
Color Image segmentation, Color spaces, K-means clustering, ERKFCM and Image Fusion.
1. INTRODUCTION
Image segmentation is an important tool in image processing which is partitioning an image into pixels which are homogeneous with respect to some criterion[3]. It is used for higher level image analysis task such as object recognition, data compression, image retrieval etc[2]. Performance of an image segmentation procedure is known to depend on the choice of the color space. A color space allows one to all the colors perceived by human beings. It provides a standard way to specify a particular color by defining 3D co-ordinate system and a subspace that contains all constructible colors within a particular model. The color of each pixel of an image is characterized by three components R,G and B. It is not more accurate to measure small color difference. In reality they exist a several number of color spaces to represent the color of the pixel. Different color spaces are better for different applications. The common color spaces used for image segmentation are RGB, HSV, YIQ, XYZ and opponent color space. RGB(Red-Green-Blue) is a basic color model for computer graphics. YIQ(Y-luminance,I-hue and Q-saturation) is used in compression applications(both digital and analog). XYZ is used to compare the gamuts of various possible output devices like printers and monitors. HSV(Hue-Saturation-value) color space is often used by people who are selecting colors (eg paints or inks) from a color wheel or palette. These different color spaces are combined using histogram. Segmentation of color images including wavelet, markov random field, Fuzzy c means clustering, K-means clustering etc[4]. .The most widely used clustering method is effective
robust kernel based Fuzzy C Means clustering. It has been utilized widely in remote sensing, medical imaging, geology and astronomy.
Max mignotte[12] presented a new and efficient segmentation strategy based on a markovian Bayesian fusion procedure which aims at combining several segmentation results associated with simple clustering models in order to achieve a more reliable and accurate segmentation result.It [13] proposed an automatic histogram threshold approach based on a fuzziness measures using fuzzy logic concepts, the problems involved in finding the minimum of a criterion function are avoided. Similarity between gray levels is the key to find an optimal threshold. This paper [14] presents a new approach for color texture segmentation using haralick features extracted from color co-occurrence matrices. Fuzzified distance metric is used for achieving texture segmentation. Xiang [15] proposed a new approach for color image segmentation based on SVM and FCM. Firstly the pixel level color feature and texture feature of the image which is used as input of SVM model are extracted via the local homogeneity model and gabor filter. Then the SVM model is trained by using FCM with the extracted pixel level features. Finally the color image is segmented with the trained SVM model. In this paper [16] proposed a fuzzy C-means clustering algorithm that incorporates spatial information into the membership function for clustering. The spatial function is the summation of the membership function in the neighborhood of each pixel under consideration. This proposed method gives a better segmentation result.The paper is organized as follows. In section 2, the details of methodology. In section 3, performance measures are described. In section 4 , the concluding remarks are given.
2. METHODOLOGY
Input Segmented
[image:2.595.84.520.81.150.2]image image
Fig. 1. An overview of the color image segmentation system
2 . 1
P r e p r o c e s s i n g
Digital Cameras which capture images in directly in digital form are more popular now a days .Digital Images are often corrupted by impulse noises. It is caused by sharp and sudden disturbances in the image signal. So the image processing scheme should be one of the important part in any vision application permitting to suppress noise and improve the image performances. This demands to have several filtering schemes such as fuzzy & non-fuzzy are used.
Fuzzy filters provide promising result in image-processing tasks that cope with some drawbacks of non-fuzzy filters. Fuzzy filter is capable of dealing with vague and uncertain information [5]. Sometimes, it is required to recover a heavily noise corrupted image where a lot of uncertainties are present and in this case fuzzy set theory is very useful. Each pixel in the image is represented by a membership function and different types of fuzzy rules that considers the neighborhood information or other information to eliminate filter removes the noise with blurry edges but fuzzy filters perform both the edge preservation and smoothing .Image and fuzzy set can be modeled in a similar way [6]. Fuzzy set in a universe of X is associated with a membership degree. Similarly, in the normalized image where the image pixels ranging from {0, 1, 2... 255} are normalized by 255, the values obtained are in the
interval [0, 1].A fuzzy set is a class of points possessing a continuum of membership grades, where there is no sharp boundary among elements that belong to this class and those that do not. We can express this membership grade by a mathematical function called membership function or characteristic function µA(xi). This function assigns to each
element in the set a membership grade in the interval [0,1].
If X is a collection of objects denoted generically by x, then a fuzzy set A in X is defined as a set of ordered pairs:
A= {(x, µA(x))/x X} (1)
Where µA(x) is called the membership function for the fuzzy
set A. The membership maps each element of X to a membership grade between 0 and 1. In this way, the image is considered as a fuzzy set and thus filters are designed [3]. The results of proposed filtering techniques are shown
infigure2.
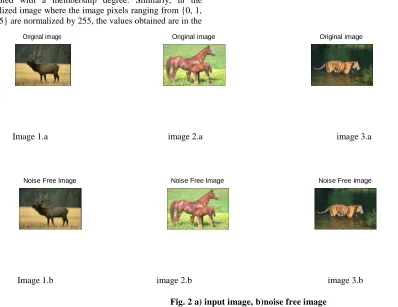
Original image Original image Original image
Image 1.a image 2.a image 3.a
Noise Free Image Noise Free Image Noise Free Image
Image 1.b image 2.b image 3.b
Fig. 2 a) input image, b)noise free image
Clustering technique Conversion
of Different color spaces
Quantization and clustering
[image:2.595.78.476.420.727.2]2 . 2 C o l o r s p a c e c o n v e r s i o n
2.2.1
RGB color space
Many color spaces are in use today. For pictures acquired by digital cameras the most popular is RGB model. RGB is an additive color system based on tri-chromatic theory and nonlinear with visual perception. The space color seems to be the more optimal one for tracking applications. This color space based segmentation is not accurate for computer vision applications[10].
2.2.2
H S V c o l o r s p a c e
The HSV color space (Hue, Saturation, Value) is often used by people who are selecting colors (e.g., of paints or inks) from a color wheel or palette, because it corresponds better to how people experience color than the RGB color space does. The functions rgb2hsv and hsv2rgb convert images between the RGB and HSV color spaces. As hue varies from 0 to 1.0, the corresponding colors vary from red through yellow, green, cyan, blue, magenta, and back to red, so that there are actually red values both at 0 and 1.0. As saturation varies from 0 to 1.0, the corresponding colors (hues) vary from unsaturated (shades of gray) to fully saturated (no white component). As value, or brightness, varies from 0 to 1.0, the corresponding colors become increasingly brighter. Hue defines the color itself. The values for the hue axis vary from 0 to 360 beginning and ending with red and running through green, blue and all intermediary colors. Saturation indicates the degree to which the hue differs from a neutral gray. The values run from 0, which means no color saturation, to 1, which is the fullest saturation of a given hue at a given illumination. Intensity component - lightness or value (HSV), indicates the illumination level. The HSV color space is essentially a cylinder, but usually it is represented as a cone or hexagonal cone (hex cone).
2 . 2 . 3 Y I Q C o l o r s p a c e
The YIQ color space has three components: luminance (Y), hue (I), and saturation (Q). The first component, luminance, represents grayscale information, while the last two components make up chrominance (color information). This was a requirement in the early days of color television when black-and-white sets still were expected to pick up and display what were originally color pictures. The Y-channel contains luminance information (sufficient for black-and-white television sets) while the I and Q channels (in-phase and in-quadrature) carried the color information.
The color conversion of RGB to YIQ is given by
[Y] [0.299 0.587 0.114] [R]
[Q] [0.212 -0.523 0.311] [B]
2.2.4
XYZ color space
The CIE XYZ color space was deliberately designed so that the Y parameter was a measure of the brightness or luminance of a color. It is based on three hypothetical primaries, XYZ, and all visible colors can be represented by using only positive values of X, Y, and Z.. It is hypothetical because they do not correspond to any real light wavelengths. The Y primary is intentionally defined to match closely to luminance, while X and Z primaries give color information. The main advantage of the CIE XYZ space (and any color space based on it) is that this space is completely device-independent
2.3. Quantization
In this paper each image is equally quantized after conversion of color space (for each of the three color channels). From the reduced 125 bin descriptors image the histogram is calculated from each color space. In color image the histogram is expected to give the number of times a particular color has occurred in the image.
2.4. Clustering technique
2.4.1
K-means clustering
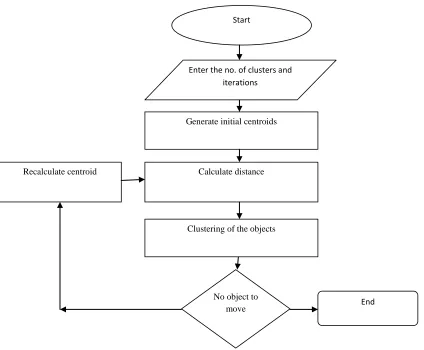
Fig 3. Steps involved in K-means Clustering
1. Partition the objects into k nonempty subsets
2. Compute centers of the clusters of the current partition. The center of a cluster for the k-means algorithm is the mean point of all points in the cluster.
3. Assign each object to the cluster with the nearest center.
4. Go back to Step 2, stop when no more new assignment. The procedure of k- means clustering is depicted in Fig 2 and also results are represented in fig.4
Noise Free Image RGB Segmentation HSV Segmentation
Image 1.a 1.b 1.c
YIQ Segmentation XYZ Segmentation Fused Segmentation Maps
1.d 1.e 1.f
Start
Enter the no. of clusters and iterations
Generate initial centroids
Calculate distance
Clustering of the objects Recalculate centroid
No object to
Noise Free Image RGB Segmentation HSV Segmentation
Image 2.a 2.b 2.c
YIQ Segmentation XYZ Segmentation Fused Segmentation Maps
2.d 2.e 2.f
Noise Free Image RGB Segmentation HSV Segmentation
Image 3.a 3.b 3.c
YIQ Segmentation XYZ Segmentation Fused Segmentation Maps
3.d 3.e 3.f
Fig .4.a) input image, b)RGB segmentation c)HSV segmentation d) YIQ segmentation e) XYZ segmentation and f) Fused image
2.4.2
Effective robust kernelized fuzzy c-means
(ERKFCM)
The combined different color spaces are implemented using Effective robust kernelized fuzzy C-means clustering strategy. The proposed ERKFCM function based kernel function and effective initialization.
The algorithm is composed of the following steps:
1. Get the input data from noise free image.
2. Choose the number of clusters and assign the initial cluster centers using center initialization algorithm.
3. Compute partition matrix
Where Xi-object, Vj-center, K(Xi,Vj)-kernel function
[image:5.595.90.466.78.537.2]4. Update the cluster center.
5. Repeat steps 3 to 4 until the following termination criterion is satisfied where V(present)-V(previous)< . Where
V(present) and V(previous) are the vector of cluster prototypes at present iteration and previous iteration. The output of ERKFCM shown in figure 5.
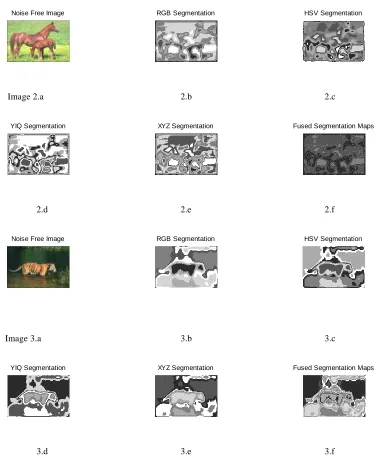
Noise Free Image RGB Segmentation HSV Segmentation
Image 1.a 1.b 1.c
YIQ Segmentation XYZ Segmentation Fused Segmentation Maps
1.d 1.e 1.f
Noise Free Image RGB Segmentation HSV Segmentation
Image 2.a 2.b 2.c
YIQ Segmentation XYZ Segmentation Fused Segmentation Maps
2.d 2.e 2.f
Noise Free Image RGB Segmentation HSV Segmentation
YIQ Segmentation XYZ Segmentation Fused Segmentation Maps
3.d 3.e 3.f
Fig.5 a) input image, b)RGB segmentation c)HSV segmentation d) YIQ segmentation e) XYZ segmentation and f) Fused image
2.5
Fusion
The key idea of the fusion procedure is per fo r med by combining histogram of each color space which is computed by squared fixed-size neighborhood centered around the pixel on different color components. .A histogram based similarity measure derived from the Bhattacharya similarity coefficient.[8] Then fused image is segmented using K-means and ERKFCM. The output of segmenting combined different color space results are better than the segmenting single color space.
3. .
PERFORMANCE MEASURE
The proposed method has been used to segment an image into distinct color- textured regions on the Berkeley segmentation database[7]. The proposed algorithm was applied to all 50 images and the output was compared to human perceptual ground truth. The metrics used for the quantitative evaluation of the proposed algorithm were the following:
The Peak Signal to Noise Ratio (PSNR): It is the value of the noisy image with respect to that of the original image[11]. The PSNR of the color texture based image segmented can be
calculated by using the equation number 2.
PSNR ( Seg.Img, grd. Img) = 10log10 S 2
MSE(Seg.Img,Grd.Img) (2)
Mean Square Error(MSE): MSE of the segmented image can be calculated by using the equation number 3.
MSE(Grd.Img, seg.Img) = (Σi=1 Σj=1 [Grd.Img(i,j)-
Seg.Img(i,j)]2
3NM
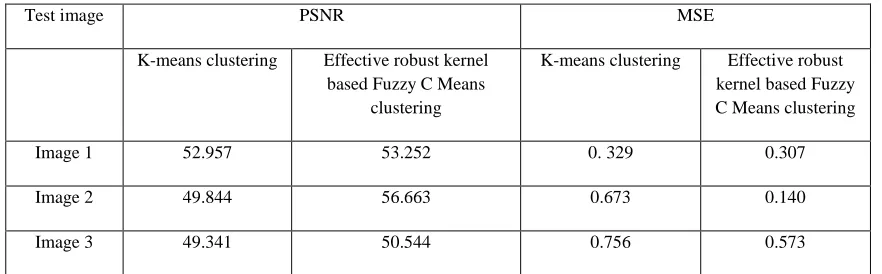
[image:7.595.79.520.506.643.2](3) Where Grd.Img is the ground truth image, Seg.Img is the segmented image of size NxM. The performance evaluations for the three different image segmentation are given in Table I.
Table 1. Performance evaluation for the three different image segmentation
Test image PSNR MSE
K-means clustering Effective robust kernel based Fuzzy C Means
clustering
K-means clustering Effective robust kernel based Fuzzy C Means clustering
Image 1 52.957 53.252 0. 329 0.307
Image 2 49.844 56.663 0.673 0.140
Image 3 49.341 50.544 0.756 0.573
In this above section we compare the segmentation results of the proposed method on natural images obtained from Berkeley segmentation database with K-means clustering and ERKFuzzy C means clustering
4. CONCLUSION
. In this paper, we discussed two different segmentation techniques for Segmentation of different combined color spaces. . The results obtained using ERKFCM technique ensures accuracy and quality of the image as well. It is used for computer vision applications. Hence the method can
be suitable for other techniques available at present. But this technique increases the computational complexity. Our future research will be focused on the construction of other techniques for video images.
5. ACKNOWLEDGMENTS
working as Asst. Prof in the Department of ECE University college of Engineering, Anna university of Technology,Nagercoil. Currently she is pursuing her Ph.D from Anna University Tirunelveli. Her research area includes Image Segmentation, Image compression and Image Enhancement.
Dr.V.Kavitha obtained her B.E degree in Computer Science and Engineering in 1996 from MS University and ME degree in Computer Science and Engineering in 2000 from Maduraikamaraj University. She is University Rank Holder in UG and Gold Medalist in PG. She received PhD degree in Computer Science and Engineering from Anna University Chennai in the year 2009. Right from 1996, she is in the Department of Computer Science & Engineering under various designations. Presently she is working as Asst. Prof in the Department of CSE at Anna University Tirunelveli. In addition she is the Director In-Charge of University College of Engineering. Nagercoil. Currently, under her guidance twelve research scholars are pursuing PhD as full time and part time. Her research interests are Wireless networks, Mobile Computing, Network Security, Wireless Sensor Networks, Image Processing, Cloud Computing .She has published many papers in National and International journals in areas such as Network security, Mobile Computing, wireless network security, and Cloud Computing.
6. REFERENCES
[1] S. Belongie, et. al., Color- and texture-based image segmentation using EM and its application to content- based image retrieval, Proc. of ICCV, p. 675-82, 1998.
[2] M. Borsotti, P. Campadelli, and R. Schettini, Quantitative evaluation of color image segmentation results, Pattern Recognition letters, vol. 19, no. 8, pp.741-48, 1998.
[3] Y. Delignon, et. al., Estimation of generalized mixtures and its application in image segmentation, IEEE Trans. on Image Processing, vol. 6, no. 10, p.1364-76, 1997.
[4] W.Y. Ma and B.S. Manjunath, Edge flow: a framework of boundary detection and image segmentation, Proc. of CVPR, pp 744-49, 1997.
[5] D.K. Panjwani and G. Healey, Markov random field models for unsupervised segmentation of textured images, PAMI, vol. 17, no. 10, p. 939-54, 1995.
[6] L. Shafarenko, M. Petrou, and J. Kittler,Automatic watershed segmentation of randomly textured color images, IEEE Trans. on Image Processing, vol. 6, no.11, p. 1530-44, 1997.[7] J. Shi and J. Malik, Normalized cuts and image segmentation, Proc. of CVPR, p. 731-37, 1997.
[8] H. Stokman and T. Gevers, ―Selection and fusion of color models for image feature detection,
IEE E Trans.Pattern Anal. Mach. Intell., vol. 29, no. 3, pp.371–381, Mar. 2007.
[9] J.-P. Wang, Stochastic relaxation on partitions with connected components and its application to image segmentation, PAMI, vol. 20, no.6, p. 619-36, 1998.
[10] A. Y. Yang, J. Wright, S. Sastry, and Y. Ma,―Unsupervised segmentation of natural images via lossy data compression, Comput. Vis. Image Understand., 2007, submitted for publication.
[11] S.C. Zhu and A. Yuille, Region competition: unifying snakes, region growing, and Bayes/MDL for multiband image segmentation, PAMI, vol. 18, no. 9, p. 884-900.
[12] Max mignotte, A label field fusion Bayesian model and its penalized maximum rand estimator for image segmentation, IEEE transaction on image processing, Vol 19, No.6, June 2010.
[13] Nuno Vieira lopes, pedro A.Mogadouro, Automatic histogram threshold using fuzzy measures, IEEE transaction on image processing, Vol.19, No.1, pp 199-204.
[14] G.Uma maheswari, K.Ramar, D.Manimegalai, V.Gomathi, An adaptive region based color texture segmentation using fuzzified distance, 2011, pp 2916-2924.
[15] Xiang-Yang wang, ting wang and juan bu, Color image segmentation using pixel wise support vector machine classification, Patten recognition, 2011, pp 777-781.