Munich Personal RePEc Archive
A predictive model for e-commerce
consumer expenditure in EC countries
Kovačić, Zlatko
The Open Polytechnic of New Zealand
2 December 2004
A Predictive Model for eCommerce Consumer Expenditure in EC Countries
Dr. Zlatko J Kovačić, The Open Polytechnic of New Zealand, Lower Hutt, New Zealand, [email protected]
Abstract
Describing and predicting consumer expenditure on a country or cross-national level has a long tradition in theoretical and applied economics and econometrics. This paper is a first attempt in describing aggregate eCommerce consumer expenditure among European Commission (EC) countries. After brief introduction of possible theoretical models which explain the variation in eCommerce consumer expenditure among observed countries, a list of important predictors has been discussed. The results generated by regression analysis show that non-traditional factors such as online time (measured by “Average online time per citizen per month”) and consumer lack of confidence, i.e. mistrust (measured by “Effects of security concerns on eCommerce”) are more reliable predictors of aggregate eCommerce consumer expenditure in EC countries than the traditional factors such as disposable income and price of the products.
1. Introduction
In the last decade we have witnessed an explosive growth of the Internet. Although this growth happened on a global scale there are significant differences among countries in terms of how far they went and how fast they have adopted new technology. Various factors influencing Internet diffusion have been considered in several studies. It was confirmed that telecommunication infrastructure (Hargittai, 1999), socio-economic factors (Robinson & Crenshaw, 1999) and cultural values (Maitland & Bauer, 2001) have a significant influence on Internet diffusion among countries. However, from a business perspective, an equally important question would concern the factors which would explain the variation in eCommerce consumer expenditure among countries.
Currently, eCommerce consumer expenditure represents a small but rapidly growing proportion of retail sales. The US Census Bureau of the Department of Commerce (2004) announced on 20 August 2004 that the estimate of US retail eCommerce sales for the second quarter of 2004 was $15.7 billion (seasonally unadjusted), an increase of 23.1% from the second quarter of 2003. Total retail sales for the second quarter of 2004 were estimated at $919.0 billion, an increase of 7.8% from the same period a year ago, which means that in US the eCommerce sales in the second quarter of 2004 accounted for 1.7 percent of total sales.
Similar trends in retail eCommerce sale could be expected in European countries, as was suggested by Korsun, Matthaws, Mehana, Stover & Somwangthanaroj (1999) though they also noted that European trends tend to be two or three years behind the evolution of the Internet in the US. However, because of the differences in telecommunications costs and infrastructure, cultural and language differences and other factors, not all European countries are taking part in the online shopping phenomenon at the same
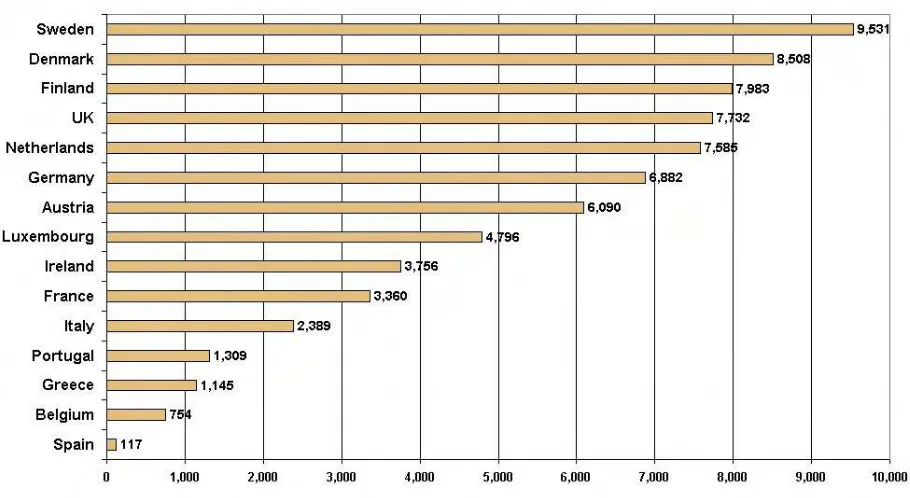
speed. As Figure 1 shows, there is also a considerable amount of variation in eCommerce consumer expenditure among European Commission (EC) countries which requires further research and explanation. This study explores potential factors which could cause variation in eCommerce consumer expenditure among the following 15 country members of the European Commission: Austria, Belgium, Denmark, Finland, France, Germany, Greece, Ireland, Italy, Luxembourg, Netherlands, Portugal, Spain, Sweden and UK. Availability of data was the main reason why this study is limited to the above list of EC countries. The enlargement of the European Union on 1 May 2004 increased the number of member states from 15 to 25. However, data was missing for the most recent members of the EC. Even with such a limited number of countries included, there were a few gaps in the data, as it was described later.
The main objective of this study is to explain the variation in eCommerce consumer expenditure among EC countries. More specifically the data gathered for the paper was used to address the following two questions:
• which model best explains the observed variation in the level of eCommerce consumer expenditure? • what is the relative importance of each factor (traditional and non-traditional) in the model of eCommerce consumer expenditure?
To answer these questions two models of aggregate eCommerce consumer expenditure were introduced. The first model is based on consideration of traditional factors from economic theory and the second model is based on extensive survey carried by the marketing company, Datamonitor and a formula for eCommerce consumer expenditure they have created (E=MC² new formula, 2000).
In the next section a brief discussion of traditional and non-traditional factors that could be used to explain variation in eCommerce consumer expenditure is given together with a specification of the model, i.e. eCommerce consumption function (eConsumption function). The data and methodology section describes definition and data source as well as the statistics and econometrics methods used in this study. The final section reports the results and discusses the implications of these results.
2. Theoretical framework
of real personal consumption is disposable income measured in real per capita terms. What we expect is that on average consumers will increase their consumption as their income increases, where the marginal propensity to consume will be less than unity. As it is common with most macroeconomic theory, the theory of consumption function was presented in terms of individual behaviour, but used to describe aggregate behaviour on a global, country level. An estimation of
aggregate consumption function on country or cross-national level is usually based on time series and/or cross-section (survey) data.
[image:3.595.64.519.147.396.2]What makes eCommerce consumer expenditure analysis different from analysis based on the consumption function?
Fig 1. eCommerce consumer expenditure per 100 inhabitants at the end of 1999 (in €)
First, in the traditional consumption function we have aggregated consumption of the whole population in one country while in the eConsumption function analysis we have aggregated online consumption (or consumer expenditure) for a small portion of the whole population only, those actually involved in eCommerce activities. Second, while in traditional consumption function analysis it makes sense to use real GDP per capita, as an indicator of a country’s disposable income, in eConsumption function it would be preferable to use a portion of a country’s real income earned only by those people involved in online purchasing.
On the other side, basic demand theory as part of microeconomic theory suggests that demand for product is a function of the consumer real income and the relative price of the product. Among other demand factors are prices of other goods, consumer tastes, preferences, advertising, and some other external events. If we adopt the demand theory as a framework for eCommerce consumer expenditure analysis we have to be aware of the following: on the aggregate level eCommerce consumer expenditure is composed of the expenditure on different goods (mostly books, software, music, travel, hardware, clothing and electronics). In other words we don’t have one homogeneous good but rather a basket full of mixed products. Therefore the price of the good is actually a price index for the basket of products. If we don’t know the exact structure/content of this basket then it is
impossible to calculate the price index. What we can do instead is to use the general price level for each country as a proxy for the price index. Or we can use the Internet access price in each country as a proxy price indicator. Also, the consumer real income is usually replaced with country’s real GDP, which means that the definition of real income is related to the whole population rather than only to those involved in online purchasing. What makes this analysis even more difficult is that the basket of products could vary significantly between countries. In other words, even this basket of products could not be treated as a homogeneous product on the aggregate country-level.
The first model of eCommerce consumption function (labelled as “Economic theory” model in Table 3) takes eCommerce consumer expenditure as a dependent variable while the real disposable income and the price level are independent variables. An expansion of the list of independent variables was not considered as an option due to the small sample size. For the same reasons linear functional form has been selected, rather than nonlinear.
secure servers, etc.). Rationale for considering these factors is as detailed below.
Consumers need to become familiar with the concept of online purchasing, the online shopping environment and need to build trust. They don’t want any risk related to the shopping environment and data security on the Internet. Once they become sufficiently confident in their online experience, an increase in online purchasing could be expected.
Time spent online could have a direct impact on eCommerce consumer expenditure. When a consumer spends more time online he/she gains confidence and becomes familiar with the online shopping environment. Then it should be more likely they would start to spend more money online.
Internet penetration in homes is an indicator of Internet diffusion. The more households that are connected to the Internet the more likely it is that they would make an online purchase at some stage. It would be expected that this indicator is positively correlated with other indicators, such as time spent online.
The level of socio-economic development, measured by various socio-economic indicators (education level, general and computer literacy rate, etc.) could have impact on the online purchase. For example, it should be expected that countries with a higher education level and computer literacy rate are more likely to have a higher eCommerce consumer expenditure than countries at the lower level of socio-economic development.
Culture and language, particularly in Europe, could affect the eCommerce expenditure. Consumers in Mediterranean countries such as Italy, Greece, France and Spain prefer to see and feel what they are going to buy before purchasing it.
The use of business-to-consumer (B2C) eCommerce among small and medium enterprises shows diffusion of B2C eCommerce among small and medium enterprises. The more small and medium enterprises that are using B2C eCommerce in their business the more likely there is to be an increase in eCommerce expenditure in that country.
Telecommunications infrastructure (Internet hosts, secure servers, etc.) could be a very important limiting factor for the success of eCommerce diffusion in each country. In the early stages of Internet diffusion, telecommunications infrastructure and accessibility could be one of the major factors which determine whether eCommerce consumer expenditure would spiral or not. Obviously, if the consumers don’t have access to online shops it would be impossible for them to purchase online even if they are willing to do that or have enough resources to purchase the goods.
Based on the results of Datamonitor's (www.datamonitor.com) extensive IMPACT 2000 survey the first eCommerce formula borrowed from Einstein, E=MC², where expenditure (E) is equal to minutes online (M) times confidence-squared (C²) was
developed. The survey reveals that with an increase in Internet experience, consumers gain confidence and subsequently spend more minutes and money online. For the same reason as the first model of eCommerce consumption function (small sample size) only the model with two independent variables was constructed. For the future research, with data for other countries included, other factors could be introduced into the model of eCommerce consumer expenditure. At this stage only the following two independent variables are considered: consumer confidence/trust about data security on the Internet and the time citizens spent online. Contrary to the nonlinear functional form proposed by Datamonitor (E=MC²) linear functional form was used with this model as well as with the first one. This model has been labelled as “Datamonitor” model in Table 3.
3. Data and methodology
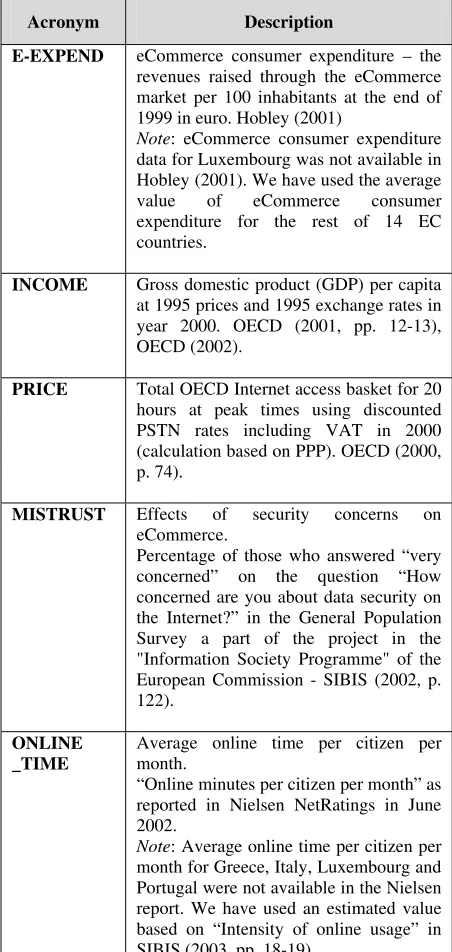
Data for this paper was collected from various sources on the aggregate country-level. Table 1 describes the definition of variables in detail, their acronyms and data sources used.
The dependent variable, eCommerce consumption, is operationalised as the eCommerce consumer expenditure (E-EXPEND). Real disposable income on the country level was measured by GDP per capita at constant price and used in the “Economy theory” model (INCOME). Instead of the general price index on the country level in the “Economy theory” model, Internet access basket (PRICE) was used.
The confidence variable, a theoretical concept in the “Datamonitor” model, was operationalised via a proxy variable. Since the direct measurement of the consumer/citizen confidence/trust was not available, a percent of those who expressed their concern about data security on the Internet (MISTRUST) was used as independent variable in the “Datamonitor” model. Finally, time spent online was measured as the average online time per citizen per month (ONLINE_TIME).
Unfortunately not all data for included variables of the EC countries was available. For example, eCommerce consumer expenditure data was not available for Luxembourg. This figure was replaced with a conservative but simple estimate – the average value of eCommerce consumer expenditure data for the remaining 14 countries. A more serious problem of missing data was seen in the case of “Average online time per citizen per month” series. Data for 4 countries (see the last row in Table 1 for the list) was not available and was estimated based on an alternative data source as was described in the note for the ONLINE_TIME variable.
This research has several limitations. Data for only a small number of countries (15) was used in calculation. As it was mentioned before, that was the main reason for selecting a linear functional form for the eConsumption function in both cases and the reason why a particular method of estimation was used. Also this was the reason why just a limited number of independent variables were considered. There is a need for further research that tests the generalisability of the findings by including data for other countries and additional traditional and non traditional factors (independent variables) to the data set. However, despite these limitations the estimated models give an indication of the impact that traditional and non-traditional variables could have on the eCommerce consumption.
Table 1: Description of variables, acronyms and data sources
Acronym Description
E-EXPEND eCommerce consumer expenditure – the revenues raised through the eCommerce market per 100 inhabitants at the end of 1999 in euro. Hobley (2001)
Note: eCommerce consumer expenditure data for Luxembourg was not available in Hobley (2001). We have used the average value of eCommerce consumer expenditure for the rest of 14 EC countries.
INCOME Gross domestic product (GDP) per capita at 1995 prices and 1995 exchange rates in year 2000. OECD (2001, pp. 12-13), OECD (2002).
PRICE Total OECD Internet access basket for 20 hours at peak times using discounted PSTN rates including VAT in 2000 (calculation based on PPP). OECD (2000, p. 74).
MISTRUST Effects of security concerns on eCommerce.
Percentage of those who answered “very concerned” on the question “How concerned are you about data security on the Internet?” in the General Population Survey a part of the project in the "Information Society Programme" of the European Commission - SIBIS (2002, p. 122).
ONLINE _TIME
Average online time per citizen per month.
“Online minutes per citizen per month” as reported in Nielsen NetRatings in June 2002.
Note: Average online time per citizen per month for Greece, Italy, Luxembourg and Portugal were not available in the Nielsen report. We have used an estimated value based on “Intensity of online usage” in SIBIS (2003, pp. 18-19).
For all calculations in this paper we used the EasyReg software package written by Bierens (2004).
4. Results
[image:5.595.312.558.255.413.2]The Pearson’s correlation coefficients were calculated to test the hypotheses that the eCommerce consumer expenditure correlates with the Gross Domestic Product per capita (INCOME), Internet access basket price (PRICE), consumer lack of confidence in eCommerce/mistrust (MISTRUST) and time citizens spent online (ONLINE_TIME). Results are presented in Table 2. The figure between the brackets shows P -value, i.e. the level of significance. The P-value indicates the likelihood of obtaining a correlation coefficient as large as that observed if it occurred simply from randomness in the data. A low P-value implies that we would probably not observe such a large correlation coefficient from purely random data and the coefficient must be the result of a linear relationship between observed series.
Table 2: Pearson’s correlation coefficients
E-EXPEND
INCOME 0.498
(0.059) INCOME
PRICE -0.324 0.060
(0.238) (0.83) PRICE
MISTRUST -0.561* -0.242 -0.273
(0.03) (0.385) (0.325)
MIS-TRUST ONLINE
_TIME
0.770** 0.260 -0.255 -0.411
(0.0) (0.35) (0.358) (0.128)
** significant at the 0.01 level. * significant at the 0.05 level.
All the correlation coefficients are with the expected signs: PRICE and MISTRUST have a negative sign while INCOME and ONLINE_TIME have positive signs. The strength of relationship between E-EXPEND and ONLINE_TIME is the highest and significant at the 1% level. The positive coefficient suggests that with an increase in the time citizens are spending online in each country a higher level of eCommerce consumer expenditure could be expected. Also, because the corr(E-EXPEND, MISTRUST)= -0.561, the less the users are concerned about data security on the Internet the more they are likely to purchase online.
For the quality of regression analysis it is important to test the correlation between independent variables in each regression model. Results from Table 2 show that among the independent variables (INCOME and PRICE in the first regression model, and MISTRUST and ONLINE_TIME in the second regression model) there is no sign of any significant correlation which suggests that multicollinearity should not be a problem in any of regression models.
correction gives rise to the Heteroskedasticity-Consistent (labelled as H.C. in Table 3) t-values and P-values, which are reported in Table 3.
The results of two other econometric tests have been also reported in Table 3. The Jarque-Bera/Salmon-Kiefer tests test of the null hypothesis that the regression model errors are normally distributed. The null hypothesis is rejected if the value of the test statistic is larger than the critical value. The Breusch-Pagan test tests homoskedasticity of residuals in a regression model. A regression model is homoskedastic if the model errors have a constant conditional variance, given the regressors (independent variables), and is said to be heteroskedastic if not. The null hypothesis is rejected if the value of the test statistic is larger than the critical value. Both tests for each regression model confirm that the regression model residuals are normally distributed and homoskedastic, i.e. confirm the OLS assumptions.
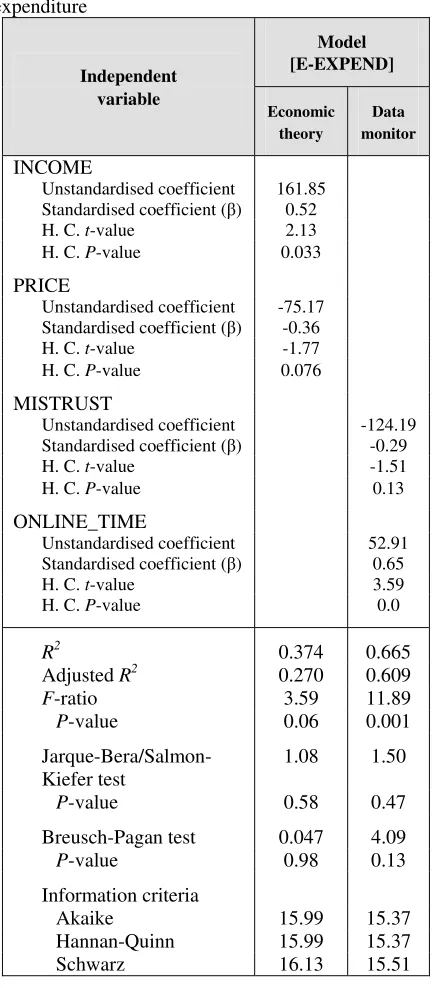
Standardised β coefficients are used to make statements about the relative importance of the independent variables in a regression model. A higher β value means that the particular variable is more important that the others. As the absolute value of the β coefficient for INCOME is larger than the β value for PRICE (0.52>0.36), it can be concluded that INCOME is a relatively more important predictor of eCommerce consumer expenditure than PRICE. t-value for INCOME is significant at the 3.3% level which suggests that this regression coefficient is highly significant, while t-value and appropriate P -value=7.6% for PRICE suggests very weak influence of this independent variable on the dependent variable (E-EXPAND).
In the “Datamonitor” model, ONLINE_TIME is relatively more important predictor of eCommerce consumer expenditure than MISTRUST (0.65>0.29). The regression coefficient for MISTRUST has a P -value over 10% (=13%) suggesting a very weak, if any relationship between this independent variable and the dependent variable (E-EXPAND).
A single point increase of ONLINE_TIME corresponds to increase of 0.65 points in E-EXPEND and a 0.29 point decrease due to increase in MISTRUST. Both coefficients are highly statistically significant.
In Table 3 a few other summary statistics are reported. R2 is a coefficient of determination, which measures the proportion of the variation in the dependent variable “explained” by the regression model, i.e. the "fit" of a regression model, or the strength of the relationship. The adjusted R2 is used as a specification tool to compare regression models with different numbers of independent variables, since inclusion of additional independent variables in the model can never reduce the coefficient of determination.
In the first “Economic theory” model real disposable income and the price level explain jointly 37.4% variation in eCommerce consumer expenditure. The second “Datamonitor” model outperforms the first
[image:6.595.319.537.111.605.2]model explaining 66.5% of variation in eCommerce consumer expenditure by lack of confidence that consumers have about online purchasing (MISTRUST) and the time they spent online (ONLINE_TIME).
Table 3: Regression results for eCommerce consumer expenditure
Independent
Model [E-EXPEND]
variable
Economic theory
Data monitor
INCOME
Unstandardised coefficient 161.85 Standardised coefficient (β) 0.52
H. C. t-value 2.13 H. C. P-value 0.033
PRICE
Unstandardised coefficient -75.17 Standardised coefficient (β) -0.36
H. C. t-value -1.77 H. C. P-value 0.076
MISTRUST
Unstandardised coefficient -124.19 Standardised coefficient (β) -0.29
H. C. t-value -1.51
H. C. P-value 0.13
ONLINE_TIME
Unstandardised coefficient 52.91 Standardised coefficient (β) 0.65
H. C. t-value 3.59
H. C. P-value 0.0
R2 0.374 0.665
Adjusted R2 0.270 0.609
F-ratio 3.59 11.89
P-value 0.06 0.001
Jarque-Bera/Salmon-Kiefer test
1.08 1.50
P-value 0.58 0.47
Breusch-Pagan test 0.047 4.09
P-value 0.98 0.13
Information criteria
Akaike 15.99 15.37
Hannan-Quinn 15.99 15.37
Schwarz 16.13 15.51
0.05 or less as meaningful, that is, statistically significant. For the first model the P-value of the F -ratio is 6% which suggests that the “Economy theory” model shows quite a weak relationship between dependent and independent variables. In case of the “Datamonitor” model the relationship between independent and dependent variables is very strong (P -value<1%).
Finally, three information criteria (Akaike, Hannan-Quinn and Schwarz) were routinely calculated in the EasyReg program. A regression model with smaller value of any of these information criteria would outperform the competitive model. In Table 3 it is clear that the “Datamonitor” model has a smaller value for each of three criteria suggesting its superiority over the “Economic theory” model.
5. Concluding remarks
The present investigation, with all the limitations mentioned before, reveals that eCommerce consumer expenditure is predictable with both “Economic theory” and “Datamonitor” models discussed. It seems that non-traditional factors are more influential on eCommerce consumer expenditure than traditional factors, based on economic theory.
The direct consequences of the main result (the significance of the non-traditional factors in online purchase) are that governments should take an active role in this area via telecommunication policies by creating a stimulative environment for enterprises and consumers. They should consider all the implications that their telecommunication policies could have on access to the Internet. They should encourage investment in telecommunications infrastructure thus making the Internet accessible to everyone. Also, by allowing and stimulating competition on the ISP market, the Internet access price for private use would eventually fall making the Internet affordable to the wider population. The more people go and stay online the more online purchases could be expected in the future.
As was mentioned before, there is a need for further investigation that tests the generalisability of the findings by including other countries data and by expanding the list of independent variables. Also, analysis on the cross-national level should be supplemented by a more detailed survey on the national level which will pick up more detailed information about other factors such as culture.
6. Acknowledgements
I would like to thank John Green, Senior Lecturer in the School of Information and Social Sciences at the Open Polytechnic of New Zealand for valuable comments on the first draft of this paper.
7. References
Bierens, H. J. (2004). EasyReg International. Department of Economics, Pennsylvania State University, University Park, PA.
E=MC² new formula restores hope for B2C eCommerce (2000). Retrieved June 10, 2004, from
http://retailindustry.about.com/library/bl/bl_datam0719.htm.
Friedman, M. (1957). A theory of the consumption function. Princeton: Princeton University Press.
Hargittai, E. (1999). Weaving the Western web: Explaining differences in Internet connectivity among OECD countries. Telecommunications Policy, 23(10/11).
Hobley, C. (2001). Just Numbers: Numbers on Internet use, electronic commerce, IT and related figures for the European Community. The European Commission’s Electronic Commerce Team (Information Society Directorate General). Retrieved May 10, 2004, from http://europa.eu.int/ISPO/eCommerce/documents/Just_ numbers.pdf.
Keynes, J.M. (1936). The general theory of employment, interest, and money. London: Macmillan.
Korsun, D., Matthews, A., Mehanna, L., Stover, A., & Somwangthanaroj, S. (1999). Decision model for forecasting eCommerce opportunities in Europe. White paper. Urban Web.
Maitland, C.F., & Bauer, J.M (2001). National level culture and global diffusion: the case of the Internet. In Ess C. (Ed.), Culture, technology, communication: towards an intercultural global village. Albany, NY: State University of New York Press, pp. 87-120.
OECD (2000). Local access pricing and e-commerce. DSTI/ICCP/TISP(2000)1/FINAL. Retrieved May 10,
2004, from
http://www.olis.oecd.org/olis/2000doc.nsf/linkto/dsti-iccp-tisp(2000)1-final.
OECD (2001). OECD in figures: Statistics on the member countries. OECD Observer.
OECD (2002, February). Main economic indicators.
Robinson, K.K., & Crenshaw, E.M. (1999). Cyber-space and post-industrial transformations: A cross-national analysis of Internet development. Retrieved May 10, 2004, from http://www.soc.sbs.ohio-state.edu/emc/RobisonCrenshawCyber1a.pdf.
SIBIS (2002). General population survey basic data. Retrieved June 10, 2004, from http://www.empirica.biz/sibis/files/SIBIS_GPS_Basic
Data_Survey.pdf.
SIBIS (2003). SIBIS pocketbook 2002/03. Retrieved
June 10, 2004, from http://www.empirica.biz/sibis/files/Sibis_Pocketbook_
updt.pdf.
U.S. Census Bureau of the Department of Commerce (2004). Retail 2Q, 2004 E-commerce report. Retrieved