Dynamic k-NN with Attribute Weighting for Automatic
Web Page Classification (Dk-NNwAW)
Manan Gupta
B.E. (Hons.) Computer Science
Birla Institute of Technology and Science Pilani-Dubai B-1453 Indira Nagar
Lucknow, India
ABSTRACT
The Internet has been in a state of explosive expansion over the last decade and a half. The addition of numerous web pages to the World Wide Web by a vast array of authors on a plethora of topics leaves behind the problem of organizing these web pages in order to improve search results leading to more relevant information. In this paper, a modified attribute weighted dynamic k-Nearest Neighbor classification algorithm, using k-Means clustering, is proposed. This presents a solution to the automatic classification of Web Pages on the WWW, supported by the adaptive dynamic nature of the algorithm. Web pages are classified based on the class distribution of the pages in their neighborhood. Attribute weighting is used primarily to improve classification accuracy in cases of imbalanced class distribution. Empirical results observed show good classification accuracy, while at the same time, improving on other shortcomings of the traditional k-NN classification model.
General Terms
Your general terms must be any term which can be used for general classification of the submitted material such as Pattern Recognition, Security, Algorithms et. al.
Keywords
Keywords are your own designated keywords which can be used for easy location of the manuscript using any search engines.
1.
INTRODUCTION
Web Page Classification, also known as Web Page Categorization, can be defined as the process of assigning a category or categories to web pages. Some examples of such categories are Sports, Music, News, et cetera; and these categories can further be divided into sub-categories, or can be combined to form mixed categories, for example, Sports News. Some of the common uses of web page classification are the maintaining of web-page directories, providing better search results, web-content filtering, helping question & answer systems, et cetera. Web page classification differs from text classification in the manner that web pages, comprise largely of text, but contain multiple implementations of multimedia elements like audio, video, and pictures. This presents a challenge in itself, and thus demands a more flexible and adaptive approach when classifying web pages. Web page classification is divisible into many different problems, out of which three important types are functional classification, subject classification, and sentiment classification. Functional classification classifies on the basis of the page’s content as a homepage, or a login page, or similar pages; whereas subject classification uses the page content to classify the page, for example as a business, education, or a similar page; and sentiment classification focuses on something like the author’s tone or attitude. The
proposed classification algorithm will focus on subject classification.
Many classification algorithms, including Bayes algorithm, Support Vector Machine algorithm (SVM), k-nearest neighbor algorithm (KNN), decision tree algorithms, et cetera are widely used for web page classification. There are mainly two categories under which classification algorithms lie – lazy and eager. As opposed to an eager classifier, the lazy classifier does not build a model until a new training sample has been received. The k-Nearest Neighbor, or k-NN, algorithm is an example of a lazy algorithm. It has been used, time and again, by many researchers, and has furnished good results on a plethora of data sets.
K-NN is used widely because of its simplicity and its effectiveness. One of the most important reasons why k-NN is fit for an adaptive approach is because whenever little information is present about the data distribution, k-NN is particularly effective. It is also free from constraints of probability densities. K-NN works by creating a neighborhood around the test sample, which is scanned for existing training samples, which are then counted and grouped on the basis of their class. The test sample, then, is assigned to the most represented class in its neighborhood. K-NN is heavily dependent on two particular factors; firstly, the similarity function with which to weigh the neighborhood samples, secondly, the value of k chosen. In this paper, we will improve upon the second feature, i.e. selection of the value of k. One more noteworthy feature is the inclusion of Attribute Weighting to k-NN. The presence of unbalanced generally impacts classification accuracy of an algorithm. Attribute weighting aims to improve the accuracy in such cases, where the majority class often consists of a large portion of all the training samples, particularly in cases of text classification. This paper will make the use of a modified version of the k-NN algorithm in order to improve upon Automatic web page classification. The rest of the paper is organized as follows: Section 2 will summarize the various attempts at improvement of web page classification, and, at the same time, also mention some of the changes that have been made to the traditional k-NN algorithm in order to counter its shortcomings and improve upon its drawbacks. Section 3 will elucidate a detailed description of the proposed work underlying the dynamic modified k-NN for automatic web page classification. Section 4 will describe the experiments conducted, and the results obtained. Section 5 will present the conclusion and also the future work possible.
2.
RELATED WORK
2.1
Web Page Classification
experimenting. The increase in the number and variety of web pages has not only made the task of developing a useful method more difficult, but also created new problems of its own. One such problem is the classification of web pages in directory style search-engines such as Yahoo!, Open Directory Project (ODP) or ISIZE, where web pages are categorized according to hierarchies. Manually sorting through, and classifying such webpages is a strenuous, and costly task which is becoming more difficult by the second because of the constantly increasing size of the World Wide Web.
Pre-processing is an important part of the web page classification process. This leads to an improvement in the quality of the results obtained post data mining. This also helps reduce the complexity and cost of the classification algorithms that follow. A method known as feature selection is particularly helpful for pre-processing, and various feature selection methods have been discussed in [1][2][3][4][5][6]. Structural webpage classification used to classify web pages into personal, information and research categories is discussed in [7].
Various studies on webpage classification have contributed to improving the applications of webpages through the use of various machine learning algorithms like support vector machines, naïve bayes, k-nearest neighbor, et cetera[8]. One such study helps eliminate inconsistencies arising due to small webpages, based on methods where the neighborhood of the test sample is expanded, and its references are taken into account in [9]. Despite such studies, attempts to provide supervised automatic web page classification have been largely limited.
2.2
K-Nearest Neighbor
The simplicity and robustness of k-NN has been evident, and has been discussed already. The paper focuses on one of the most important factors of k-NN, namely, the selection of the value of k. Various experiments using different adaptations of the traditional k-NN to both improve its accuracy, and address its shortcomings have been researched in [10].
With the increasing variety of web pages, and the complex nature displayed by these web pages, a dynamic value of k is of ever increasing importance. A version of dynamic k-NN using a sequential form of k has been discussed in [11]. Another study on k-NN using a dynamic k has been used for text categorization in [12]. This study tries to eliminate imbalanced data distribution by selecting a different value of k for each category.
[13][14]discuss methods where neighbor weighting is used for unbalanced text classification. Distance Weighting and Attribute Weighting have been researched on and tested in order to improve classification in [15][16][17]. K-means clustering has been used in combination with Support Vector Machines (SVM) in [18]. More attempts to successfully classify text-based data using clustering have been used in [19][20]. Parvinet. al. developed a method to improve the low accuracy of k-NN by developing M-kNN (Modified k-NN) by computing the Validity or training samples, and other similar techniques, a technique discussed in [21]. In this experiment, data sets obtained from the UCI Repository [22] were experimented on. A detailed study conducted on K-means clustering can be referred to in [23]. All these researches are common in that they improve the accuracy of the k-NN classifier, whereas only very few of them try to curb the cost and complexity associated with k-NN.
In short, the research conducted will try to reduce some of the common issues with k-NN, which are:
1. The selection of the value of k, which will also include the dynamic selection of k.
2. Trying to curb the effect of imbalanced class distribution by methods such as attribute weighting.
3.
PROPOSED WORK
The Web Page Classification is done in two steps: 1.) Pre-processing, 2.) Classification. Both these steps are discussed in detail in the following sections:
3.1
Pre-Processing
Pre-processing is dependent on many factors, such as feature selection, which aims to reduce the high degree of complexity of webpages in order to minimize the time taken to build the classifier model. Mangaiet. al. stated these pre-processing steps in [24]. The pre-processing steps are briefly described as follows:
1. Convert each web page to a text file.
2. Extract the best features from each web page and construct a web page feature matrix using the term frequency and inverse document frequency (tf−idf) measures.
3. Remove web pages which have all feature weights as zero.
4. Identify and eliminate the duplicate and conflicting web pages.
3.2
Dynamic k-NN
The classification of the pre-processed webpages consists of many different steps. These are:
3.2.1
K-means Clustering
K-means clustering is a preliminary step to assist the process of the automatic selection of a dynamic value of k. k-means clustering is done by first randomly selecting k samples as ‘centroids’ from the training set. Then, follow these two steps: 1. All the training instances are assigned to the closest centroid by measuring their distance from the centroids. Generally, the distance measure is taken to be the Euclidean distance between two points. 2. After the last step, the centroids are moved to the
center of the training instances assigned to it. This step repeats until no more change is observed in the newly formed clusters.
The k-means clustering was done in Weka, with the option of classes to clusters evaluation set to enabled.
3.2.2
Number of Clusters
The most common methods involving the number of clusters are given below. The three different methods are:
1. Number of clusters was taken equal to the number of classes,
2. he Rule of Thumb, which says that (co. of clusters)
, where n is the number of objects (data points or records),
3. he Elbow Method, which calculates the percentage of variance as a function of the number of the clusters. Here, number of clusters, , where Z is the total number of non-zero values.
3.2.3
Forming the Neighborhood
many prominent researchers. Also, the value of k for this particular classification model is based on the dynamic nature of k, which has been a relatively lesser researched field. However, a good algorithm to calculate the value of k will take advantage of the most subtle points of the traditional k-NN algorithm.
This was achieved by taking the help of the k-means clustering done earlier in the classification process. Since k-means retains most of its properties when data sets are sufficiently large, and the divergence among the test data is manageable. Secondly, pre-processing also helped in distancing the class distribution of the training samples, by removing redundant features.
The creation of the neighborhood is done primarily by finding the distance of the test instance with the various cluster centroids, and calculating the mean distance of the total distance. Thus, a circle of radius ‘r’ is formed around the test instance, where r is the mean distance of the test instance to the various cluster centroids. The formula is shown below:
Where,
is the number of clusters formed, is the total number of attributes,
is the attribute weight of the corresponding attribute, and , are the values of the attributes corresponding to . The use of attribute weighting helps keep the imbalanced class distribution at bay, and thus, reduces the creation of a large neighborhood. Although the mean distance might, by no means, represent the best possible solution, through trial and error, it represented a good fit for the neighborhood selection problem. However, there lies enormous scope for further research in the same area.
3.2.4
Attribute Weighting
Attribute weighting is an effective measure when dealing with imbalanced class distribution. Attribute weighting assigns weights to the different attributes of an instance by measuring the importance of the role of each attribute by calculating the information gain with respect to to the class of the instance. Attribute Weighting was done with the help of Weka by using the InfoGainAttributeEval method. The standard formula for the InfoGainAttributeEval method is given below:
InfoGain(Class,Attribute) = H(Class) - H(Class | Attribute)
3.2.5
Distance Calculation
All the distances that are calculation during the classification process are standard Euclidean distances, with the help of Attribute Weighting. An example for the same goes like this:
Where,
is the distance between points and , is the total number of attributes,
is the attribute weight of the attribute corresponding to i, and
, are the values of the attributes corresponding to.
3.2.6
Majority Voting
Last, but not the least, majority voting was conducted to determine the test instance’s similarity to the class. In majority voting, the k votes are evaluated based on the number of votes assigned to the test instance from each class.
The class with the highest number of votes wins the contest, and the test data is accordingly assigned to the corresponding class.
4.
EXPERIMENTS AND RESULTS
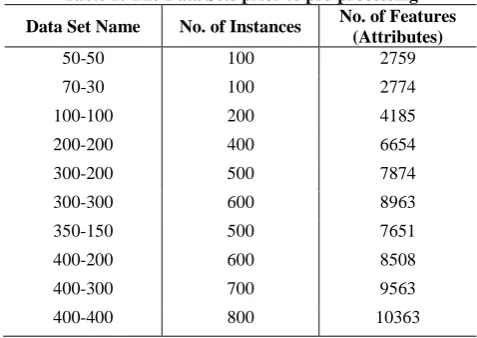
[image:3.595.308.547.245.414.2]Experiments were conducted on a benchmarking data set called WebKB [25]. This data set is a collection of webpages obtained from the Computer Science (C.Sc.) departments of universities in the United States. The pages were manually classified into the following categories - student, faculty, staff, department, course, project and others. For the analysis of the proposed work, course web pages are considered as positive examples and non- course web pages as negative examples. Table 1 displays these data sets before pre-processing, in the form that they were obtained from WebKB:
Table 1: The Data Sets prior to pre-processing
Data Set Name No. of Instances No. of Features (Attributes)
50-50 100 2759
70-30 100 2774
100-100 200 4185
200-200 400 6654
300-200 500 7874
300-300 600 8963
350-150 500 7651
400-200 600 8508
400-300 700 9563
400-400 800 10363
[image:3.595.308.546.572.767.2]The data sets shown above consisted of a variety of sizes of positive and negative examples chosen for the study. For example, the data set 350-150 indicates 350 instances belonging to the positive set, i.e. class ‘Course’, and 150 examples of negative classes, i.e. classes other than Course. The second column indicates the no. of instances in their entirety, prior to pre-processing. The third column shows the total no. of Attributes, or Features, before pre-processing. After pre-processing was performed, the resulting data set turned into highly refined images of their previous states. Table 2 shows the data sets post pre-processing. As is evident, there is a huge reduction in the total number of features, and also a reduction in the number of instances.
Table 2: The Data Sets after pre-processing
Data Set Name
No. of Instances
No. of Features (Attributes)
Reduction in no. of Features
(per million, approximately)
50-50 38 5 1.81
70-30 56 5 1.80
100-100 92 6 1.43
200-200 291 13 1.95
300-200 298 9 1.14
300-300 414 14 1.56
350-150 391 13 1.70
400-200 432 15 1.76
400-300 557 17 1.78
The dimension reduction resulting from a rigorous pre-processing method was necessary to ensure good results during classification. It served many purposes, such as:
1. Reduction in learning time, 2. Reduction in memory consumption,
3. Better suited for attribute weighting, and also for clustering.
After the pre-processing was complete, as already explained above, the data was taken through various steps, which are:
1. Clustering through 3 different methods, 2. Neighborhood size selection,
3. Attribute Weighting, and 4. Simple Majority Voting.
Although experiments were conducted on the same data sets without attribute weighting too, the results proved that attribute weighting provided the classification process with an undeniable edge.
[image:4.595.309.548.72.286.2]Firstly, the numbers of clusters were obtained by using the three methods used for clustering. Clustering was done on the data sets after performing an 80-20 percentage split on the Data Sets. This 80-20 split divided the data set into 80% training instances, and 20% testing instances. For example, the data set 100-100 contains 73 instances. After the 80-20 percentage split, 74 instances were used to train the classifier, and the remaining 18 were used for testing, i.e. classification. Table 3 shows the results for the ratio of training sample to testing samples, and also the number of clusters obtained as per each of the 3 methods:
Table 3: Number of clusters after applying the three different Clustering methods
File Size
Ratio of Training Samples to Test Samples
No. of Clusters =
No. of Classes
Rule of Thumb
Elbow Method
50-50 30:8 2 5 2
70-30 45:11 2 7 2
100-100 74:18 2 7 2
200-200 233:58 2 15 2
300-200 239:59 2 15 2
300-300 313:78 2 18 3
350-150 331:83 2 18 3
400-200 346:86 2 19 3
400-300 446:98 2 21 3
400-400 468:117 2 22 3
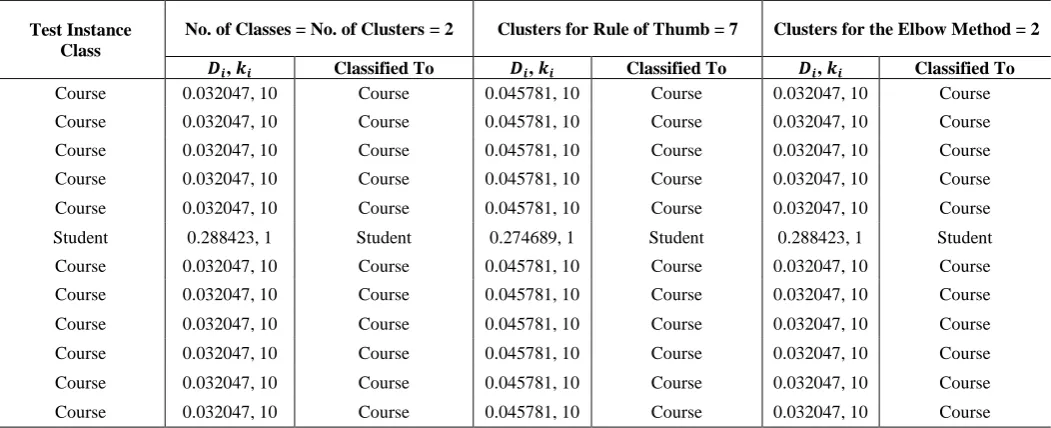
[image:4.595.38.564.393.607.2]Next, the neighborhood sizes for each of the data sets were computed using the formula described in Section 3. Due to space limitations, only the neighborhood sizes of the test instances for the data set 70-30, along with the classes to which each test instance was classified to, are shown, in Table 4:
Table 4: An example of the neighborhoods created for Test Samples for the Data Set 70-30
Test Instance Class
No. of Classes = No. of Clusters = 2 Clusters for Rule of Thumb = 7 Clusters for the Elbow Method = 2
, Classified To , Classified To , Classified To
Course 0.032047, 10 Course 0.045781, 10 Course 0.032047, 10 Course
Course 0.032047, 10 Course 0.045781, 10 Course 0.032047, 10 Course
Course 0.032047, 10 Course 0.045781, 10 Course 0.032047, 10 Course
Course 0.032047, 10 Course 0.045781, 10 Course 0.032047, 10 Course
Course 0.032047, 10 Course 0.045781, 10 Course 0.032047, 10 Course
Student 0.288423, 1 Student 0.274689, 1 Student 0.288423, 1 Student
Course 0.032047, 10 Course 0.045781, 10 Course 0.032047, 10 Course
Course 0.032047, 10 Course 0.045781, 10 Course 0.032047, 10 Course
Course 0.032047, 10 Course 0.045781, 10 Course 0.032047, 10 Course
Course 0.032047, 10 Course 0.045781, 10 Course 0.032047, 10 Course
Course 0.032047, 10 Course 0.045781, 10 Course 0.032047, 10 Course
Course 0.032047, 10 Course 0.045781, 10 Course 0.032047, 10 Course
where is the neighborhood size of the corresponding Test Instance, is the number of neighbors of the corresponding Test Instance As you can see, no matter what the number of clusters was,
the test instances were classified with 100% accuracy. Such an accuracy is possible mainly in smaller data sets, and whereas a bigger data set could have provided a better view of the impact of the clustering mechanism, displaying the results for a bigger set was outside the scope of the space available. After evaluating the number of clusters and calculating the neighborhood sizes for all the test instances, the final step of classification was carried out. It should be kept in mind that the proposed dynamic k-NN is a method for calculating a dynamic value of k. Therefore, comparison with the
Table 5: The resulting classification accuracies of the various clustering methods for the WebKB Data Sets when using the Dk-NNwAW Classification Algorithm
Data Set Name No. of Classes = No. of
Clusters (%) Rule of Thumb (%) Elbow Method (%)
50-50 100.00 100.00 100.00
70-30 100.00 100.00 100.00
100-100 94.44 94.44 94.44
200-200 86.20 86.20 86.20
300-200 98.30 89.83 98.30
300-300 92.77 91.56 92.77
350-150 96.15 94.87 94.87
400-200 90.69 87.21 90.69
400-300 95.72 89.74 95.72
400-400 92.30 90.19 94.11
Average Accuracy (%) 94.66 92.40 94.71
Two of the methods of clustering, namely, Classes = Clusters, and the Elbow Method outperformed the Rule of Thumb. However, it can be noted that the enormous increase in the number of clusters in the Rule of Thumb method imbalances the neighborhood creation method. Therefore, a few experiments were carried out on the Rule of Thumb clustering method by reducing the area of the neighborhood created. This led to a dramatic improvement in the results. As I already asserted, the creation of the neighborhood is a process wherein, arbitrarily, the mean distance of the test instance from all the clusters is taken into calculation. However, taking into account all the factors that are important while creating a dynamic neighborhood can surely have an impact on the area selection, which in turn, can provide good accuracy results. I will provide you with an example of the values of k that were dynamically selected with the algorithm designed. These values will be shown for the data set 300-200, since it is neither a small set, nor a big set; and thus, can adequately represent the process of k value selection. The values of k obtained are shown in a paragraph form, separated by a comma for every test instance, here:
Data Set 300-200 (Values of k) : {99, 108, 27, 127, 101, 121, 91, 83, 27, 35, 111, 127, 60, 125, 110, 82, 81, 45, 117, 85, 90,
84, 98, 109, 81, 92, 114, 36, 97, 94, 32, 90, 100, 98, 127, 96, 45, 36, 95, 45, 85, 102, 81, 103, 82, 115, 108, 84, 100, 116, 60, 36, 99, 109, 109, 96, 103, 104, 125}.
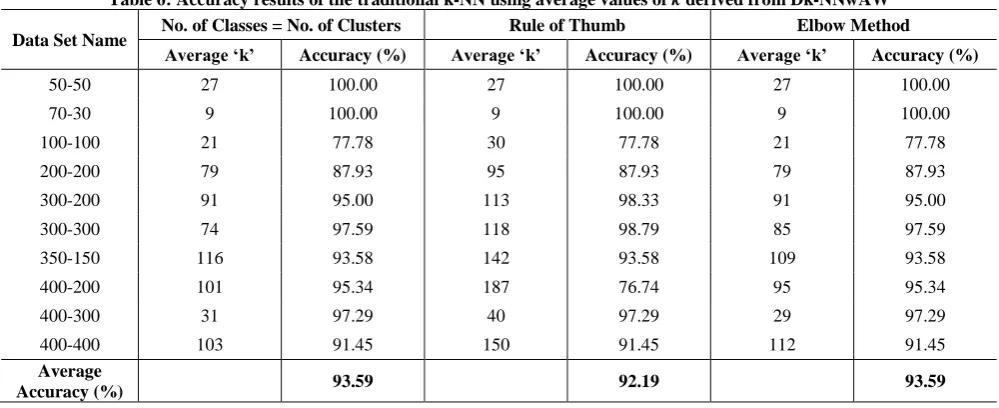
It is plainly visible that the values of k obtained range from as low as 27 to as high as 127. And, in fact, these values are pretty much evenly distributed, with high values occurring almost as much as low values, with many other values occurring between them. Comparing such a method with the traditional k-NN would not only be impractical, but would also present a situation where choosing a static value of k would be a problem. For example, choosing k as 20 or taking it as 120 or, let’s say 60, would have to be well-informed, and justified. Therefore, instead of selecting random values of k for the traditional k-NN, I decided to take the average of all the values of k for a test file. This average value of k was then used as the k for the traditional k-NN and the classification results were noted down. This process was separated for each of the 3 clustering methods; since the average values of k differed by a notable margin for each of these methods. Table 6 shows the accuracy results when using the traditional k-NN having its k set according to the method described above:
Table 6: Accuracy results of the traditional k-NN using average values of k derived from Dk-NNwAW
Data Set Name No. of Classes = No. of Clusters Rule of Thumb Elbow Method
Average ‘k’ Accuracy (%) Average ‘k’ Accuracy (%) Average ‘k’ Accuracy (%)
50-50 27 100.00 27 100.00 27 100.00
70-30 9 100.00 9 100.00 9 100.00
100-100 21 77.78 30 77.78 21 77.78
200-200 79 87.93 95 87.93 79 87.93
300-200 91 95.00 113 98.33 91 95.00
300-300 74 97.59 118 98.79 85 97.59
350-150 116 93.58 142 93.58 109 93.58
400-200 101 95.34 187 76.74 95 95.34
400-300 31 97.29 40 97.29 29 97.29
400-400 103 91.45 150 91.45 112 91.45
Average
[image:5.595.48.548.558.762.2]5.
CONCLUSION AND DISCUSSION
When compared to the traditional k-NN, Dk-NNwAW outperforms the former. This is primarily due to the absence of the dynamic nature of k in the traditional k-NN. A prime observation can be made from comparing Table 5 and Table 6,where it can be seen that consistency is an attribute that can be rightly assigned to Dk-NNwAW. Whereas the traditional k-NN provides a rather low accuracy for a few data sets, Dk-NNwAW does not; demonstrating that the traditional k-NN cannot adapt to changes in the data’s spatial distribution as quickly as Dk-NNwAW. This leads to the conclusion that the dynamic value of k used has some role in the play.Therefore, I will assert that Dk-NNwAW has tremendous potential for growth. In addition to being consistent, its classification results can be greatly improved by further research into some of its most basic areas, such as the neighborhood size, use of validity, and the clustering process. To conclude, I would like to say the following. The proposed dynamic k-NN for Automatic Web Page Classification provides good results, in the range of 94%-95% accuracy. The steps of pre-processing, such as feature selection, and tuning, provide a good foundation for the k-means clustering algorithm, wherein the clusters created were sufficiently divergent to allow for the neighborhood creation to take place. Also, attribute weighting was particularly effective in minimizing accuracy loss due to imbalanced classes, while at the same time, allowing for the size of the neighborhoods to be large enough. Hence, an appropriate name for the proposed method can be Dynamic k-NN with Attribute Weighting for Automatic Web Page Classification (Dk-NNwAW).
Also, no additional steps to increase complexity have been implemented in the proposed method. Therefore, it exhibits the same computational complexity as the traditional k-NN. As far as further research in the area is concerned, let me guide you through a quick recap of what we have already discussed:
1. Neighborhood Size: As discussed, the mean distance is not a perfect solution, by any means. For example, reducing the neighborhood size for the Rule of Thumb method of clustering sometimes provided results much better than the other 2 methods of clustering.
2. Validity: Many researchers have pre-evaluated their training samples by using a measure known as Validity or Purity. This solution looks promising, and can be tried out.
3. Not much thought was given to which clustering method to use. K-means clustering was a good fit, and complemented the k-NN algorithm at certain weak spots. Therefore, other methods of clustering may be used, and could end up improving Dk-NNwAW.
4. Methods to incorporate similarity measures other than the standard Euclidean distance can also be experimented with.
6.
ACKNOWLEDGEMENTS
My thanks to the experts who have contributed towards the development of this template. This includes all the researchers who have spent invaluable time studying the behavior and characteristics of machine learning algorithms, and the importance of classification in today’s world. Special thanks also to Ms. Alamelu Mangai,Mr. V. Santhosh Kumar, and Mr. B. Vijay Kumar, without whose guidance and help, this research would not have attained the same success.
7.
BIBLIOGRAPHY AND REFERENCES
[1]Wakaki T., Itakura H., and Tamura M., Rough Set-Aided Feature Selection for web page classification, In Proceedings ofIEEE/WIC/ACM International Conference on Web Intelligence, pp. 70-76, 2004.
[2]Xu Y., and Wang H., A new Feature Selection method based on support vector machine for text categorization, International Journal of Data Analysis Techniques and Strategies, Inderscience publishers, vol. 3, no. 1, pp. 1-20, 2011.
[3]Devi M. I., Rajaram R., and Selvakuberan K., Generating best features for web page classification, Webology, vol. 5, no. 1, Article 52, 2008.
[4]Chih-Ming Chen, Hahn-Ming Lee, and Yu-Jung Chang, Twonovel feature selection approaches for web page classification,Expert systems with Applications, vol. 36, issue 1,pp.260-272, 2009.
[5]Peng X., Ming Z., and Wang H., Text learning andHierarchialFeature Selection in Web page Classification,LNCS, Advanced Data Mining and Applications, vol. 5139, pp. 452-459, 2008.
[6]Qi X., and Davison B. D., Web Page Classification: Features and Algorithms, ACM Computing Surveys, Vol. 14 Issue 2, Article 12, 2009.
[7]Asirvatham A. P., and Ravi K. K., Web Page Classificationbased on Document Structure, Awarded Second Prize inNational Level Student Paper Contest conducted by IEEEIndia Council,2001.
[8]Tsukada M., Washio T., and Motoda H., Automatic Web-Page Classification by Using Machine Learning Methods, WI '01 Proceedings of the First Asia-Pacific Conference on Web Intelligence: Research and Development, pp. 303-313, 2001.
[9]Materna J., Automatic Web Page Classification, Recent Advances in Slavonic Natural Language Processing, pp. 10, 2008.
[10] Jiang L., Cai Z., Wang D., and Jiang S., Survey of Improving K-Nearest-Neighbor for Classification, In Proceedingsof the Fourth International Conference on Fuzzy Systemsand Knowledge Discovery (FSKD ’07), vol. 1, pp. 679-683,2007.
[11] Ougiaroglou S., Nanopoulos A., Papadopoulos A. N., Manolopoulos Y., and Welzer-Druzovec T., Adaptive k- Nearest Neighbor Classification Based on a Dynamic Number of Nearest Neighbors, ADBIS'07 Proceedings of the 11th East European conference on Advances in databases and information systems, pp. 66-82.
[12] Baoli L., Shiwen Y., and Qin L., An Improved k-Nearest Neighbor Algorithm for Text Categorization, In Proceedings of the 20th International Conference on Computer Processing of Oriental Languages, Shenyang, China, 2003.
[14] Eui-Hong Han, Karypis G., and Kumar V., Text Categorization Using Weight Adjusted k-Nearest Neighbor Classification, 1999.
[15] Wu J., Cai Z., and Gao Z., Dynamic K-Nearest Neighbor with Distance and Attribute Weighted for Classification, 2010 International Conference On Electronics and Information Engineering (ICEIE), vol. 1, pp. 356-360, 2010.
[16] He Z., Xu X., and Deng S., Attribute Value Weighting in k-Modes Clustering, Expert Systems with Applications, Vol. 38 Issue 12, pp. 15365–15369, 2011.
[17] Frazee A. C., Hathcock M. A., and Bates Prins S. C., Distance Functions And Attribute Weighting In a k-Nearest Neighbors Classifier with an Ecological Application, Electronic Proceedings of Undergraduate Mathematics Day, Vol. 4 Issue 3, pp. 1-13, 2010. [18] Srisawat A., Phienthrakul T., and Kijsirikul B.,
SV-kNNC: An Algorithm for Improving the Efficiency of k-Nearest Neighbor, 9th Pacific Rim International Conference on Artificial Intelligence Guilin, China, Vol. 4099, pp. 975-979, 2006.
[19] Yong Z., Youwen L., and Shixiong X., An Improved KNN Text Classification Algorithm Based on Clustering, Journal of Computers, Vol. 4 Issue 3, March 2009.
[20] Kyriakopoulou A., and Kalamboukis T., Text Classification Using Clustering, ECML-PKDD Discovery Challenge Workshop, 2006.
[21] Parvin H., Alizadeh H., and Minaei-Bidgoli B., MKNN: Modified K-Nearest Neighbor, Proceedings of the World Congress on Engineering and Computer Science (WCECS), October 22 - 24, 2008.
[22] Blake, Merz C. L., and C.J., UCI Repository of machine learning databases. Available at http://www.ics.uci.edu/mlearn/MLRepository.html, 1998. [23] Wu X., Kumar V., Quinlan J. R., Ghosh J., Yang Q.,
Motoda H., McLachlan G. J., Ng A., Liu B., Yu P. S., Zhi-Hua Zhou, Steinbach M., Hand D. J., and Steinberg D., Top 10 algorithms in data mining, Knowledge and Information Systems, Vol. 14, pp. 1–37, 2008.
[24] Mangai J. A., Kumar V. S., Appavu S., A Novel Feature Selection Framework for Automatic Web Page Classification International Journal of Automation and Computing, Vol. 9, No. 3, 2012. (Article in Press) [25] The 4 Universities data set. [Online], Available: