Dynamic Visual Navigation System using
Android Device
Raihan Uddin Ahmed
American International University Bangladesh Dhaka-1207, Bangladesh
ABSTRACT
A
s the involvement of technology and user’s diversified demands modern mobile phones no longer function merely as phoning and texting devices. In addition, mobile devices such as smart phones are becoming more powerful in terms of performance and battery life in recent times. With the growth Internet technologies people are using navigation systems extensively in our smart phones. But it suffers in most current information of our desired navigation data, since those are preconfigured by some contributors. In this paper, a solution has been aver which can collects most recent information dynamically in a very user friendly way. A concept has also been made that will help user to utilize the interaction between him and their android device by giving the best information as well as visualization of the navigation system dynamically.General Terms
Development process of an application for the visual navigation system by using camera, sensors and GPRS of an android cell phone.
Keywords
Visual navigation, android mobile camera, dynamic visualization,Viewport- Biasing, Pitch and Roll angle, GEO-coding.
1.
INTRODUCTION
It’s been a while that people are using our mobile phone as a navigator. Previously they have to only relay on the compass and two dimensional map navigation systems. On that time camera of the phone was use only for taking photos and recording videos. Now-a-days digital navigation system does not only base on digital map or compass. Vision-based approaches are becoming a promising method for indoor as well as outdoor navigation, but prototyping and evaluating them pose several challenges. These include the effort of realizing the localization component, difficulties in simulating real-world behavior and the interaction between vision-based localization and the user interface. Navigation system using mobile phone camera while streaming the video is a new concept. This concept allows us to not only feed by the visual navigation information but also it’s able to make more accurate information about the location. Very few works has been done for implementing this concept. Most of them are still very static while dynamic way is more reliable and user friendly. Dynamic use of the android phone camera as a digital navigator is way more challenging where much more human and computer (android device) interaction are closely related. The goal of this research is to make a perception as well as give a procedure that will help the user to get the navigation information dynamically while the user effort will
be reduced and the information is much more accurate and pertinent.
2.
BACKGROUND STUDY
Here in this paper a solution have been made that could reduce the user’s effort and can able to get the correct information by moving the android device rather clicking the button for zoom in every time. Illustration and visualization of the data is one of the very primary factors in any project. For helping the user to get the information more efficient way, here in this paper a proposal has been made that will illustration technique that makes the navigation system more attractive and more reliable and accurate. Since users have to deal with the navigation system of a bigger area, they have to deal with huge amount of data. So in this research a solution must be came up so that it will gives the proper utilization of the huge amount of data and coherent computation. This is why; in this paper a possible best solution has been made to utilize the huge amount of data at the same time no system failure.
3.
PROPOSED APPROACH
Our paper is mainly based on Google Maps which is based on a close variant of the Mercator projection [10]. Google Maps uses the formula for the spherical Mercator, but the coordinates of features on Google Maps are the GPS coordinates based on the WGS 84 datum. The difference between a sphere and the WGS 84 ellipsoid causes the resultant projection not to be precisely conformal. The incongruence is imperceptible at the global scale but causes maps of local areas to deviate slightly from true ellipsoidal Mercator maps at the same scale.
Assuming that dE and dN are the components of infinitesimal local ENU coordinates, their breadth and length projected on the map are described as follows:
dE
e
a
a
dx
map
)
sec
sin
1
(
1
2
2
dE
e
a
a
dY
map
)
sec
sin
1
(
1
2
2
where
is geodetic latitude, ℓ is the first eccentricity of the ellipsoid of the Earth, a is the semi-major axis of the Earth, and amap is that at the scale of the map as drawn (see"Geodetic system" and "Mercator projection").. Google Maps uses following formula [10]:
pixels
a
ommLevel
map
)
2
2
256
(
~
Because the Mercator projects the poles at infinity, Google Maps cannot show the poles. Instead it cuts off coverage at
give the information according to the coordinate and angle. The database must be design according to the information that has been received from Goggle map API server. Reversed Geo-coding has been used for collecting our information from the Google API server. It must be mention that reverence geo-coding is exactly opposite of the Geo-geo-coding. It means it gives the information of the address of the location by converting, translating a location on the map into a human-readable address. It uses the direct latlan parameter and returns the following JSON (most important parts of the large sample JSON has been shown)
{
“status”: “OK” “results”: [ {
“types”: street_address,
“formatted_address”:”27-A, Dhaka City, Dhaka 1207 , BD”
“address_components”: [ { “long_name”: “27-A” “short_name”: “27-A” “types”: “street_number” }] … “geometry”:{ “location”: { “lat”:140.4223877, “lng”:173.9764669 }, “location_type”: ”RANGE_INTERPOLATED”, “viewport”: { “southwest”:{ “lat”:140.4223877, “lng”:-173.9764669 }, “northeast”: { “lat”:140.4223877, “lng”:-173.9764669 } }} … }]
Another thing has to be in consideration is the Viewport- Biasing [11] which prefer the result within the bounds. More result can be included if more relevant result exist outside those bounds. The flowing JSON shows the result of the associate bounded area location of a particular point.
Fig 1: Viewport angle of the East Viewport
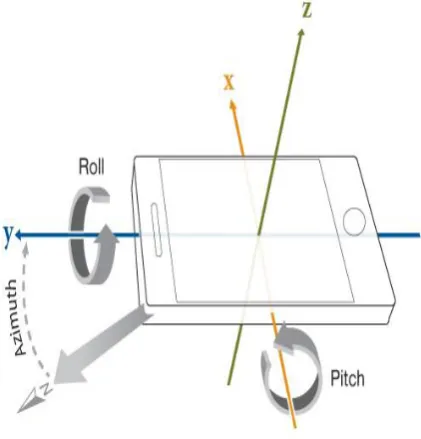
[image:3.595.323.534.84.304.2]Considering those data that have been found from the returned JSON, the temporary SQLite database has been designed. There will be total nine (9) tables in the project database. All of the will contain light amount of data. The database can be described by dividing it into two parts. One of the parts will contain one table and by using that table, the program will choose which viewport table (out of the rest 8 tables) will going to be used in the next phase. And another part will contain eight tables for eight viewports (i.e. North, South, West, East, North-West, West, North-East, and South-East). The viewport determination table will contain four columns’ which are Azimuth, Pitch, Roll Angle [12] and their correspondent viewport. A sample table including the data for detecting the view port has been shown bellow. This is perfect for the Samsung mobile phone (Here I have used Samsung Galaxy-Ace model).It may be slightly differ from model to model or company to company.
Table 1. Table structure of selecting appropriate viewport.
Azimuth Pitch Roll Viewport
0 0 60 East
45 0 60 South-East
90 0 60 South
135 0 60 South-West
180 0 60 West
225 0 60 North-West
270 0 60 North
315 0 60 North-East
[image:3.595.314.542.462.564.2]Here in this table the Pitch and Roll angle are same. It is because when the user changes their phone angle they must move it in z-axis/Azimuth. Any alteration of this will be detected as either the user faces his camera very down or to the sky. That why the azimuth angle are different at different view point. Although the data has been inputted in pitch and roll table because it may be differ from device to device. For example in this case (for Samsung Galaxy-Ace) y-axis or Roll angle is not less than 60.
Fig 2 Angle of the Orientation sensor(Z=Azimuth, X=Pitch, Y=Roll)
Next for each viewport a single table (1*8=total 8) has been constructed. Each table will contain the Building/Area name, location, Type of the Building, Company Logo (if any), and Closing Date (if any). Location will be determined by the phone angle. Most cases Azimuth angle will be in main consideration. Here is a sample table that I have used for the development. If a South-east view point has been chosen then it table will be:
Table 2. Table structure in SQLite DB
Min_
Azim
uth
Max
_Azi
muth B
T B
N
Loc CD Ext
ra Log
o
135 155 … …. … … …
120 135 … … … … …
[image:3.595.54.285.488.602.2]Fig 4: While capturing video, our tool successfully showing information of Jatio Shangshad Vaban (National
Assembly Building of Bangladesh).
Information has been
shown while video is
streaming.
As it’s a national
assembly building, it is
showing when it was
build and the name of
its architect
Information has
been shown while
video is
streaming.
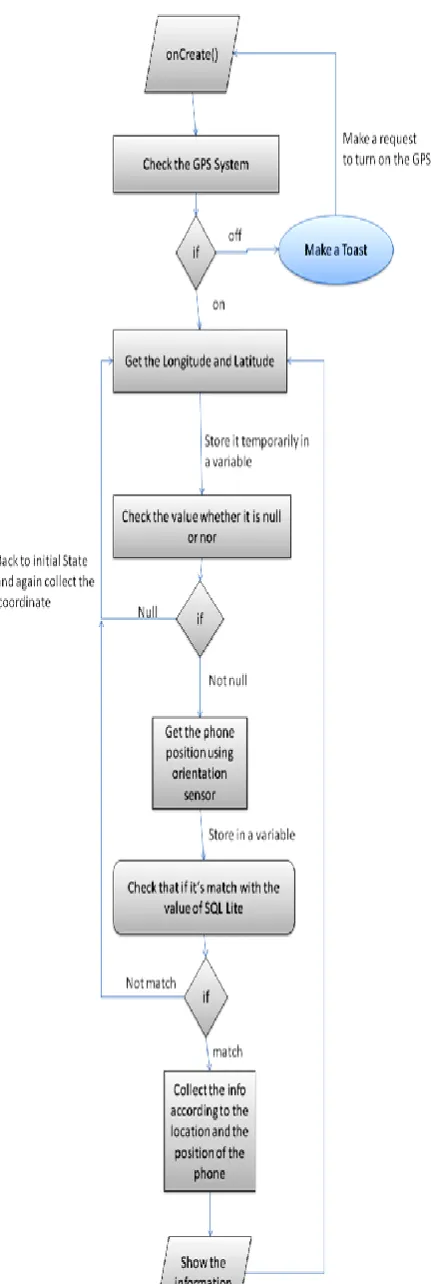
[image:4.595.317.544.68.366.2] [image:4.595.318.548.431.727.2]Fig 3 Illustrates the entire system that elicits data and gets the information step by step. In step 1, the location of the user (longitude and latitude) will be collected and will be stored in separate temporary variable, then in step 2 the phone angle (azimuth, pitch and roll angle) will be collected from the phone .The data (both from step 1 and step 2) will be store in a temporary variable and finally in the step 3 it will be compared with the database (which has been constructed and filled the data that user have found from Google Android Map API v2 server through GPS and internet)and will be show it on the screen while video is streaming. It is a continuous process where the data has been received and shown in dynamic way (without interfering the program until the user closes it manually). Figure 4 show the raw image where actually user sees what is happing in other word it is the main user view. It has been showing the general information, such as building type, closing date etc. Since it is (figure-4) a National Assembly Building the type shows that it’ an Assembly Building and then show its final contraction date which is 1982.It’s also shot the name of the architectures.
Figure 5 is showing a business building .Since it’s a business building it’s only show the name of the business farm and its weekly closing day.
4.
DISCUSSION
Our process is a continuous process, where data has been shown dynamically. Most important thing is that user has to maintain a good internet speed as he is collecting his geometric position and some associate information from Google Map API server that will be saved in the database. If the internet connection becomes slow, the data retrieval will be slow. Global positioning system (GPS) is also important factor here since the system must have to locate the user position, user must keep in mind that the more accurate device position will give more accurate information. Here the proposed model is more dynamic. In small environment it will work fine but since user have to deal with huge amount of data the process is still little bit slowly in large scale. Some work still need to be done in this area.
5.
CONCLUSION
In this paper a concept has been developed and associate procedure for the visual navigation system has been proposed which is far better than traditional navigation method. This research goal has just fulfilled the process criteria and also had shown the data retrieve method for this particular navigation problem. By using this paper one can able to develop an application that can help the user to navigate himself accurately. Here a scope has also been created for farther research for the field like in 3D navigation system, virtual city navigation etc.
6.
ACKNOWLEDGMENTS
The author is great full to Mr. Abdus Salam and Mr. Saddam Hossain Mukta, Faculty members of American International
University of Bangladesh for reviewing the manuscript and valuable suggestion.
7.
REFERENCES
[1] Butz, A., Baus, J., Kr¨uger, A., and Lohse, M. A hybrid indoor navigation system. In Proceedings of IUI 2001, ACM Press (New York, 2001), 25–32.
[2] Cheverst, K., Davies, N., Friday, A., and Efstratiou, C. Developing a context-aware electronic tourist guide: Some issues and experiences. In Proceedings of CHI 2000 (Netherlands, 2000), 17–24.
[3] Kranz, M., Fischer, C., and Schmidt, A. A comparative study of DECT and WLAN signals for indoor localization. In 8th Annual IEEE Int’l Conference on Pervasive Computing and Communications (PerCom 2010), IEEE (March 2010), 235–243.
[4] Woodman, O., and Harle, R. Pedestrian localisation for indoor environments. In Proceedings of the 10th international conference on Ubiquitous computing, UbiComp ’08, ACM(New York, NY, USA, 2008), 114– 123.
[5] Mulloni, A., Wagner, D., Barakonyi, I., and Schmalstieg, D.Indoor positioning and navigation with camera phones.Pervasive Computing, IEEE 8, 2 (2009), 22–31. [6] Fritz, G., Seifert, C., and Paletta, L. A mobile vision
system for urban detection with informative local descriptors. In Computer Vision Systems, 2006 ICVS’06. IEEE International Conference on, IEEE (2006), 30–30.
[7] Matas, J., Chum, O., Urban, M., and Pajdla, T. Robust wide-baseline stereo from maximally stable extremal regions. Image and Vision Computing 22, 10 (2004), 761–767.
[8] Klein, G., and Murray, D. Parallel tracking and mapping on a camera phone. In Proc. Eigth IEEE and ACM International Symposium on Mixed and Augmented Reality (ISMAR’09)(Orlando, October 2009).
[9] Möller, Andreas, et al. "Tool Support for Prototyping Interfaces for Vision-Based Indoor Navigation." Proceedings of the Workshop on Mobile Vision and HCI (MobiVis). Held in Conjunction with Mobile HCI. 2012.
[10] The section of "Google Maps JavaScript API V3". Code.google.com. Retrieved 2012-04-25.
[11] The section of “View port Biasing and data retrival”https://developers.google.com/maps/documentati on/geocoding/