Nash Equilibrium in Competitive Electricity
Market Considering Congestion
Seyed Mohammad Hossein Nabavi
Department of Electrical Engineering, DamavandBranch, Islamic Azad University, Damavand, Tehran, Iran
Somayeh Hajforoosh
Department of Electrical Engineering, Damavand Branch, Islamic Azad University, Damavand,
Tehran, Iran
ABSTRACT
Pricing has turned into a highly significant matter for suppliers and their customers since deregulation has been realized in the electrical industry and many countries have revised the structure of their electrical energy market by defining different competition levels in generation, transmission and distribution. In the current paper, a proposed algorithm based on games theory has been used for analyzing economic behavior of generators for pricing in an instantaneous electrical energy market. This algorithm is then applied on the studied system in two states without considering congestion, and considering congestion. Effect of congestion on players’ pricing strategy is discussed and emergence of market power is also demonstrated. The 9-bus IEEE system is used for illustrating features of the respective algorithm.
Keywords
— Pricing, Nash Equilibrium, Optimal Load Distribution, Games Theory.1.
INTRODUCTION
Different models have been used in instantaneous electrical energy market but all of them are based on making proper offers by generators and consumers as players in market place. Each player’s offer usually includes price, amount of generation/consumption power and/or both of them.
Nonetheless, the structure of players’ offer curve is determined by the market rules. Currently, in most active markets around the world, section of generators and their competition has been well established but the consumers have not yet managed to find a position in the energy market to make their offers. Therefore, the generators focus has been discussed in this paper.
Meanwhile, the goal of generators (electricity suppliers or sellers) is to gain more profit. For this reason, the electricity suppliers must be able to predict consumption levels in different hours, performance of their competitors, electricity price in the future, and the existing restrictions in the network so as to make suitable offers. Then, the electricity suppliers will be able to make the best offer in the energy market considering all information as well as the technical limitations for all power plants including their own power plants.
The discussion of competition in energy markets includes the problem of determining the appropriate strategy with regard to the games theory. The certain and optimal answer to the problems associated with games theory is Nash equilibrium point. Accordingly, the energy suppliers shall also seek to find their Nash strategy to reach stable conditions and gain
reasonable profit. It would be meaningless for any supplier to determine its Nash strategy without considering the performance of other players (or other energy generators) because the Nash strategy of each supplier is related to strategies of other suppliers in Nash point.
Different players’ offering strategy in market has been studied and determined using different methods. In reference [1], authors attempted to obtain equilibrium point of electricity market and to find the players affecting occurrence of market power phenomenon. The present paper is divided into two major parts. The first part deals with offers made by the generators and consumers and the latter part is clearing of the electricity market. In the first part, the strategies of generators are determined based on the players’ objective which is maximization of their profit, and then, the market is balanced. The target function in market clearing is maximization of social welfare. Nash equilibrium has been calculated by iterating this process. It is asserted in the current paper that this simulation will be helpful for market players and network’s beneficiary.
For players, Nash equilibrium point represents long-term performance of rival players in selection of their strategies, and of course, enables market monitoring from the perspective of the network’s beneficiary. The authors in the present paper predicted the strategies taken by the players in the market while having complete information about their behaviors. The noteworthy point in the present paper is incorporation of transmission restrictions.
In reference [2], a method was proposed for determining the offering strategy of electricity generators in the competitive market. In the first level, the generators make their offers based on their target function which is profit maximization. In the second level, the beneficiary distributes the electrical power by solving an OPF problem based on its target function which is minimization of the money paid to the generators. In this problem, every generator makes its offer as a linear supply function and based on demand estimation and opponents’ behavior. Mont Carlo technique was used in the respective paper for calculating the expected profit in the selected strategy and genetic algorithm was also applied for finding the best strategy. The authors did not pay attention to the restrictions of transmission lines, and also, the target market was only analyzed from the viewpoint of generators and their offers.
Nevertheless, two target functions are followed in the current paper; first, the target function of the players which is maximization of their profit, and second, the target function of the beneficiary which is maximization of social welfare. Since the present paper does not deal with consumers, accordingly, the second function turns into cost minimization for the beneficiary. Here, the cost is the sum of money paid to the suppliers.
Players’ offering strategy is obtained in the algorithm proposed in the present paper based on the two aforementioned target functions. This algorithm was performed on an 8-bus system and the results refer to importance of the transferable capacity of lines on the strategy offered by the generators. The results also indicate that the profit gained by the generators using this method is higher than that when they make offers equal to their marginal costs. The network beneficiary also uses this method for monitoring the market and detecting the market power. In reference [4], problem of SFE model simplification was studied and its effect on the Nash equilibrium point was shown in all four states. Furthermore, SFE and Cournot models in electricity market were compared, with and without considering the transmission restrictions.
In reference [5], Nash equilibrium point in Cournot model was obtained using a numerical technique. In this paper, incomplete information of players was not taken into account as well. Reference [6] investigated Nash equilibrium point in bilateral contracts markets. Cost functions of the generators were assumed as known and transmission cost was also considered as a part of their current expenditures.
Reference [7] calculated Nash equilibrium point for SFE model in the non-participatory games state such that ISO modeled the economic behavior of generators in a static game assuming complete information that is participants’ prices were offered as pure strategy and Nash equilibrium concept was applied. In the present paper, besides obtaining the results of reference [7], the effect of congestion on a 9-bus IEEE system was dealt with and its impact on the player’s behavior was studied.
2.
GAMES
THEORY
Games theory is a science that studies people’s decision-making under conditions of mutual interaction with others. In other words, games theory is the science of studying contrasts (conflict of interests) and cooperation among rational players. James Waldegrave was the first one who discussed games theory. In his paper, he introduced minimum-maximum solution for a 2-contestant game. Von Neumann wrote a series of articles in 1928 and introduced the games theory as an independent branch of science. His works and those of Oskar Morgenstern were published in a book entitled “The Games Theory and Economic Behavior” in 1944. Significant progress in this field was achieved during 1950s and 1960s. In 1994, the games theory acquired further significance when the Nobel Prize in Economics was awarded to John Harsanyi, John Nash, and Richard Selten for their contributions to analysis of equilibrium point in non-participatory games [8].
Games theory comprises any social situation in which two or more players are involved. Two fundamental assumptions made for the players include: rationality and awareness. Rationality signifies pursuing one’s benefit in the game that is every player intends to maximize his profit. Awareness means that each player shall be fully aware of the game consequences and whatever related to the game and any possible situation which might occur. The games have many aspects, and due to
these aspects, various categorizations can be given for them. The major categories of the games theory are as below [9]:
a) Static or dynamic games: In static games, the players choose their strategies simultaneously and gain the profit which is dependent on the simultaneous combination of choices. Yet, the players move consecutively in dynamic games.
b) Zero sum and non-zero sum games: In many games, one player’s gain rate is exactly equal to the amount of the opponent’s loss rate. Such games are termed as zero sum or fixed sum games. In other words, the algebraic summation of losses and gains for all combined behavior of players equal to zero or a constant number. Conflict of interests is complete in such games. The games in trade and economic activities are those with non-zero sum because numerous factors play role in the result of the game.
c) Classification of games in terms of information: The games can also be classified in terms of information. In a certain game, record of the game i.e. the behavior of the opponent or of the player in the past might be known for the current players (who must choose or decide). This type of game is called game with perfect (complete) information. Chess is an example of such games. On contrary, the game is called a game with incomplete (partial) information as long as the opponent’s behavior in the past in unknown for one of the players.
d) Participatory or non-participatory games: The players might agree on a strategy while playing a game. The game will be participatory if the agreement among players is applicable; otherwise, the game will be called a non-participatory one.
3.
INSTANTANEOUS
WHOLESALE
MARKET
3.1 Attitude of system’s beneficiary
In an instantaneous wholesale market, the system’s beneficiary follows different goals as an independent institution of which the most important ones are mainly minimization of generation costs (distribution of the economical charge on the system) and observance of the technical constraints governing the network. Distribution of economical active charge on the system can be expressed as a non-linear optimization problem with the following constraints:
Equilibrium between generation and consumption
Attributes of generation units, and Limitations of the transmission system
The problem can be mathematically written as:
1
G N
Gi j
Min
C P
(1)Subject to:
min max
1,...,
Gi Gi Gi G
P
P
P
for i
N
(2)min max
1,...,
Gi Gi Gi G
Q
Q
Q
for i
N
(3)max
1,...,
where
Gi
C P
is the generation costP
Giare dispatched generations at node i.N
G is the number of generators,Gi
P
andQ
Gi are the active and reactive power generation vectors at busG
i, respectively.T
L is the number of transmission lines andP
Lis the transmission loss. Lagrange function is in the following form:
1
1
1 1
1 1
(
,....,
)
(
)
(
)
(
)
G
G
G B
G
L
G GN
N
Gi j
N N
Dj L Gi
j i
Min Min Max Max
i Gi Gi i Gi Gi
N
T
Max
i k k k
k
L P
P
C P
P
P
P
P
P
P
P
v P
P
(5)
The required power can be supplied through solving this optimization problem using Lagrange method by including the technical constraints with minimum cost. This is one of the principal goals of the market’s administer.
3.2 Attitude of the supplying companies
(generators):
The major goal of supplying companies as participants in an instantaneous market is to maximize their profit, based on which they make their offers (amount or price or both of them) to the market. This case can be analyzed as a game based on the games theory. In this paper, static games with complete information were used as a method for offering the price in electricity market, and, Nash equilibrium point as the optimal point of pricing determines the strategies of market players.
The method implemented in the present paper includes solving a 2-level optimization problem as follows:
3.2.1 Minimization of the generation costs
1 2
1
G N
i Gi i Gi
j
Min
f
P
f
Q
(6)where
f
1i andf
2i are cost functions of the generators.Gi
P
andQ
Girespectively represent active and reactive generation power of the generators.3.2.2 Maximization of generator’s profits:
The profit function of generators is given as follows:
2
G
j j j
K N
j G j j G j G
j
Min
P
a
b
P
c
P
where, K is the set of generation units belonging to company “k” and
jis the market price in jth bus.4.
THE
PROPOSED
ALGORITHM
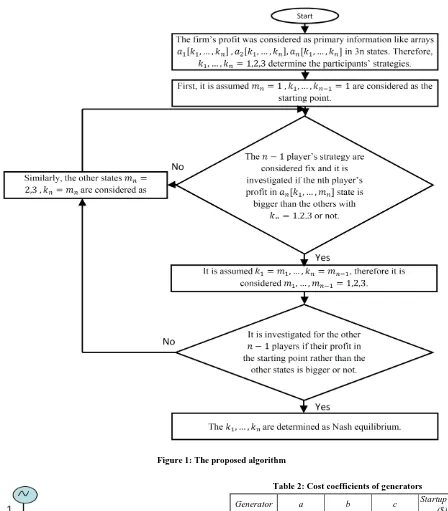
Considering the three pure strategies defined for each player according to Table (1), we present an algorithm in this section in order to determine the Nash equilibrium point which is the optimal strategy of the market. If there are ‘n’ supplying units, 3n different states of unit commitment (UC) program and
optimal load distribution must be executed for each charge level considering the three strategies namely Low, Base, and High. Ultimately, the proposed algorithm will extract the Nash equilibrium point out of these 3n optimal states. The algorithm
[image:3.595.55.280.174.323.2]stages are illustrated in flowchart of Figure (1).
Table 1: Three pure strategies. Strategy Proposed price curve
Low %75 of marginal price
Base %100 of marginal price High %125 of marginal price
5.
NUMERICAL
STUDIES
5.1 The system under study
In this section, we study a simple example in order to manifest fitness of the proposed algorithm and also study the effect of congestion on the strategy of market players. For this purpose, the standard 9-bus IEEE network was used as shown in Figure (2).
This network contains 9 transmission lines, 3 buses, and 3 generation buses designated as {G1, G2, G3} with a total generation capacity of 820 megawatts (MW).
It is assumed that there are three generators, which are
respectively represented
Figure 1: The proposed algorithm
[image:4.595.306.544.559.705.2]Figure 2: Single line diagram of the IEEE 9-bus test system
Table 2: Cost coefficients of generators
Generator a b c Startup cost
($)
G1 150 5.0 0.1100 1500
G2 100 1.2 0.0850 2000
G3 335 1.0 0.1225 1500
Table 3: Technical restrictions of generators
Generator Pmin (MW) Pmax (MW) Qmin(MVAR) Qmax(MVAR)
G1 150 5.0 0.1100 1500
G2 100 1.2 0.0850 2000
G3 335 1.0 0.1225 1500
5.2 Simulation Results
purpose. At the end, Nash equilibrium points have been calculated out of the optimal states using the proposed algorithm.
5.2.1 The first state: Results without considering the
transmission restrictions:
In this state, the Nash equilibrium points for the three aforementioned charge levels are shown in tables 4 through 6, respectively. As observed, number of Nash equilibrium points decreases with the increase in charge of system. This indicates that the generators choose their strategies more confidently as the charge in the system increases.
5.2.2 The second state: Results considering the
transmission restrictions:
In this state, the capacities of the 4-5 and 7-8 lines are limited for three charge levels (100, 150, and 200 Megawatts) as follows:
For the charge of 100 MW: capacity of 4-5 and 7-8 lines are respectively considered equal to 57 and 61.37 MW. For the charge of 150 MW: capacity of 4-5 and 7-8 lines
are respectively considered equal to 95 and 95 MW. For the charge of 100 MW: capacity of 4-5 and 7-8 lines
are respectively considered equal to 123 and 124 MW.
The final results are shown in tables 7 through 9. As demonstrated in the tables, the second generator (G2) raised his
strategy for all three charge levels and used High strategy in most of cases. Hence, it can be concluded that congestion on the network make the second generator (G2) turn into a strategic
participant. It is also observed that imposing restriction on the transmission network limits the players’ strategies.
6.
CONCLUSION
Economic behavior of generators was modeled by the independent beneficiary in this paper as a static game with complete information, and, the offers made by the market participants were regarded as their pure strategies. Then, Nash equilibrium point or the optimal point of the market was computed using a proposed algorithm.
[image:5.595.300.547.80.254.2]According to the simulation results, it could be observed that imposing restriction on the transmission network and creating congestion enables the rise of strategy for some generators leading to emergence of market power phenomenon. Furthermore, number of Nash equilibrium points in the network decreases as the charge of the network increases. In other words, the generators reach an agreement at a point for pricing.
Table 4: Results of Nash Equilibrium when load is 100MW.
Nash
Equilibrium Generator Strategy
Benefit ($/h)
Objective (S/h)
1
G1 Base 0.00
1000.12
G2 High 178.75
G3 Low 19.23
2
G4 Base 0.00
1111.90
G5 High 789.13
G6 Low 0.00
3
G7 Base 0.00
1111.90
G8 High 789.13
G9 Low 0.00
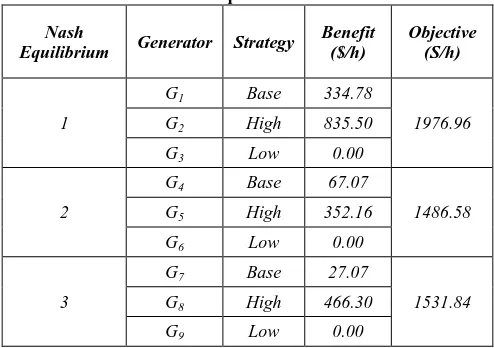
Table 5: Results of Nash Equilibrium when load is 150MW.
Nash
Equilibrium Generator Strategy
Benefit ($/h)
Objective (S/h)
1
G1 Base 334.78
1976.96
G2 High 835.50
G3 Low 0.00
2
G4 Base 67.07
1486.58
G5 High 352.16
G6 Low 0.00
3
G7 Base 27.07
1531.84
G8 High 466.30
G9 Low 0.00
Table 6: Results of Nash Equilibrium when load is 200MW.
Nash
Equilibrium Generator Strategy
Benefit ($/h)
Objective (S/h)
1
G1 Base 355.28
3032.12
G2 High 908.39
G3 Low 380.47
Table 7: Results of Nash Equilibrium when load is 100MW considering congestion.
Nash
Equilibrium Generator Strategy
Benefit ($/h)
Objective (S/h)
1
G1 Base 38.99
1130.79
G2 High 1.04
G3 Low 0.00
Table 8: Results of Nash Equilibrium when load is 150MW considering congestion.
Nash
Equilibrium Generator Strategy
Benefit ($/h)
Objective (S/h)
1
G1 Base 43.64
1545.58
G2 High 482.99
G3 Low 0.00
2
G4 Base 333.79
1979.32
G5 High 839.71
G6 Low 0.00
Table 9: Results of Nash Equilibrium when load is 100MW considering congestion.
Nash
Equilibrium Generator Strategy
Benefit ($/h)
Objective (S/h)
1
G1 Base 373.01
3055.86
G2 High 696.72
[image:5.595.58.550.373.756.2]7.
ACKNOWLEDGMENT
This article has been extracted from a research project sponsored by Azad University, Damavand Branch to whom I owe a debt of gratitude.
8.
REFERENCES
[1] Y. B. Zhang, X. J. Luo, "Constrained Competitive Cournot Equilibrium with Incomplete Information in Electricity Market", IEEE Transaction on Power System, Vol.16, No.2, May 2007.
[2] Kulasekera, A.L. Gopura, R.A.R.C. ; Hemapala, K.T.M.U. ; Perera, N. , "A review on multi-agent systems in microgrid applications", ISGT India 2011, IEEE, pp 173 - 177.
[3] Aung, H.N. ; Khambadkone, A.M. ; Srinivasan, D. ; Logenthiran, T. , " Agent-based intelligent control for real-time operation of a microgrid", PEDES India, 2010, IEEE, pp 1-6.
[4] Niannian Cai ; Mitra, J. , " A decentralized control architecture for a microgrid with power electronic interfaces ", NAPS, 2010, IEEE, pp 1-8.
[5] Zhou, H.J. ; Cao, J.Z. ; Guo, C.X. ; Qin, J. , "The architecture of intelligent distribution network based on MAS-SOA ", Power and Energy Society General Meeting, 2010, IEEE, IEEE, pp 1-6.
[6] Busoniu, Lucian, Babuska, Robert and Schutter, Bart De., “A Comprehensive Survey of Multiagent Reinforcement Learning.”, IEEE Transaction on Systems, Man, and Cybernetics,Part C:Applications and Reviews, Vol. 38, No. 2,, pp. 156-172, 2008.
[7] Lucian Busoniu, Robert Babuska, and Bart De Schutter, "A Comprehensive Survey of Multiagent Reinforcement Learning," IEEE Transaction on Systems, Man, and
Cybernetics,Part C: Applications and Reviews, Vol. 38, No. 2, pp. 156-172, 2008.
[8] Rahimiyan, M. and Rajabi Mashhadi, H., "Supplier’s optimal bidding strategy in electricity pay-as-bid auction: Comparison of the Q-learning and a model based approach", Electric Power Systems Research 78 (2008), pp. 165–175, 2008.
[9] Rahimiyan, M. and Rajabi Mashhadi, H., "An Adaptive Q-Learning Algorithm Developed for Agent-Based Computational Modeling of Electricity Market", IEEE Transactions on Systems, Man, and Cybernetics-Part C: Applications and Reviews, Issue 99, pp. 1-10, 2010.
[10]S. M. H Nabavi, N. Hosseinipoor, and S.Hajforoosh; “Social Welfare Maximization by Optimal Locating and Sizing of TCSC for Congestion Management in Deregulated Power Markets”, International Journal of Computer Applications 6(6):16–20, September 2010.
[11]S. M. H. Nabavi, K. Khafafi, A. Sakhavati and S. Nahi, Optimal Locating and Sizing of SSSC using Genetic Algorithm in Deregulated Power Market. International Journal of Computer Applications 22(4):37–41, May 2011.
[12]S. M. H Nabavi, and S.Hajforoosh; “Exploration and Exploitation Tradeoff using Fuzzy Reinforcement Learning”, International Journal of Computer Applications 59(5):26-31, December 2012.
[13]SMH Nabavi, S Hajforoosh, S Hajforosh, A Karimi, “Reactive Power Cost Allocation in Re-Structured Electric Power Environment”, International Review on Modelling & Simulations 3, 2010.