http://dx.doi.org/10.4236/eng.2015.711065
How to cite this paper: Long, N.V., Ngoc, N.Q., Dung, N.N., Kristiansen, P., Yunusa, I. and Fyfe, C. (2015) The Effects of Shade Tree Types on Light Variation and Robusta Coffee Production in Vietnam. Engineering, 7, 742-753.
http://dx.doi.org/10.4236/eng.2015.711065
The Effects of Shade Tree Types on Light
Variation and Robusta Coffee Production
in Vietnam
Nguyen Van Long1, Nguyen Quang Ngoc1, Nguyen Ngoc Dung1, Paul Kristiansen2, Isa Yunusa2, Chris Fyfe2
1The Black Pepper Research & Development Centre, Pleiku City, Vietnam 2The University of New England, Armidale, NSW, Australia
Received 15 October 2015; accepted 13 November 2015; published 16 November 2015
Copyright © 2015 by authors and Scientific Research Publishing Inc.
This work is licensed under the Creative Commons Attribution International License (CC BY). http://creativecommons.org/licenses/by/4.0/
Abstract
Vietnam is well-known as the second largest global coffee producer and the largest worldwide exporter of Robusta coffee. However, the Robusta coffee sector in Vietnam is facing many prob-lems, including low quality, high external inputs and water shortages as a result of shade tree era-dication. A six-month research project was conducted that focused on effects of shaded tree types on variation of light intensity and aspects of Robusta production. Three shade tree species at dif-ferent planting densities and shade provision were investigated, including 46 trees of Durian ha−1
(14% shade), 35 trees of Sennaha−1 (17% shade), and 60 trees of Leucaena ha−1 (34% shade), and
unshaded site (Open) was used as a control. The study found that light intensity declined 50% with Durian, 58% with Senna and 60% with Leucaena compared with the Open site (2096 μmol∙m−2∙s−1).
Within the coffee canopy, a significant decline in light intensity was observed from the top of the canopy to the bottom. The percentage of light at the middle (90 cm above ground) and bottom (30cm) levels of the coffee canopy was declined by 81% and 88% respectively for the Open site, and 86% and 92% for the Leucaena site. There were no differences in the number of flowers branch−1 tree−1 and fruit set between shaded and unshaded coffee sites. However, a significant
difference in first fruit drop was observed.
Keywords
743
1. Introduction
Coffee is well-known as an understory bush, and early coffee plantations are grown under shade trees or forest canopy. However, in the modern coffee cultivation, opinions differ on whether or not shade is beneficial for coffee production.
Scientists who support shaded coffee cultivation highlight the positive effects of shade trees on yield im-provement [1]-[4], disease decline [1] [5] [6], biodiversity preservation [7] [8] and environmental protection [7] [9]. Importantly, shade trees can not only play an important role in microclimate buffering that may help coffee cope with environmental stresses caused by climate change [10] [11], but also contribute to sustainable coffee production. There are also many studies that identify shade trees as the main issue in declines of coffee yield by causing low levels of light intensity that leads to inhibition of flower formation [12]-[16]. Shade trees have been shown to decrease coffee yield by about 18% - 30% in Costa Rica [17]-[19], 28% in Central America [20], and 50% in Brazil [21].
Two coffee species in Vietnam are 95% of Coffea canephora (Robusta) and 5% of Coffea arabica L. (Arabi-ca). They are an important economic commodity and significantly contributing to socio-economic development. Vietnam, which has 653,000 ha of coffee in 2014, is the second largest global coffee producer, accounting for 19.4% of total production, additionally, is the world’s biggest Robusta producer with 47.7% share of worldwide Robusta production [22]. Nationally, coffee is the second largest export crop (7% of the total nation’s exports) after rice. Furthermore, Vietnam is among those countries that have the lowest Robusta production costs ($ 300 - 1000 USD tonne−1), but the largest yields per hectare (2.5 tons green1 bean ha−1) [23] [24].
Traditionally, the practice of growing coffee in Vietnam involves planting coffee under shade trees. However, since the 1990s, worldwide coffee demand has increased sharply and this has led to a dramatic expansion in coffee growing areas along with shade abandonment to exploit maximum yield [25] [26]. Currently, the statis-tics show that the proportion of total coffee area in the Highlands grown in shade has declined to 19% [27]. As a direct or indirect result of shade eradication, coffee production of Vietnam is facing extreme problems with re-gard to low coffee quality, high external inputs and water shortage.
Therefore, understanding the influence of shade trees on coffee cultivation is critical to future coffee produc-tion, and in order to make it, researches should focus specifically on regions (climate and soil), coffee cultivars, shade tree species and density, and producer’s objectives. The general aim of research was to investigate the ef-fect of different shade tree types (Durian, Leucaena and Senna) on light variation and Robusta coffee production in the Western Highland province of Gia Lai, Vietnam in order to evaluate the effect of shade trees on available light for the coffee tree canopies, and the effect of shade on coffee production (flowering, fruit set and fall pro-portions).
2. Materials and Methodology
2.1. Site DescriptionsIa Grai, as a west mountainous and border district of Gia Lai, has the largest both coffee area (16,615 ha) and yield (3.000 kg green bean ha−1) of province [28]. The climate is ideal for Robusta growth and productivity
be-cause it meets the specific ecological requirements for coffee growth. Dry and rainy seasons are distinguishable, annual rainfall was over 2000 mm, and the average daily air temperature was 22.2˚C. This area is consisting of mountains and plateaus, and it has 26 soil types of which basaltic soils are the most common (50.4%). The av-erage coffee yield in this area is approximately 2.5 tons green coffee bean ha−1. Monocultures with densities of
1111 bushes ha−1 (3.0 × 3.0 m spacing) are present on most of coffee farms, and each coffee bush is planted in a
bowl-shaped hole to provide a micro basin for irrigation (dimensions of 2.6 m × 2.6 m × 0.2 m). Nearly 75% of Robusta were grown in full sun [29] and all bushes are pruned to maintain heights at approximately 1.8 m.
2.2. Field Experiment
2.2.1. Treatments Applications and Design
Four treatment sites included coffee farms shaded by either Senna siamea (Lam.). Irwin and Barneby (Senna),
Leucaena leucocephala (Lam.) de Wit (Leucaena), Durio zibethinus L. (Durian), and one unshaded farm (Open),
744
were used to determine the influence of different shade tree types on light intensity, flowering, fruit set, and fruit fall in Robusta coffee. Measurements were taken during December 2014 (the harvesting period) to the end of May 2015 (the pinhead stage of fruit). These three shade tree species are evergreen and long-lived with an open canopy and good drought tolerance [30]. The slope of the land at all sites was less than 3%; the altitude is rang-ing between 634 - 700 m a.s.l. Total shade cove per ha was 34% for Leucaena site (60 trees ha−1), 17% for
Sen-na (35 trees ha−1) and 14% for Durian (46 trees ha−1).
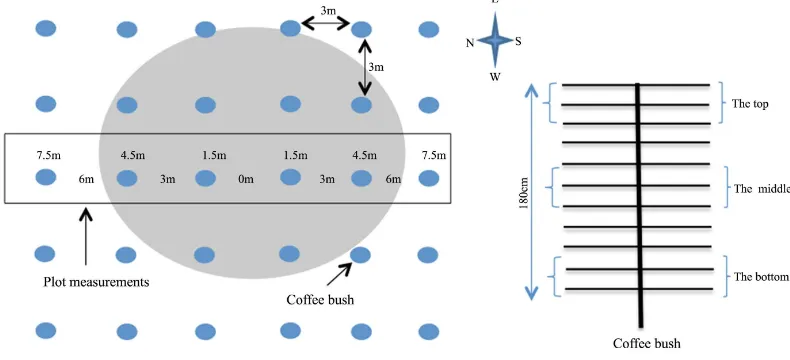
[image:3.595.115.510.478.658.2]Shade tree layout in regard to coffee bushes and the location of light measurements are provided inFigure 1. Each treatment (shade tree type) was designed with five plots/blocks, each one containing one shade tree (see
Figure 1 for an example plot). Three coffee bushes north and south of the stem of the shade tree were assessed in each plot, to give six coffee bushes allocated evenly in two directions of the shade tree. Only the two coffee bushes, in either direction, closest to the shade tree were shaded; the others was unshaded.
The position at the stem of the shade tree was marked as 0 m and the distance from this to the nearest coffee bush, in both directions, was 1.5 m. The distance between coffee bushes was 3 m and hence the distance from the stem of the shade tree to the farthest coffee bush was 7.5 m. The positions of the three coffee bushes, ranging from the nearest to farthest from the shade tree, were therefore labeled 1.5, 4.5 and 7.5 m respectively. At the Open site, five plots with six coffee bushes per plot were randomly allocated. For each coffee bush, measure-ments were also taken in the vertical plane on both the north and south side of each plant. These were taken from three levels, branches on the top, middle and bottom (Figure 1).
2.2.2. Impact of Canopy on Light Penetration
An Electric Calibration Line Quantum2 sensor (model MQ-306 with 6 Sensors, Apogee Instruments) was used to measure light intensity (μmol∙m−2∙s−1). Readings were taken at between 11:00 am and 1:30 pm on clear, sunny days once the sun was at a right angle (90˚) to the ground [31] at three times: 2 February, 24 March and 14 April 2015. Light measurements were taken north and south of each shade tree at the three shade tree sites and Open site. Measuring light intensity under shaded trees, each direction, light was measured at 0.0 m (shade tree stem), 1.5 m, 3.0 m, 4.5 m, 6.0 m and 7.5 m from the shade tree to outside of the shade canopy (as illustrated in Figure 1).
2.2.3. Effect of Shade Tree and Coffee Self-Shading and Vertical Positions on Light Intensity down a Coffee Canopy
Five coffee bushes were selected from under the canopy of the shade trees at Leucaena and five bushes at Open to determine light variation caused by coffee self-shading and shade trees. At Leucaena, coffee bushes located at
Figure 1. Light measurements were recorded for (left) three coffee bushes (small circles) located 1.5 m, 4.5 m and 7.5 m north and south of the truck of the shade tree (large oval), with only the two bushes located at 1.5 m and 4.5m being shaded; and (right) the vertical variation in light in the coffee bush (about 180 cm tall)
with two branches sampled at The top, middle and the bottom of the north and south sides of the coffee bush.
4.5 m on the north side of the shade tree were used. Because the height of trees was consistent at 180 cm, each coffee bush was measured at six locations every 30 cm starting at and above 30 cm above the ground (Figure 1). Readings were taken at three times: 4 February, 25 March and 14 April.
2.2.4. Influence of Shade Tree Types on Flowering, Fruit Set and Fruit Fall
Counts were conducted 3 - 5 days after watering. The total number of flowers per branch was calculated. Mea-surements were taken from coffee bushes chosen to measure light intensity (three bushes each on the north and south side of the shade tree) (Figure 1). Three randomly chosen branches; one each at the top (around 170 cm above ground), middle (90 cm above ground) and bottom (45cm above ground) of the coffee on both the north and south side of each coffee bush were used to give a total of six branches per bush. Total flower buds per branch were counted separately (Figure 1).
The percentage fruit set and fruit fall was calculated from branches also used for measuring number of flow-ers per branch. Fruit set was measured in March when flowflow-ers had finished the pollinating process; approx-imately one month after blossoming. First fruit drop was measured during May at the “pinhead” stage; 3 - 4 months after the first stage of fruiting [32] [33]. The fruit set proportion equals total fruit set/total flowers and fruit fall proportion equals total fruit/total fruit set.
2.3. Statistical Analysis
Analysis of variance (ANOVA) was used to assess the effects of shade treatments on light and plant variables using R version 3.1.1 [34]. Homogeneity of the variances was checked using residual versus fitted plots and normality was checked using q-q plots to assess the assumptions of ANOVA. None of the measured variables needed transformation. P values ≤ 0.05 were considered significant and significantly different means were sep a-rated using 95% confidence intervals (standard error × 1.96) [35].
3. Result
3.1. Light Variation
Shade trees caused a significant decrease (P = 2e−16) in available light with closer proximity to the tree’s stem (Figure 2). Light intensity was 2096 μmol∙m−2∙s−1 (100%) in the open site (7.5m from the shade tree), whereas
under shade it was 1780 μmol∙m−2∙s−1 (85%) at 6.0 m, 1260 μmol∙m−2∙s−1 (60%) at 4.5 m, 734 μmol∙m−2∙s−1
(35%) at 3.0 m, 587 μmol∙m−2∙s−1 (28%) at 1.5 m and 420 μmol∙m−2∙s−1 (20%) at the stem of the shade tree (0 m).
For the three shade types, there was no difference (P > 0.05) in light intensity for the positions closest to the shade tree (≤3 m) or those most distant from it (7.5 m). However, intermediate distances from the shade tree were significantly different from each other, and different according to shade tree type (P < 0.05), whereby Du-rian tended to allow more light through compared to Leucaena and Senna (Figure 2). More sunlight was rec-orded on the north side of the shade trees compared to the south; however, differences in light variation between the two directions and for the three recording periods were not significant (P = 0.07).
Effect of Shade Tree and Self-Shading of Coffee Bush on Light
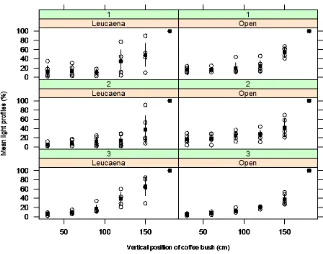
The vertical variation in light reaching different parts of the coffee bush was measured at the Leucaena and Open sites. Despite different light intensities at the top of coffee bushes grown without shade (100% light, 2,096
μmm−2∙s−1) compared to those grown under Leucaena (52% of open conditions, 1089 μmm−2∙s−1), the decline in
light variation from the top to the bottom of the coffee canopy was no different between the two sites (P > 0.05). However, differences in light intensity for the different vertical positions within the coffee canopy were signifi-cant (P < 0.05). Compared to the top of the coffee bushes (180 cm) at the Leucaenasite, light decreased to around 13.4% (280 μmm−2∙s−1) at 90 cm aboveground (the middle) and 7.9% (166 μmm−2∙s−1) at 30 cm
above-ground (the bottom), at the same positions in Open site, however, light intensity dropped to approximately 19.2% (402 μmm−2∙s−1) and 12.3% (258 μmm−2∙s−1) respectively (Figure 3). Light variation for the three different time
measurements and for the north and south directions was not significant (P > 0.05).
3.2. Effect of Light on Coffee Production
3.2.1. Flowering
746
Figure 2. Percentage of incident sunlight measured under the canopy of coffee bushes grown under Durian, Leucaena or Senna shade trees; measurements were made to the north or the south of the coffee bush at dis-tances between 0 and 7.5 m at 1.5 m increments from the shade tree stem at three time intervals during the growing season. The white dots represent the raw data, the black dots show the means and the error bars show the 95% confidence intervals.
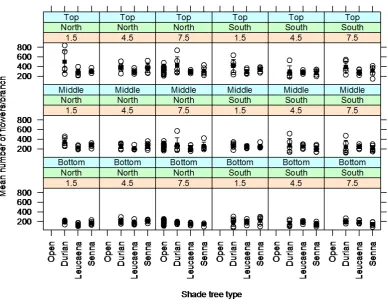
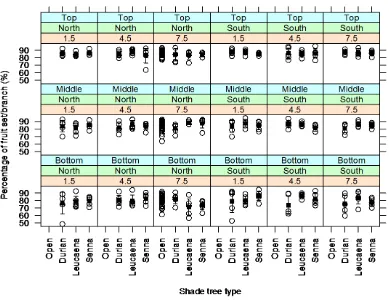
[image:5.595.151.474.421.675.2]Figure4. Flowers produced per branch at three differet heights within the coffee bush: 45 cm (Bottom), 90 cm (Middle) and 170 cm (Top). Coffee bushes were located at a site with no shade (Open, included as 7.5 m data) and sites with bushes located at 1.5, 4.5 or 7.5 m, in both N and S directions, from the stem of three types of shade trees (Durian, Leucaena, Senna) at coffee farms in IaGrai, GiaLai. The white dots represent the raw data, the black dots show the means and the error bars show the 95% confidence intervals.
shaded and unshaded sites. Coffee shaded by Durian which had 278 flowers branch−1 bush−1, tended to have a
little higher than others sites.
In terms of vertical position, shaded and unshaded sites both produced the highest number of flowers at the top of coffee bush (336 and 327 flowers branch−1), followed by the middle (251 and 252 flowers branch−1) and
the bottom (175 and 183 flowers branch−1). Furthermore, data indicated that there was a significant difference in
the amount of flowers branch−1 bush−1 on the vertical positions (P < 2e−16).
3.2.2. Effect of Shade Tree Type on Fruit Setting
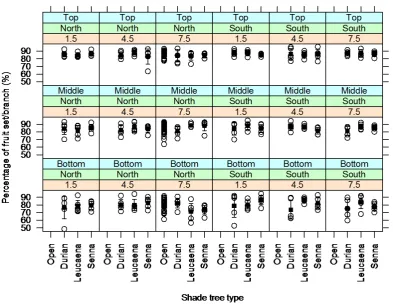
The average proportion of fruit set branch−1 bush−1 for all treatments was above 82% (84.1%, 83.3%, 82.9% and
82.6% for Leucaena, Senna, Open and Durian, respectively) (Figure 5), and there were no significant differenc-es between any of the treatments (P = 0.4). There was also no effect of direction (P = 0.13) (N or S) nor position (P = 0.55) from the shade tree on the proportion of fruit set, however, vertical position was critical (P = 4e−11)
with the top and middle of coffee bushes recording more fruit set than the bottom.
3.2.3. Fruit Fall
The effect of shade tree type on the first fruit drop for the four sites was highly variable, ranging between 2.4% to 4.7% (Figure 6). Average fruit drop was significantly higher in full sun (4.7%) compared to shaded sites (3.1%) with P = 2.43e−8, however, there was similar fruit fall rate in the three shade tree types; Leucaena (2.4%),
Senna (3.6%) and Durian (3.4%). Vertical position did have a significant effect (P = 4.9e−11), fruit drop showed
[image:6.595.121.510.85.390.2]748
Figure 5. Proportion of flowers that developed into fruits on branches at three different heights within the coffee bush: 45 cm (Bottom), 90 cm (Middle) and 170 cm (Top). Coffee bushes were located at a site with no shade (Open, included as 7.5 m data) and sites with bushes located at 1.5, 4.5 or 7.5 m, in both N and S direc-tions, from the stem of three types of shade trees (Durian, Leucaena, Senna) at coffee farms in Ia Grai, Gia Lai. The white dots represent the raw data, the black dots show the means and the error bars show the 95% confidence intervals.
4. Discussion
4.1. Effect of Shade Trees on Light Variation
In this study, reduction in light resulted by three different shade tree species common in Vietnam (Durian, Sen-naand Leucaena), were compared. Light decreased by an average of 50%, 58% and 60% under the canopy of-Durian, Sennaand Leucaena, respectively, compared to unshaded. This finding is similar to the work of Saptono and Ernawati [36], who found that light intensity under mahogany, Tectona grandis, Paraserianthes falcataria
and Acacia mangium was 28% (830 μmm−2∙s−1), 47% (607 μmm−2∙s−1), 62% (443 μmm−2∙s−1) and 65% (403 μmm−2∙s−1) respectively, compared to an unshaded site with total light intensity of 1150 μmm−2∙s−1. This
reduc-tion in light and the variability between trees occurs because the transmittance of light is dependent on the structure and thickness of branches and leaves of the shade trees [37], and density and width of the crown [38].
The small canopy diameter of Durian produced the least shade area and therefore allowed more light to be transmitted than other shade tree species. The small canopy in durian was partly the result of grower’s harvest-ing Durian fruits resultharvest-ing in fewer branches, low crown density and shade area and intensity [36]. Additionally, both Senna and Leucaena have dense crowns, mostly rounded in its early growth, however, as it ages, branches droop, the canopy spreads and it becomes more irregular [39] [40]. In contrast, Durian has almost horizontal upper branches [41].
Figure 6. Percentage of fruit shedding on branches at three different heights within the coffee bush: 45 cm (Bottom), 90 cm (Middle) and 170 cm (Top). Coffee bushes were located at a site with no shade (Open, in-cluded as 7.5 m data) and sites with bushes located at 1.5, 4.5 or 7.5 m, in both N and S directions, from the stem of three types of shade trees (Durian, Leucaena, Senna) at coffee farms in Ia Grai, Gia Lai. The white dots represent the raw data, the black dots show the means and the error bars show the 95% confidence in-terval.
[42] in Brazil found that the canopy of a 5-year-old Arabica coffee bush allowed transmission of only 4% of in-cident light to the soil, and the maximum light intensity at the middle level of the canopy was only 300
μmm−2∙s−1 for a short period during the day. They also reported that decreased light intensity occurred in
re-sponse to decreasing space between the bushes in rows, but that this loss in light intensity did not exceed 200
μmm−2∙s−1. Marur et al. [43] in Brazil, also found that interception of light was affected by different levels
with-in coffee bushes (planted at a density of 2222 coffee bushes ha−1). They related decreased light to increases in
the leaf area from the top (2000 mm2), to the middle (3200 mm2) and bottom (7200 mm2) of the coffee bush.
Therefore, it could be concluded that decreases in light result from increasing branch layers and leaf area [36].
4.2. Effect of Shade on Coffee Production
4.2.1. Flowering
In terms of flowering, there were no significant differences in the average number of flowers per branch per bush between shaded and unshaded coffee. This finding contrasts with previous work that found that shaded coffee produced fewer flowers as a result of fewer flower buds forming per branch, which related the reduction in light intensity [12]-[16]. Our finding also contrasts with, but in the opposite way, the work of Lin [4], who found that coffee grown under shade had more flowers per bush and flowers per node than coffee grown in full sun.
A possible reason for the difference in our findings with the work of others, is that our study was conducted in Vietnam where light intensity is relatively high [30]. Thus under shade trees, the light intensity at the top of cof-fee bushes (approximately 1000 - 1200 μmol∙m−2∙s−1) can still be higher than the optimum suggested for coffee
dimen-750
sions of 3 m × 3 m, shading by adjacent coffee bushes is unlikely to occur, as can happen in bushes with close spacing (3 m × 2.5 m) [32] [44]. Other reasons for the lack of difference between flowering at the open and shaded sites, is that upright growth was prevented due to height control through pruning [32] [45] and lateral branches or secondary growth were regularly pruned. This meant that all bushes were evenly spaced and suffi-ciently far apart to allow light and air to penetrate the foliage [46]. Finally, intensive coffee cultivation in the sites can also could contribute to successful flowering, resulting in insignificant different in flowers [32] [44]. However, in our case, the number of flower per node per branch and amount of node per branch are factors building yield was not investigated.
With respect to vertical position in the coffee canopy, both shaded and unshaded coffee followed the same trend, whereby the number of flowers per branch per bush was similar for the top and middle of the canopy, but these were significantly higher than for the bottom. This result is similar to Lin [4], who reported that self-shad- ing caused significant light limitations and was highly likely to reduce flower bud initiation; the lowest branches and innermost branch nodes produced significantly fewer flowers than the outermost nodes and high and me-dium height branches [47].
A decrease in light intensity was also shown to inhibited flower bud initiation by Can nell [14]. This could be reasonable in our study, because the light intensity at 30 - 90 cm aboveground bushes in our study was about
400 μmm−2∙s−1, which is slightly lower than the saturation light intensity for coffee production. Because the
lower branch position (inside canopy and close to ground) grows slowly and poorly as a result of light and nu-trient competition [33] [48], it forms fewer fruit nodes and young branches, which results in lower yield com-pared to positions above [21]. This further affects yield in this position because flowering is initiated at only one time on the young and strong branch nodes (growth of which is limited in the bottom position) formed the pre-vious year [15] [32] [33] [44] [48].
4.2.2. Fruit Set
Fruit set is an important process in achieving good coffee yield. Studies recognised that coffee, in general, has a low proportion of fruit set, for example, in Brazil, fruit set of Arabica coffee has been reported at around 29%
[45] to 57% [49]. Robusta, on the other hand, has an even lower percentage of fruit set than Arabica. Some au-thors report Robusta fruit set as less than 30% [45], although others have reported that it can be up to, but still less than, 50% [50]. In contrast, in Vietnam, fruit set has been reported to be 90% - 95% in Arabica and 60% - 79% in Robusta [32]. The proportion of fruit set in Robusta in this study was consistent for both the open and shaded sites and averaged 82%, which is slightly higher than that reported by Tiem [32] and much higher than that reported for other countries [45] [50].
Whereas Arabica coffee is self-fertilising, Robusta requires cross-fertilisation, therefore, compared to Arabica coffee, the pollination process in Robusta coffee can be affected by many additional factors. The two main fac-tors that strongly influence pollination are genetic and external conditions [30]. External factors affecting polli-nation include cold or hot temperatures, wind speeds, heavy rains, insect species [51]-[53], the number of flower openings [32]; the number of leaves and flowers on branch, and flower atrophy [15] [32] [33] [45]. Flower numbers and flower opening time could explain the high fruit set proportion observed in our study, as demon-strated in other studies that found that a large number of flowers and > 90% flower bud opening was positively correlated with fruit set [27] [29].
The different fruit set proportions observed for the different vertical branch positions (top, middle and bottom) was also found by Reis and Arruda cited by [45], whereby the lower the branch position has less the proportion of fruit set. This may be a result of restrictions associated with pollen transport due to fewer flowers [32], polli-nators [51] [53] and branch and leaf cover [15] [32].
4.2.3. Fruit Fall
in fruit fall occurred between the top, middle and bottom of the bush, however, this was most likely related to over-production of flower buds [15] rather than other condition as these would have largely consistent across the sites.
Average fruit fall at the four sites in our study ranged between 2.4% and 4.7%, with less fruit fall in the shaded sites compared to the Open site. This contradicts the study of Campanha, Santos [21], who found that Arabica coffee grown under shade in an agroforestry system, hada higher proportion of fruit fall per branch (48%) compared to Arabica grown without shade (11%). However, the amount of fruit set and defoliation in coffee may be unrelated to pinhead drop because during this stage fruit growth is negligible as fruits are dormant
[15] [32].
Because fruit fall is expected to be at its lowest in the first fruit fall period (pinhead drop), resulting from pol-lination failure [43]. The majority of fruit fall actually occurs during the second period as the endosperm fill between June and July [32]; and because fruit set may be unrelated to pinhead drop [15] [32], our measurement offruit fall at this stage is a limitation of our research. Therefore, it would be of benefit to include other stages in further research, especially for purposes of relating fruit fall with fruit set and yield.
5. Conclusions
This study has indicated that the light intensity in coffee declines under shade and that this depends on the shade tree species. Overall, more than 50% of light was intercepted by the canopies of Durian,Senna and Leucaena planted at densities between 35 and 60 shade trees ha−1 and that provided 14% - 34% shade cover, respectively.
Closer to the shade tree, light intensity tended to be decreased. Significant decline in light intensity was also recorded from the top to the bottom of coffee canopy. The number of flowers branch−1∙bush−1 between the
un-shaded and un-shaded sites was similar; however, it was affected by their location in the canopy. Differences in fruit set were also insignificant for the shaded and unshaded coffee among the shaded sites. However, first fruit fall under shade was less than for coffee grown in full sun.
Because of the time limitation, our study had several shortcomings with regard to inability to explore impacts of light on berry yield and quality, and distribution and viability of flowers amongst the branches of the coffee bush. Further research should therefore be conducted to address these limitations in order to better understand production and mechanisms of growth in Robusta coffee in response to shade.
Acknowledgements
Firstly, I would like to thank Dr. Isa Yunusa and Dr. Paul Kristiansen who supervised me to do this research. Thank to Ms. Chris Fyfe for proof reading, and my co-workers Mr. Dung, Mr. Ngoc, for data measurement. Se-condly, I would like to gratefully acknowledge the Australia Awards Scholarships and The University of New England for funding support and assistance and especially for giving me an opportunity to study in Australia. Finally, thanks to the Vietnamese Australia Award staff and my leaders for their great support, and to the West-ern Highland Agriculture and Forestry Science Institute.
References
[1] Staver, C., et al. (2001) Designing Pest-Suppressive Multistrata Perennial Crop Systems: Shade-Grown Coffee in Cen-tral America. Agroforestry Systems, 53, 151-170. http://dx.doi.org/10.1023/A:1013372403359
[2] Sung, P.Q. (1998) Development of Perennial Crops, Coffee in Order to Make Basic Criteria for Sustainable Agricul-ture in Daklak Province. Science and Technology Department, The Western Highland AgriculAgricul-ture and Forest Science Institute, Viet Nam.
[3] Santos, A.B. and Mazzafera, P. (2012) Dehydrins Are Highly Expressed in Water-Stressed Plants of Two Coffee Spe-cies. Tropical Plant Biology, 5, 218-232. http://dx.doi.org/10.1007/s12042-012-9106-9
[4] Lin, B.B. (2008) Microlimate Effects on Flowering Success in Coffee Agroforestry Systems. American-Eurasian
Journal of Agricultural & Environmental Sciences, 3, 148-152.
[5] Nataraj, T. and Subramanian, S. (1975) Effect of Shade and Exposure on the Incidence of Brown Eyespot of Coffee.
Indian Coffee, 39, 179-180.
752
http://dx.doi.org/10.2307/1312989
[8] Perfecto, I., et al. (2005) Biodiversity, Yield, and Shade Coffee Certification. Ecological Economics, 54, 435-446. http://dx.doi.org/10.1016/j.ecolecon.2004.10.009
[9] Reynolds, J.S. (1991) Soil Nitrogen Dynamics in Relation to Groundwater Contamination in the Valle Central, Costa Rica.
[10] Souza, H.N.D., et al. (2012) Protective Shade, Tree Diversity and Soil Properties in Coffee Agroforestry Systems in the Atlantic Rainforest Biome. Agriculture, Ecosystems & Environment, 146, 179-196.
http://dx.doi.org/10.1016/j.agee.2011.11.007
[11] Barradas, V.L. and Fanjul, L. (1986) Microclimatic Characterization of Shaded and Open-Grown Coffee (Coffea ara-bica) Plantations in Mexico. Agricultural and Forest Meteorology, 38, 101-112.
http://dx.doi.org/10.1016/0168-1923(86)90052-3
[12] Baggio, A.J., et al. (1997) Productivity of Southern Brazilian Coffee Plantations Shaded by Different Stockings of
Gravillea robusta. Agroforestry Systems, 37, 111-120. http://dx.doi.org/10.1023/A:1005814907546
[13] Beer, J., et al. (1998) Shade Management in Coffee and Cacao Plantations. Agroforestry Systems, 38, 139-164. http://dx.doi.org/10.1023/A:1005956528316
[14] Cannell, M.G.R. (1975) Crop Physiological Aspects of Coffee Bean Yield: A Review.
[15] Cannell, M.G.R. (1985) Physiology of the Coffee Crop. In: Clifford, M.N. and Willson, K.C., Eds., Coffee, Springer, Berlin, 108-134. http://dx.doi.org/10.1007/978-1-4615-6657-1_5
[16] Montoya, L.A., Sylvain, P.G. and Umana, R. (1961) Effect of Light Intensity and Nitrogen Fertilization upon Growth Differentiation Balance in Coffea arabica L. Coffee, 3, 97-104.
[17] Siles, P., Harmand, J.-M. and Vaast, P. (2009) Effects of Inga densiflora on the Microclimate of Coffee (Coffea arabi-ca L.) and Overall Biomass under Optimal Growing Conditions in Costa Rica. Agroforestry Systems, 78, 269-286. http://dx.doi.org/10.1007/s10457-009-9241-y
[18] Vaast, P., et al. (2006) Fruit Thinning and Shade Improve Bean Characteristics and Beverage Quality of Coffee (
Cof-fea arabica L.) under Optimal Conditions. Journal of the Science of Food and Agriculture, 86, 197-204.
http://dx.doi.org/10.1002/jsfa.2338
[19] Abruna, F., Silva, S. and Chandler, J.V. (1966) Effects of Yields, Shade and Varieties on Size of Coffee Beans.
Jour-nal of Agriculture of the University of Puerto Rico, 4, 230-266.
[20] Haggar, J., et al. (2011) Coffee Agroecosystem Performance under Full Sun, Shade, Conventional and Organic Man-agement Regimes in Central America. Agroforestry Systems, 82, 285-301.
http://dx.doi.org/10.1007/s10457-011-9392-5
[21] Campanha, M., et al. (2004) Growth and Yield of Coffee Plants in Agroforestry and Monoculture Systems in Minas Gerais, Brazil. Agroforestry Systems, 63, 75-82. http://dx.doi.org/10.1023/B:AGFO.0000049435.22512.2d
[22] ICO (2015) Total Production by Exporting Countries. International Coffee Organisation, London. [23] Daniele, G., et al. (2004) Vietnam Coffee Sector Report. World Bank, Washington DC.
[24] Marsh, A. (2007) Diversification by Smallholder Farmers: Viet Nam Robusta Coffee. Food and Agriculture Organisa-tion of the United NaOrganisa-tions, Rome.
[25] Jha, S., et al. (2014) Shade Coffee: Update on a Disappearing Refuge for Biodiversity. BioScience, 64, 416-428. http://dx.doi.org/10.1093/biosci/biu038
[26] Tiem, H.T. and Minh, T.D. (2001) Present Status of Coffee Industry in Vietnam and Opportunities for Special-ty/Organic Coffee Production. Chiang Mai, Thailand, 26-28.
[27] WASI (2008) Final Report of Science and Technology 2004-2006: Study on Scientific and Socioeconomic Strategies in Order to Sustainable Perennial Plantations in Western Highlands. The Western Highland Agriculture and Forestry Science Institute, Viet Nam.
[28] GSOV (2014) Gia Lai Statistical Year Book of Year 2013. General Statistics Office of Vietnam, Gia Lai Province. [29] Phuc, V.N. and Long, N.V. (2012) Final Report: The Investigation of Practical Coffee Production Status on Five
Dis-trists in Gialai Provence. Gialai Research and Experimental Centre for Irrigation and Agriculture & Forestry—WASI, Gia Lai.
[30] Tiem, H.T. (1999) Ecological Requirement of Coffee. In: Nhan, D.T., Tiem, H.T. and Sung, P.Q., Eds., Coffee Crop in
Vietnam, Agriculture Publication, Ha Noi, 51-63.
[31] Dussi, M.C., Giardina, G. and Reeb, P. (2005) Shade Nets Effect on Canopy Light Distribution and Quality of Fruit and Spur Leaf on Apple cv.Fuji. Spanish Journal of Agricultural Research, 3, 253-260.
[32] Tiem, H.T. (1999) Coffee Physiology. In: Nhan, D.T., Tiem, H.T. and Sung, P.Q., Eds., Coffee Crop in Vietnam, Agriculture Publication, Ha Noi, 64-86.
[33] Dao, N.T. (2003) Coffea. In: Hieu, N.M., Ed., Industrial Crop Textbook. Industrial Plants Curriculum, Agricutural Publication, Ha Noi.
[34] R Core Team (2015) R: A Language and Environment for Statistical Computing. R Foundation for Statistical Compu-ting, Vienna.
[35] Afshartous, D. and Preston, R.A. (2010) Confidence Intervals for Dependent Data: Equating Non-Overlap with Statis-tical Significance. Computational Statistics & Data Analysis, 54, 2296-2305.
http://dx.doi.org/10.1016/j.csda.2010.04.011
[36] Saptono, M. and Ernawati, N.C.C.H. (2011) Growth and Yield of Cassava in Agro Forestry System Using Crown Tree Management: Crown Pruning for Optimization Light Interception. Agrivita, 33, 22-31.
[37] Larcher, W. (1995) Physiological Plant Ecology. 3rd Edition, Springer, Berlin. http://dx.doi.org/10.1007/978-3-642-87851-0
[38] Suryanto, P., Tohari, M.S. and Sabarnurdin (2005) Dinamics of Resources Sharing System in Agroforestry: Based of Compilation Consideration Silviculture Strategy. Agriculture Science Journal, 2, 165-178.
[39] Orwa, C., et al. (2009) Agroforestree Database: A Tree Reference and Selection Guide Version 4.0. http://www.worldagroforestry.org/af/treedb/
[40] Research, P.C.F.A. and Sciences, N.A.O. (1984) Leucaena: Promising Forage and Tree Crop for the Tropics Report. National Academy of Sciences, Washington DC.
[41] O’Gara, E., Guest, D.I. and Hassan, N.M. (2004) Botany and Production of Durian (Durio zibethinus) in Southeast Asia. In: Drenth, A. and Guest, D. I., Eds., Diversity and Management of Phytophthora in Southeast Asia, Australian Centre for International Agricultural Research, Canberra, 180.
[42] Robledo, A.J. and Santos, J.M. (1980) Balance of Solar Radiation in Coffee Cultivars Catuai and Yellow Bourbon.
Cenicafe, 31, 86-104.
[43] DaMatta, F.M. (2004) Ecophysiological Constraints on the Production of Shaded and Unshaded Coffee: A Review.
Field Crops Research, 86, 99-114. http://dx.doi.org/10.1016/j.fcr.2003.09.001
[44] Nam, T.N.T. and Hong, T. (1999) Session IV: Cultivation; Chapter I: Land and Fertilizer. In: Nhan, D.T., Tiem, H.T. and Sung, P.Q., Eds., Coffee Crop in Vietnam, Agriculture Publication, Hai Noi, 235-286.
[45] DaMatta, F.M., et al. (2008) Ecophysiology of Coffee Growth and Production. Brazilian Journal of Plant Physiology,
19, 485-510. http://dx.doi.org/10.1590/S1677-04202007000400014
[46] Haarer, A.E. (1962) Modern Coffee Production. 2nd Edition, Modern Coffee Production, London.
[47] Huxley, P.A. (1967) The Effects of Artificial Shading on Some Growth Characteristics of Arabica and Robusta Coffee Seedlings. I. The Effects of Shading on Dry Weight, Leaf Area and Derived Growth Data. Journal of Applied Ecology,
4, 291-308. http://dx.doi.org/10.2307/2401337
[48] Bau, L.N. (1999) Coffee Planting and Nursing Technologies. In: Nhan, D.T., Tiem, H.T. and Sung, P.Q., Eds., Coffee
Crop in Vietnam, Agriculture Publication, Ha Noi, 287-323.
[49] Ronchi, C.P., et al. (2005) Effect of 2,4-Dichlorophenoxyacetic Acid Applied as a Herbicide on Fruit Shedding and Coffee Yield. Weed Research, 45, 41-47. http://dx.doi.org/10.1111/j.1365-3180.2004.00427.x
[50] Krishnan, S., et al. (2012) Status of Pollinators and Their Efficiency in Coffee Fruit Set in a Fragmented Landscape Mosaic in South India. Basic and Applied Ecology, 13, 277-285. http://dx.doi.org/10.1016/j.baae.2012.03.007
[51] Klein, A.M., Dewenter, I.S. and Tscharntke, T. (2003) Pollination of Coffea canephora in Relation to Local and Re-gional Agroforestry Management. Journal of Applied Ecology, 40, 837-845.
http://dx.doi.org/10.1046/j.1365-2664.2003.00847.x
[52] Vergara, C.H. and Badano, E.I. (2009) Pollinator Diversity Increases Fruit Production in Mexican Coffee Plantations: The Importance of Rustic Management Systems. Agriculture, Ecosystems & Environment, 129, 117-123.
http://dx.doi.org/10.1016/j.agee.2008.08.001