How to cite this paper: Bady, M. (2014) Analysis of Outdoor Human Thermal Comfort within Three Major Cities in Egypt. Open Access Library Journal, 1: e457. http://dx.doi.org/10.4236/oalib.1100457
Analysis of Outdoor Human Thermal
Comfort within Three Major Cities in Egypt
Mahmoud BadyDepartment of Environmental Engineering, Egypt-Japan University of Science and Technology (E-JUST), New Borg El-Arab City, Alexandria, Egypt
Email: mahmoud.bady@ejust.edu.eg
Received 10 April 2014; revised 20 May 2014; accepted 10 July 2014
Copyright © 2014 by author and OALib.
This work is licensed under the Creative Commons Attribution International License (CC BY). http://creativecommons.org/licenses/by/4.0/
Abstract
In this study, two thermal comfort indices are employed to investigate outdoor human thermal comfort within three major cities of different climates in Egypt. The indices are: the Discomfort Index (DI), and the Robaa Index (RI). The three considered cities are: Alexandria which is located in the north of Egypt, Cairo which is located in the middle and Aswan city which is located in the south of Egypt. The estimations of the two indices are based on the mean wind data of the three ci-ties, which covers the period from January 2010 to January 2011. The study results show that the thermal comfort indices values can be employed to evaluate climate differences in urban areas. The calculated indices showed that; although extreme climate conditions are not reached in Egypt in general, the climate in the north is milder than in the south. In addition, the study results show that the RI is more practical than DI in assessing the human thermal comfort in the outdoor envi-ronment.
Keywords
Thermal Comfort Indices, Egypt, Outdoor Environment
Subject Areas: Environmental Sciences, Mechanical Engineering
1. Introduction
fac-OALibJ | DOI:10.4236/oalib.1100457 2 July 2014 | Volume 1 | e457 tors leads to thermal comfort for human.
There are many indices that have been suggested and employed throughout the open literature to assess the outdoor human thermal comfort. Throughout the literature; there are about 40 indices of thermal comfort [1]. Some of these indices, such as the Discomfort Index (DI) [2], Robaa index (RI) [3] [4], and the Predicted Mean Vote index (PMV) [5] [6] merit special mention as they appear continuously in literature. The Discomfort Index was first proposed by Thom in 1959 [2]. It is an empirical index based on a large series of observations and it is only function of air dry bulb temperature and relative humidity. The second index is the Robaa index [3]. It is suggested by Robaa [4] to account for the combined effect of the three weather elements, dry bulb air tempera-ture, relative humidity and wind speed, on the human discomfort. The range of applicability of RI is wide and it was proven to be adequate for Egypt’s climate [4]. It illustrates the integrated effect of both wind speed and rel-ative humidity changes on the human thermal comfort. In this study, both DI and RI are employed for three ma-jor cities in Egypt in order to clarify the effect of the differences in climate at the northern, middle and southern parts of Egypt on outdoor human thermal comfort. The cities are: Alexandria city which is located in the north of Egypt, Cairo the capital of Egypt which is located in the middle and Aswan city which is located in the south of Egypt (See Egypt map in Figure 1). The study investigation is based on the mean hourly measured meteoro-logical data for the three cities, over a period of thirteen months ranging from January 2011 to January 2012.
2. Thermal Comfort Indices
Various attempts have been carried out in order to estimate empirical indices for the assessment of the outdoor human thermal comfort. These indices integrate the thermal and relative humidity effects of the outdoor envi-ronment on the level of human thermal stress. These indices have been applied at a variety of scales from global to local [7]-[11].
The Discomfort Index (DI) is an empirical index based on a large series of observations. It is depending on the dry bulb air temperature and relative humidity. Discomfort increases as DI increases and it is given as fol-lows [2]:
(
) (
)
d d
DI=T −0.55 1 0.01RH− × T −14.5 (1)
where Td is the mean hourly value of the air dry bulb temperature (˚C) and RH is the corresponding hourly value of the relative humidity (%).
The ranges and classifications of the DI values are given by [12] as presented in Table 1.
Recently, Robaa [3] [4] proposed a formula that considers combination effects of the three weather elements; dry bulb air temperature, relative humidity and wind speed on outdoor human thermal discomfort. The RI index is expressed as follows [3] [4]:
d w
RI=1.53T −0.32T −1.38V+44.65 (2) where Tw is the air wet bulb temperature (˚C), and V is the wind speed (m/s).
The range of applicability of RI formula is wide and adequate for Egypt’s climate [4]. The ranges criterions of RI are given by [3] as presented in Table 2.
In this study, comparison of the outdoor human thermal comfort in three major Egyptian cities based on two different indices is presented. Figure 1 shows a map of Egypt where the three considered cities are shown. In addition, the coordinates of the three cities are given in Table 3.
The measured meteorological data of hourly-mean air dry bulb temperature, wind velocity and relative hu-midity are the input for determination of thermal comfort indices during the period from January 2011 to Janu-ary 2012. The input data have been obtained from the Egyptian Meteorological Agency (EMA).
3. Results and Discussions
3.1. Measured Meteorological Data 3.1.1. The Variation of Air Temperature
OALibJ | DOI:10.4236/oalib.1100457 3 July 2014 | Volume 1 | e457 Figure 1. Map of Egypt shows the three understudy cities.
Table 1. Classifications of the DI values [12].
DI (˚C) Discomfort conditions
DI < 21 No discomfort
21 ≤ DI < 24 Less than 50% of people feel discomfort 24 ≤ DI < 27 More than 50% of people feel discomfort 27 ≤ DI < 29 Most of people feel discomfort.
29 ≤ DI < 32 Very strong discomfort
DI ≥ 32 Medical emergency
Table 2. RI values for different human feelings [3].
RI values Discomfort conditions
RI < 60 All people feel quite uncomfortable cooling 60 ≤ RI < 65 50% of people feel partial uncomfortable cooling 65 ≤ RI < 75 All people feel quite comfortable 75 ≤ RI < 80 50% of people feel partial uncomfortable heat 80 ≤ RI < 85 All people feel quite uncomfortable heat
RI ≤ 85 All people feel extreme serious uncomfortable heat
Table 3. RI values for different human feelings [3].
City Latitude (oN) Longitude (oE)
Alexandria 31.2000 29.9167
Cairo 30.0566 31.2262
Aswan 24.0667 32.9167
OALibJ | DOI:10.4236/oalib.1100457 4 July 2014 | Volume 1 | e457
(a) (b)
Figure 2. Variation of mean air dry bulb temperature at Alexandria, Cairo and Aswan during the period from January 2011 to January 2012; (a) average daily values and (b) average monthly values.
3.1.2. The Variation of Relative Humidity
Figure 3illustrates the characteristic features of the variation of relative humidity RH at the three cities during the period Jan 2011-Jan 2012. Figure 3(a) is the daily variation of RH, while Figure 3(b) represents the monthly value variation. As can be seen from the figure, the RH monthly distribution, a large variation in the relative humidity is illustrated between Alexandria city, which is located along the Mediterranean Sea, and As-wan city which is located at the south of Egypt. The minimum value attained in AsAs-wan was in July (18.16%), while the maximum recorded value in Alexandria was in December (73.55%). The RH monthly distribution is as expected, to be the inverse relationship between relative humidity and air dry bulb temperature (See Figure 3). Also, the figure shows that Alexandria has the highest values of RH among the other cities all over the year. This is due to the evaporation processes form the Mediterranean Sea. However, Aswan city has lower value of RH compared with other cities during all over the year due to the high temperature with reduced areas of water surfaces compared to both Cairo and Alexandria cities.
3.1.3. The Variation of Wind Velocity
The mean wind speed trends of the three cities are shown in Figure 4. It could be noticed that; the mean wind speed values at Aswan are almost lower than Cairo and Alexandria over the study period, except for winter sea-son months. As can be seen from the figure, the large fluctuations in the measured wind velocity are observed for each city, particularly in Alexandria and Cairo cities.
From the data presented in Figure 4 for Alexandria city, the monthly average wind speed has the lowest value in January (2.80 m/s) and the maximum value in May (5.12 m/s). In Cairo, the monthly average wind speed has the lowest value in January (2.46 m/s) and the maximum value in March (4.97 m/s). The fluctuations in the measured wind speed in Aswan are quite small compared with Alexandria and Cairo. The monthly average wind velocity has the lowest value in January (3.03 m/s) and the maximum value in October (3.81 m/s).
The wind roses of the three cities are shown in Figure 5. Clearly, the fluctuations in the incident wind direc-tion over Alexandria city are higher than the other two cities. Comparing the wind direcdirec-tion fluctuadirec-tions in both Cairo and Aswan cities, Cairo city has more fluctuations during the study period. However, the dominant direc-tion of the prevailing wind in the three cities is the north (N).
3.1.4. Discomfort Index (DI)
The hourly-average discomfort index values during the study period from January 2011 to January 2012 for the three considered cities are shown in Figure 6. In this study, the values of DI are evaluated based on the hourly- average air dry bulb temperature and relative humidity.
OALibJ | DOI:10.4236/oalib.1100457 5 July 2014 | Volume 1 | e457
(a) (b)
Figure 3. Variation of relative humidity at Alexandria, Cairo and Aswan cities during the period from January 2011 to January 2012; (a) average daily values and (b) average monthly values.
(a) (b)
Figure 4. Variation wind velocity at Alexandria, Cairo and Aswan cities during the period from January 2011 to January 2012; (a) average daily values and (b) average monthly values.
[image:5.595.91.538.86.258.2](a) (b) (c)
Figure 5. Wind roses of the three cities.
[image:5.595.89.538.295.470.2] [image:5.595.90.540.510.660.2]OALibJ | DOI:10.4236/oalib.1100457 6 July 2014 | Volume 1 | e457 Figure 6. Variation of DI for the three cities during the period from Jan. 2011 to Jan. 2012.
In the comfort range, (DI < 21), in which the human in the three cities feel quite comfortable during the period from January to May and from October to next January. Also, it can be noticed the tendency of DI values for Aswan city in the range of the uncomfortable region during the period from January to May.
The number of days for different DI ranges in Alexandria for the study period is presented in Table 4. The index values reflect the fact that Alexandria has good climate conditions all over the year. During the study pe-riod, the number of comfort weather days (DI < 21) is 259 days, which is more than 65% of the study period. Also, for Alexandria, the first discomfort range (21 ≤ DI < 24) covers the months from March to November with most of such period is found in June month. These values represent about 18 % of the study period. The second discomfort range (24 ≤ DI < 27) covers the range from May to September with most of this period is found dur-ing July and August and represents more than 19% of the study period. Concerndur-ing the extreme discomfort con-ditions, it is not found in Alexandria. The discomfort index did not exceed the value of 29 during any of the months of the study period. However, this does not reflect the fact that; extreme climate conditions are not reached in Alexandria city.
The number of days for different comfort categories in Cairo city is presented in Table 5. Similar to Alexan-dria, the DI values reflect good climate conditions during 9 months of the study period. The number of comfort days (DI < 21) is 250 days, which is more than 63% of the study period.
The first discomfort range (21 ≤ DI < 24) covers the months from April to October with most of such period occurs in May and June months and represents 16% of the study period. The second discomfort range (24 ≤ DI < 27) covers the range from May to October with most of such period is found in July and August months. It represents more than 24% of the study period. The extreme discomfort conditions are not found in Cairo city since the DI values did not exceed the value of 29 during any months of the study period.
The number of days for different comfort categories in Aswan city is presented in Table 6. The DI values re-flect good climate conditions during 8 months of the study period. The number of comfort weather days (DI < 21) is 217 days, which represents more than 54% of the study period.
OALibJ | DOI:10.4236/oalib.1100457 7 July 2014 | Volume 1 | e457 Table 4. Number of different comfort categories in Alexandria from Jan. 2011 to Jan. 2012.
Month Comfort Ranges
DI < 21 21 ≤ DI < 24 21 ≤ DI < 24 27 ≤ DI < 29 27 ≤ DI < 29 DI ≥ 32
[image:7.595.89.538.289.447.2]Jan. 2011 Feb. 2011 Mar. 2011 Apr. 2011 May 2011 Jun. 2011 Jul. 2011 Aug. 2011 Sept. 2011 Oct. 2011 Nov. 2011 Dec. 2011 Jan. 2012 31 28 29 28 17 3 0 0 1 31 29 31 31 0 0 2 2 13 25 3 0 11 17 1 0 0 0 0 0 0 1 2 28 29 18 0 0 0 0 0 0 0 0 0 0 0 2 0 0 0 0 0 0 0 0 0 0 0 0 0 0 0 0 0 0 0 0 0 0 0 0 0 0 0 0 0 0 0
Table 5. Number of different comfort categories in Cairo from Jan. 2011 to Jan. 2012.
Month Comfort Ranges
DI < 21 21 ≤ DI < 24 21 ≤ DI < 24 27 ≤ DI < 29 27 ≤ DI < 29 DI ≥ 32
Jan. 2011 Feb. 2011 Mar. 2011 Apr. 2011 May 2011 Jun. 2011 Jul. 2011 Aug. 2011 Sept. 2011 Oct. 2011 Nov. 2011 Dec. 2011 Jan. 2012 31 28 31 24 13 0 0 0 0 31 30 31 31 0 0 0 6 16 18 2 0 8 14 0 0 0 0 0 0 0 2 12 28 31 22 1 0 0 0 0 0 0 0 0 0 0 1 0 0 0 0 0 0 0 0 0 0 0 0 0 0 0 0 0 0 0 0 0 0 0 0 0 0 0 0 0 0 0
Table 6. Number of different comfort categories in Aswan from Jan. 2011 to Jan. 2012.
Month Comfort Ranges
DI < 21 21 ≤ DI < 24 21 ≤ DI < 24 27 ≤ DI < 29 27 ≤ DI < 29 DI ≥ 32
Jan. 2011 Feb. 2011 Mar. 2011 Apr. 2011 May 2011 Jun. 2011 Jul. 2011 Aug. 2011 Sept. 2011 Oct. 2011 Nov. 2011 Dec. 2011 Jan. 2012 31 25 26 12 1 0 0 0 0 31 29 31 31 0 3 5 17 16 1 1 0 5 19 1 0 0 0 0 0 1 14 29 23 29 25 10 0 0 0 0 0 0 0 0 0 7 2 0 0 0 0 0 0 0 0 0 0 0 0 0 0 0 0 0 0 0 0 0 0 0 0 0 0 0 0 0 0 0
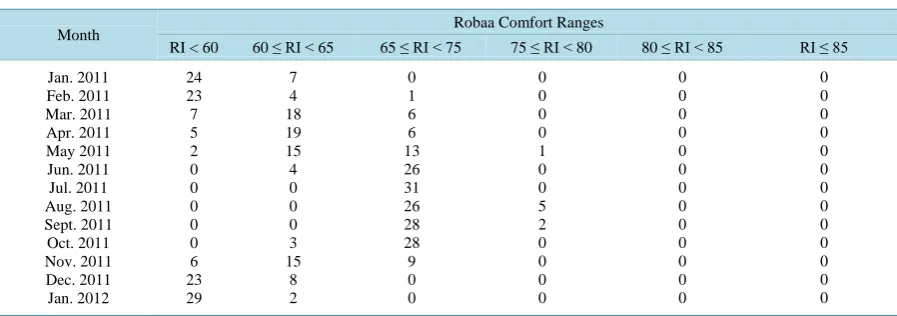
[image:7.595.89.538.471.625.2]OALibJ | DOI:10.4236/oalib.1100457 8 July 2014 | Volume 1 | e457 Table 7. Number of different comfort categories in Alexandria from Jan. 2011 to Jan. 2012.
Month Robaa Comfort Ranges
RI < 60 60 ≤ RI < 65 65 ≤ RI < 75 75 ≤ RI < 80 80 ≤ RI < 85 RI ≤ 85
Jan. 2011 Feb. 2011 Mar. 2011 Apr. 2011 May 2011 Jun. 2011 Jul. 2011 Aug. 2011 Sept. 2011 Oct. 2011 Nov. 2011 Dec. 2011 Jan. 2012
24 23 7 5 2 0 0 0 0 0 6 23 29
7 4 18 19 15 4 0 0 0 3 15
8 2
0 1 6 6 13 26 31 26 28 28 9 0 0
0 0 0 0 1 0 0 5 2 0 0 0 0
0 0 0 0 0 0 0 0 0 0 0 0 0
0 0 0 0 0 0 0 0 0 0 0 0 0
days for 50% of people (75 ≤ RI < 80) in Alexandria city during the study period is 8 days. Furthermore, the discomfort index did not exceed 80 during the study period.
3.2. Robaa Index (RI)
The hourly average Robaa Index (RI) values for the three cities under investigation during the period from Jan-uary 2011 to JanJan-uary 2012 are shown in Figure 7. The numbers of days for different comfort categories in Alexandria, Cairo and Aswan cities respectively, during the period from January 2011 to January 2012 are shown in Table 7 through Table 9. As can be seen from Table 7, Alexandria city has quite human thermal un-comfortable cold weather (RI < 60) during eight months, from January to May and from November to January. It is also and May months have minimum number of quite uncomfortable cooling days (2 days) and (5 days) re-spectively. On the other hand, during the study period, Alexandria city has quite comfortable weather (65 ≤ RI < 75) in most months of the year with days number differs from month to another as can be seen in Table 7. It is noticed that the months of July, September and October are the most thermal comfortable months for the Alex-andria city. These three months have 87 days of quite comfortable. It is also found that, all total number of hot discomfort days for 50% of people (75 ≤ RI < 80) in Alexandria city during the study period is 8 days. Further-more, the discomfort index did not exceed 80 during the study period.
The results of RI categories estimated in Cairo city are presented inTable 8. It is found that Cairo city has quite uncomfortable cooling, (RI < 60), during six months of the study period. It is noticed that, January 2012 month has maximum number of quite uncomfortable cooling days (31 days), while November month have minimum number of quite uncomfortable cooling days (3 days). On the other hand, during both study periods, Cairo city has quite comfortable (65 ≤ RI < 75), in most months of the year with days number differs from month to another (See Table 5). It is noticed that the months of May, June, September and October are the most comfortable months for Cairo city. These months have 89 days of quite comfortable. It is also found that, all to-tal number of partial uncomfortable heat (75 ≤ RI < 80) days for the study period is 72 days. In addition, dis-comfort index exceeded the value of 80 just for 3 days during the months of June and October. Fortunately, the discomfort index did not exceed the value of 85 during any month of the study periods at Cairo city.
OALibJ | DOI:10.4236/oalib.1100457 9 July 2014 | Volume 1 | e457 Figure 7. Hourly variation of RI for the three cities during the period from Jan. 2011 to Jan. 2012.
Table 8. Number of different comfort categories in Cairo from Jan. 2011 to Jan. 2012.
Month Robaa Comfort Ranges
RI < 60 60 ≤ RI < 65 65 ≤ RI < 75 75 ≤ RI < 80 80 ≤ RI < 85 RI ≤ 85
Jan. 2011 Feb. 2011 Mar. 2011 Apr. 2011 May 2011 Jun. 2011 Jul. 2011 Aug. 2011 Sept. 2011 Oct. 2011 Nov. 2011 Dec. 2011 Jan. 2012
13 12 14 0 0 0 0 0 0 0 3 21 31
18 16 15 15 4 0 0 0 0 3 21 10 0
0 0 2 12 21 24 11 5 19 25 6 0 0
0 0 0 3 6 4 20 26 11 2 0 0 0
0 0 0 0 0 2 0 0 0 1 0 0 0
0 0 0 0 0 0 0 0 0 0 0 0 0
3.3. Comparison between DI and RI
In order to evaluate the applicability of both DI and RI in assessing the human thermal comfort in outdoor envi-ronment, comparison between their values during the study period is carried out. The comfortable feeling condi-tion using RI is satisfied when 65 ≤ RI < 75, while the same feeling using DI is satisfied when DI < 21. Accor-dingly, Table 10 presents the number of days in the three cities for comfort weather condition, as estimated by the two indices.
Clearly seen from the table, the percentage of comfort days in the three cities estimated by DI is more than that estimated by RI. For the case of Alexandria city, the percentage of comfort days estimated by DI is 65% of the study period, while the percentage of comfort days determined by RI is 44%. These values show that the; in Alexandria, (Comfort days)DI = 1.5 (Comfort days)RI. While in Cairo and Aswan cities, the similar ratio is 2.0 and 2.2 respectively.
OALibJ | DOI:10.4236/oalib.1100457 10 July 2014 | Volume 1 | e457 Table 9. Number of different comfort categories in Aswan from Jan. 2011 to Jan. 2012.
Month Robaa Comfort Ranges
RI < 60 60 ≤ RI < 65 65 ≤ RI < 75 75 ≤ RI < 80 80 ≤ RI < 85 RI ≤ 85
Jan. 2011 Feb. 2011 Mar. 2011 Apr. 2011 May 2011 Jun. 2011 Jul. 2011 Aug. 2011 Sept. 2011 Oct. 2011 Nov. 2011 Dec. 2011 Jan. 2012 6 0 0 0 0 0 0 0 0 0 0 3 16 20 12 6 0 0 0 0 0 0 0 13 20 14 5 14 21 17 7 0 0 0 0 10 16 8 1 0 2 3 10 8 3 0 0 7 17 1 0 0 0 0 1 3 11 23 14 25 23 3 0 0 0 0 0 0 0 5 4 17 6 0 1 0 0 0
Table 10. Number of comfort days in the three cities during the study period estimated by the two indices.
Month
Number of comfort weather days
Alexandria Cairo Aswan
DI (DI < 21)
RI
(65 ≤ RI < 75) (DI < 21) DI
RI
(65 ≤ RI < 75) (DI < 21) DI
RI (65 ≤ RI < 75)
Jan. 2011 Feb. 2011 Mar. 2011 Apr. 2011 May 2011 Jun. 2011 Jul. 2011 Aug. 2011 Sept. 2011 Oct. 2011 Nov. 2011 Dec. 2011 Jan. 2012 31 28 29 28 17 3 0 0 1 31 29 31 31 0 1 6 6 13 26 31 26 28 28 9 0 0 31 28 31 24 13 0 0 0 0 31 30 31 31 0 0 2 12 21 24 11 5 19 25 6 0 0 31 25 26 12 1 0 0 0 0 31 29 31 31 5 14 21 17 7 0 0 0 0 10 06 8 1
Total 259 174 250 125 217 99
Percent 65.4% 43.9% 63.1% 31.5% 54.7% 25.0%
According to Equation (1), the discomfort index (DI) does not include the effect of wind speed in human thermal comfort assessment. This appears clearly in the large number of comfort days, which neglect the days of gust speed that, if considered, affects the comfort feeling, which in turn, decreases the number of comfort days. On the other hand, the estimated comfort days by RI appear to be more practical than those estimated by DI. This is due to the fact that; Robaa index is accounting for the combined effects of the three weather elements (as illustrated by Equation (2)); air dry bulb temperature, relative humidity and wind speed; when assessing thermal human comfort.
4. Conclusions
The present study investigated the climate variations in Egypt through the estimation of two thermal comfort in-dices; the Discomfort index (DI), and the Robaa index (RI). In order to investigate the spatial variations of these indices over Egypt, three cities of different climates are considered; Alexandria city which is located in the ex-treme north of Egypt, Cairo city which is located in the middle and Aswan city which is located in the exex-treme south of Egypt. The study results showed that:
1) The thermal comfort indices values can be employed to evaluate climate differences in urban areas. 2) Although extreme climate conditions are not reached in Egypt in general, the climate in the north is milder than in the south.
[image:10.595.89.540.284.488.2]OALibJ | DOI:10.4236/oalib.1100457 11 July 2014 | Volume 1 | e457 to that, RI accounts for the combined effects of dry air temperature, humidity and wind speed, while DI does not include the effect of wind speed in human thermal comfort assessment.
References
[1] Marc, A., Konstantinos, E., Konstantinos, D. and John-Alexander, M. (2010) Applying Thermal Comfort Indices to Investigate Aspects of the Climate in Greece. International Review of Chemical Engineering, 2, 204-209.
[2] Thom, E.C. (1959) The Discomfort Index. Weatherwise, 12, 57-60
http://dx.doi.org/10.1080/00431672.1959.9926960
[3] Robaa, S. (2011) Effect of Urbanization and Industrialization Processes on Outdoor Thermal Human Comfort in Egypt.
Atmospheric and Climate Sciences, 1, 100-112.
[4] Robaa, S. (2003) Thermal Human Comfort in Egypt. International Journal of Meteorology, 283, 359-371.
[5] McGregor, G.R., Markou, M.T., Bartzokas, A. and Katsoulis, B.D. (2002) An Evaluation of the Nature and Timing of Summer Human Thermal Discomfort in Athens, Greece. Climate Research, 20, 83-94.
http://dx.doi.org/10.3354/cr020083
[6] Fanger, P. (1973) Assessment of Man’s Thermal Comfort in Practice. British Journal of Industrial Medicine, 30, 313- 324.
[7] Gregorczuk, M. and Cena, K. (1967) Distribution of Effective Temperature over the Globe. International Journal of Biometeorology, 2, 35-39.
[8] Terjung, W.H. (1968) World Patterns of Distribution of the Monthly Comfort Index. International Journal of Bio-meteorology, 12, 119-151. http://dx.doi.org/10.1007/BF01553502
[9] Jauregui, E. (1991) The Human Climate of Tropical Cities an Overview. International Journal of Biometeorology, 35, 151-160. http://dx.doi.org/10.1007/BF01049061
[10] McGregor, G.R. (1993) A Preliminary Assessment of the Spatial and Temporal Characteristics of Human Thermal Comfort in China. International Journal of Climatology, 13, 707-725.
http://dx.doi.org/10.1002/joc.3370130702
[11] McGregor, G.R. (1995) The Human Bio-Climates of Western and South Pacific Islands and Climate Change. Interna-tional Journal of Biometeorology, 39, 5-12. http://dx.doi.org/10.1007/BF01320886