Early Detection and Prevention of Cancer using Data
Mining Techniques
P.Ramachandran
Ph.D Research Scholar,Department of CS&A, SCSVMV University,
Kanchipuram, India
N.Girija, Ph.D
Lecturer, Department of IT, Higher College of Technology, Ministry of Manpower, MuscatT.Bhuvaneswari, Ph.D
Asst.Professor, Department of CS&A, L. N. Govt. Arts & Science College, Chennai, IndiaABSTRACT
Cancer is one of the leading causes of death worldwide. Early detection and prevention of cancer plays a very important role in reducing deaths caused by cancer. Identification of genetic and environmental factors is very important in developing novel methods to detect and prevent cancer. Therefore a novel multi layered method combining clustering and decision tree techniques to build a cancer risk prediction system is proposed here which predicts lung, breast, oral, cervix, stomach and blood cancers and is also user friendly, time and cost saving. This research uses data mining technology such as classification, clustering and prediction to identify potential cancer patients. The gathered data is preprocessed, fed into the database and classified to yield significant patterns using decision tree algorithm. Then the data is clustered using K- means clustering algorithm to separate cancer and non cancer patient data. Further the cancer cluster is subdivided into six clusters. Finally a prediction system is developed to analyze risk levels which help in prognosis. This research helps in detection of a person’s predisposition for cancer before going for clinical and lab tests which is cost and time consuming.
General Terms
Cancer, Data Mining, Clustering, Classification
Keywords
Decision Tree, k-means, Prediction, Prognosis, Risk Levels
1. INTRODUCTION
Cancer is one of the most common diseases in the world that results in majority of death. Cancer is caused by uncontrolled growth of cells in any of the tissues or parts of the body. Cancer may occur in any part of the body and may spread to several other parts. Only early detection of cancer at the benign stage and prevention from spreading to other parts in malignant stage could save a person’s life. There are several factors that could affect a person’s predisposition for cancer. Education is an important indicator of socioeconomic status through its association with occupation and life-style factors. A number of studies in developed countries have shown that cancer incidence varies between people with different levels of education. A high incidence of breast cancer has been found among those with high levels of education whereas an inverse association has been found for the incidence of cancers of the stomach, lung and uterine cervix. Such differences in cancer risks associated with education also reflect in the differences in life-style factors and exposure to both environmental and work related carcinogens. This study describes the association between cancer incidence pattern and risk levels of various factors by devising a risk prediction system for different types of cancer which helps in prognosis.
Data mining technique involves the use of sophisticated data analysis tools to discover previously unknown, valid patterns and relationships in large data set. These tools can include statistical models, mathematical algorithm and machine learning methods in early detection of cancer. In classification learning, the learning scheme is presented with a set of classified examples from which it is expected to learn a way of classifying unseen examples. In association learning, any association among features is sought, not just ones that predict a particular class value. In clustering, groups of examples that belong together are sought. In numeric prediction, the outcome to be predicted is not a discrete class but a numeric quantity. In this study, to classify the data and to mine frequent patterns in data set Decision Tree algorithm is used. A decision tree is a flow chart like tree structure, where each internal node denotes a test on an attribute, each branch represents an outcome of the test and each leaf node holds a class label. The top most node is the root node. The attribute value of the data is tested against a decision tree. A path is traced from root to leaf node, which holds the class prediction for that data. Decision trees can be easily converted into classification rules. This decision tree is used to generate frequent patterns in the dataset. The data and item sets that occur frequently in the data base are known as frequent patterns. The frequent patterns that is most significantly related to specific cancer types and are helpful in predicting the cancer and its type is known as Significant frequent pattern. Using this significant patterns generated by decision tree the data set is clustered accordingly and risk scores are given.
2. PROPOSED MODEL
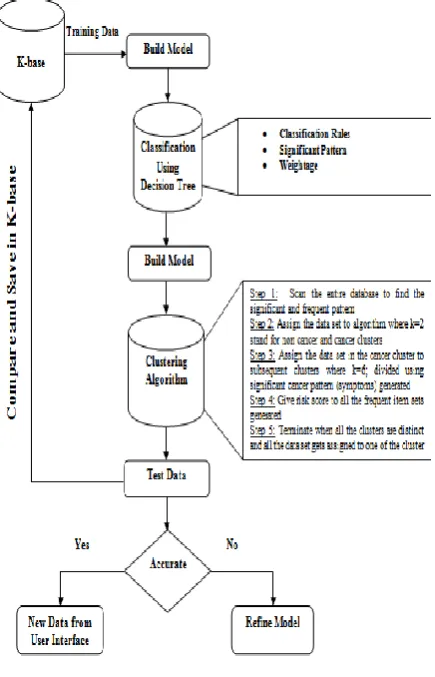
[image:2.595.59.277.222.561.2]The following is the model of the proposed work. The collected data is pre-processed and stored in the knowledge base to build the model. Seventy five percent of the entire data is taken as training set to build the classification and clustering model the remaining of which is taken for testing purpose. The decision tree model is build using the classification rules, the significant frequent pattern and its corresponding weightage. The clustering model is build using the k-means clustering algorithm. The model is then tested for accuracy, sensitivity and specificity using test data along with merging it to the knowledge base. Finally the model is evaluated using Support Vector Machine.
Fig 1: Proposed Work
3. REVIEW OF LITERATURE
Ada et al [1] made an attempt to detect the lung tumours from the cancer images and supportive tool is developed to check the normal and abnormal lungs and to predict survival rate and years of an abnormal patient so that cancer patients lives can be saved.
V.Krishnaiah et al [2] developed a prototype lung cancer disease prediction system using data mining classification techniques. The most effective model to predict patients with Lung cancer disease appears to be Naïve Bayes followed by IF-THEN rule, Decision Trees and Neural Network. For Diagnosis of Lung Cancer Disease Naïve Bayes observes better results and fared better than Decision Trees.
Charles Edeki et al [3] Suggests that none of the data mining and statistical learning algorithms applied to breast cancer
dataset outperformed the others in such way that it could be declared the optimal algorithm and none of the algorithm performed poorly as to be eliminated from future prediction model in breast cancer survivability tasks.
Sahar A. Mokhtar et al [4] have analyzed three different classification models for the prediction of the severity of breast masses namely the decision tree, artificial neural network and support vector machine. The decision tree model is constructed using the Chi-squared automatic interaction detection method and pruning method was used to find the optimal structure of artificial neural network model and finally, support vector machine have been built using polynomial kernel. The performances of the three models have been evaluated using statistical measures, gain and Roc charts. Support vector machine model outperformed the other two models on the prediction of the severity of breast masses.
Rajashree Dash et al [5] a hybridized K-means algorithm has been proposed which combines the steps of dimensionality reduction through PCA, a novel initialization approach of cluster centers and the steps of assigning data points to appropriate clusters. Using the proposed algorithm a given data set was partitioned in to k clusters. The experimental results show that the proposed algorithm provides better efficiency and accuracy comparison to original k-means algorithm with reduced time. Limitations are the number of clusters (k) is required to be given as input. The method to find the initial centroids may not be reliable for very large dataset.
Ritu Chauhan et al [6] focuses on clustering algorithm such as HAC and K-Means in which, HAC is applied on K-means to determine the number of clusters. The quality of cluster is improved, if HAC is applied on K-means.
Dechang Chen et al [7] algorithm EACCD developed which a two step clustering method. In the first step, a dissimilarity measure is learnt by using PAM, and in the second step, the learnt dissimilarity is used with a hierarchical clustering algorithm to obtain clusters of patients. These clusters of patients form a basis of a prognostic system.
S M Halawani et al [8] suggests that probabilistic clustering algorithms performed well than hierarchical clustering algorithms in which almost all data points were clustered into one cluster, may be due to inappropriate choice of distance measure.
Zakaria Suliman zubi et al [9] used some data mining techniques such as neural networks for detection and classification of lung cancers in X-ray chest films to classify problems aiming at identifying the characteristics that indicate the group to which each case belongs.
Labeed K Abdulgafoor et al [10] wavelet transformation and K- means clustering algorithm have been used for intensity based segmentation.
4. MATERIAL AND METHODS
Extensive literature reviews, case studies and discussions with medical experts show that there are number of factors influencing cancer. These factors are identified and taken as attributes for this study.
4.1 Data Source
This data consists of more than 30 attributes such as Age, Marital status, Symptoms relating to cancer, occupational hazards, family history of cancer etc. These attributes are used to train and develop the system and a part is used to test the significance of the system. These attributes play an important role in diagnosing cancer in all the cases. This data is stored in a knowledge base which has the ability to expand itself as new data enters the system through front end from which new knowledge is gained and thus the system becomes intelligent.
4.2. Classification and Significant Pattern
Generation
Decision tree algorithm is used to mine frequent patterns from the data set. The frequent item sets that occur throughout the data base and have a significant link to cancer status are mined as significant patterns. The data is fed into the decision tree algorithm to obtain the significant patterns related to cancer and non cancer data sets. In other words the patterns that are mined by the decision tree are well defined and distinguished to be separated as cancer and non cancer datasets. The following pseudo code is used to generate frequent pattern using decision tree.
A set of candidate attributes II, and S, a set of labelled instances is given as input. The algorithm to generate a decision Tree T is as follows
Begin 1) If (S is pure or empty) or (II is empty) Return T. 2) Compute Ps (Ci) on S for each class Ci. 3) For each attribute X in II, compute IIG(S, X) based on equation 1 and 5. 4) Use the attribute Xmax with the highest IIG for the root. 5) Partition S into disjoint subsets Sx using Xmax. 6) For all values x of Xmax •Tx=NT (II-Xmax, Sx), •Add Tx as a child of Xmax. 7) Return T End.
4.2.1 Significant Pattern mined using Decision tree algorithm
1. Age - gender - living area - family history- anemia- symptoms -> none- Cancer Type -> None. Weightage = 100.55
2. Age - gender- marital status-education-smoking-diet-symptoms-> Pain in chest, back, shoulder or arm->Shortness of breath and hoarseness-Cancer Type->Lung Weightage = 200.50
3. Gender-Education-Occupational hazards- Alcohol-Family history- Weight loss- symptoms-> severe abdominal pain or bloating> abdominal pain with blood in stool Cancer Type ->Stomach Weightage = 180.05
4. Age- gender- no of children- occupational hazards- Family history- relationship with cancer patient- symptoms-> swelling or mass in armpit -> discharge or pain in nipple -> Cancer Type -> Breast. Weightage = 170.55
5. Gender- education- living area- Smoking- Hot beverage- Diet- fast food addiction- Earlier cancer diagnosis- symptoms-> Ulcers in mouth or pain of teeth and jaw-symptoms-> White or red patches in tongue, gums- Cancer Type -> Oral. Weightage = 190.50
Numerical values are given as risk scores to the attributes that have a direct link to the significant patterns mined.
4.2.2. Weightage for Significant Pattern
The weightage is calculated for every frequent pattern based on the attributes to analyze its impact on the
output. The frequent patterns mined which satisfies the below condition are taken as significant Frequent Pattern.
Sw(i)= Σ(Wi*Fi)
(1).Where Wi is the weightage of each attribute and Fi represents number of frequency for each rule. And significant Frequent Pattern is selected by using the following Equation (2) SFP=Sw (n) ≥φ for all values of n (2). Where SFP denotes significant frequent pattern and φ denotes significant weightage.
Table1. Risk scores for the attributes that represent the significant patterns.
Attributes Values Risk score
Age
x<30 30 < x < 40 40< x < 60
3 4 5
Education
Uneducated School College
5 3 2
Living Area Urban Rural
5 3
Habits
Smoking Alcohol Chewing Hot beverage
3 5 3 2
Occupational Hazards
Radiation Exposure Chemical Exposure Sunlight Exposure Thermal Exposure
3 3 2 2
Anemia Yes
No
3 1
Weight Loss Yes No
2 1
Family History of Cancer
Yes No
5 1
4.2.3. Rules for Decision Tree
If symptoms = none and risk score = x <45 then result = you don’t have cancer, tests = do simple clinical tests to confirm. If symptoms = none and risk score = 45 < x < 60 then result = you may have cancer, tests = do blood test and x ray to confirm
Else if symptom= related to stomach and risk score = x > 45 then result = you have cancer, cancer type = stomach, tests = endoscopy of stomach
If symptom= related to breast and shoulder and risk score =x > 45 then result = you have cancer, cancer type = breast, tests= mammogram and PET scan of breast
If symptom= related to chest and shoulder and risk score =x > 40 then result = you have cancer, cancer type = lung, tests = take CT scan of chest.
If symptom= related to pelvis and lower hip and risk score= x >55 then result = you have cancer, cancer type = cervix, tests = do pap smear test
Else symptom= other symptoms and risk score =x > 40 then result = you have cancer, cancer type = leukemia, tests = biopsy of bone marrow
[image:4.595.55.285.157.288.2]Based on the above mentioned rules and the calculated risk scores the severity of cancer is known as well as some tests were prescribed to confirm the presence of cancer.
Fig 2: Decision Tree
4.3 Clustering using
k-
means
The instances are now clustered into a number of classes where each class is identified by a unique feature based on the significant patterns mined by the decision tree algorithm. The aim of clustering is that the data object is assigned to unknown classes that has a unique feature and hence maximize the intraclass similarity and minimize the interclass similarity. The weightage scores of the significant patterns mined are fed into K- means clustering algorithm to cluster and divide it into cancer and non cancer groups. The cancer group is further subdivided into six groups with each cluster representing a type of cancer. At the beginning the data is assigned to a non cancer cluster and then based on the intensity of the cancer given by its weightage it is either moved to the cancer cluster or gets retained in the non cancer cluster, further the data object is moved between the subgroups of the hierarchical cancer cluster based on the symptoms the data object contains. To calculate the mean of the cluster center the symptoms are given certain values the average of which represents each distinguished cluster. The data objects are distributed to the cluster based on the cluster center to which it is nearest.
It also searches the entire database to find a match to a single input data. The data is moved to that particular cluster if and only if an exact match is found. This technique minimizes the error rate of clustering. The data in the first cluster are all similar with little or no symptoms; no risk factors associated with cancer and low risk scores. Hence the cluster is labeled as Non cancer cluster. The top cluster of the second hierarchical cluster contains all the data that has high risk factors associated with cancer along with distinguished symptoms and high risk scores. The data in the cluster is again fed into k – means clustering algorithm to further subdivide it. The resulting six clusters are separated based on particular symptoms associated with any one type of cancer i.e. lung, cervix, breast, stomach, oral and leukemia. Finally all the data is partitioned into two types of clusters and six sub clusters of the cancer cluster.
4.3.1. Clustering Algorithm
Algorithm: The k-means clustering algorithm is used for partitioning the data into cancer and non cancer clusters, where the initial cluster centers is represented by the mean value of the weightage of significant patterns.
Input: k: the number of clusters. D: data set containing n objects.
Output: A set of hierarchical clusters
Begin 1) choose two mean values from weightage of significant patterns as the initial cluster centers; 2) assign each object to the cluster to which it is most similar based on the mean value of the weightage. 3) Update the cluster means by calculating mean value of all the objects in the cluster. 4) End
Now two clusters have been generated based on the weightage scores of the significant pattern. The two clusters are named as Non cancer and Cancer clusters. The mean weightage of the non cancer cluster is significantly lower than the cancer cluster. Again partition the cancer cluster to generate six sub clusters each representing a type of cancer.
Begin 1) arbitrarily chooses k objects from cancer cluster S with distinguished values for its symptoms. 2) Assign each object in S to the cluster whose mean value is closer to its symptom. 3) Update the cluster means and 4) Repeat step 2 and 3 until no change 5) End.
The output is six clusters with each representing a type of cancer.
5. EXPERIMENTAL RESULTS
The results are separated into three parts. The first is the frequent and significant pattern discovery. The second is mapping the cancer to its cluster and the third is prediction by giving risk score as output. At the beginning all the input data is stored in the non cancer cluster further it gets classified and clustered by the model. A single user input data is fed into the system and gets classified according to the significant pattern to which it matches through decision tree, gets analyzed for its risk score merged with either one of the Non cancer and cancer clusters. This gives the result whether the patient has cancer or not. Again the data is merged with any one of the subsequent cancer clusters to which its symptoms belong. The type of cancer the patient has is found out from this step. It is also compared with the entire database to find its exact or relevant match so that a data with severe cancer related symptoms gets a pair only in the cancer cluster and it cannot get merged with non cancer cluster even by mistake. With each new entry getting appended to the model the process becomes intelligent and ensures accurate results. This step ensures the accuracy of the model. The front end user interface is designed in a user friendly manner to help people use the system without any hassles.
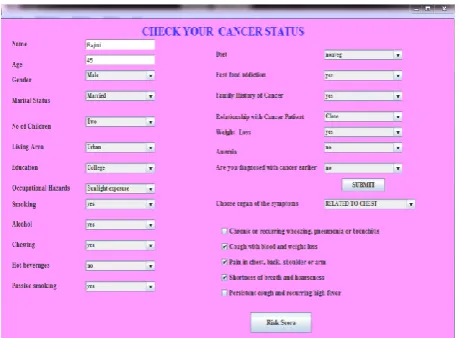
[image:4.595.315.545.571.740.2]Fig 4: Report Screen with Prediction Results
The report shows the cancer status of a patient whether or not he has cancer by matching his data with the entire database, his risk score generated by the significant pattern mined by decision tree, the type of cancer he has which is given as a cluster output, whether his risk status is medium or severe and finally some recommended tests by medical experts to confirm the presence of cancer. This application is directly linked with the knowledge base and the back end model so that it could send the new raw data to the storage unit as well as the model to process it through analyzing the risk scores and also compares the data with existing cases in the knowledge base.
The following figure shows the symptoms chosen by the patient and to which cluster his chose symptoms belong thereby predicting the type of cancer he has.
Fig 5: The cluster output showing the cluster to which the symptoms belong.
6. EVALUATION AND PERFOMANCE
ANALYSIS
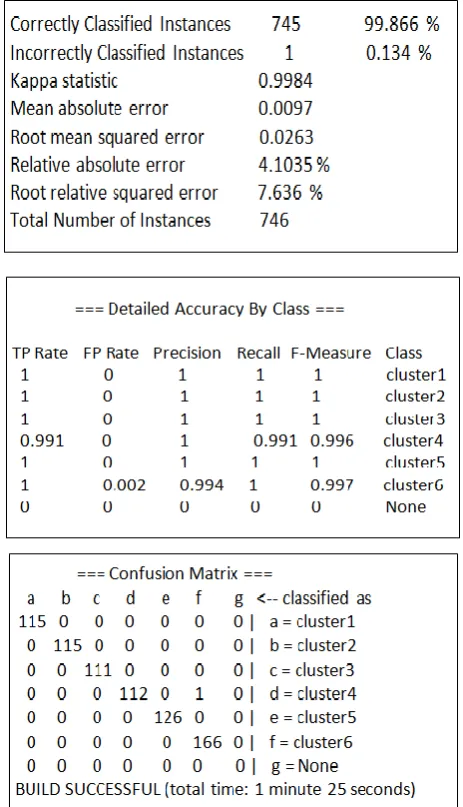
The model is evaluated using Support Vector machine to analyze its accuracy rate. The performance of model is evaluated using three statistical measures accuracy, sensitivity and specificity. The correctly and incorrectly classified instances show the percentage of test instances. The percentage of correctly classified instances is called accuracy. Kappa is a chance-corrected measure of agreement between the classifications and the true classes. Kappa statistics should be maximum for a good model, which shows the model exactly classifies the test instances as true classes. The mean absolute error gives the error percentage of the model. Root means squared error, Relative absolute error, Root relative squared error is used to assess performance. Root relative squared error is computed by dividing the Root mean squared error by predicting the mean of the target values. The
following results show the performance evaluation of this model.
Confusion matrix is a matrix representation of the classification results. Each matrix element shows the number of test examples for which the actual class is row and the predicted class is the column. The leading diagonal corresponds to the correctly classified instances. Cluster 1, 2, 3, 4, 5 and 6 represents breast cancer, cervical cancer, leukemia or blood cancer, lung cancer, oral cancer and stomach cancer respectively. The total time taken required to build the model is 1 minute and 25 seconds.
[image:5.595.316.548.103.507.2]In future, a Data Warehouse System in health and service sector specific to cancer disease is proposed to be built which could be used by doctors and medical analysts as a Decision Support System (DSS).
8. ACKNOWLEDGEMENT
The authors would like to thank Ms. S. M. Adebaa., Directorate of Technical Education, Chennai, for rendering her support. They also wish to thank Dr.R.Swaminathan; Head of the Department & P.Shanthi, Senior Investigator Department of Biostatistics & Cancer Registries, Adyar cancer institute (WIA) Chennai, for providing valuable suggestions in this research work. They also extend their gratitude to the department staff members.
9. REFERENCES
[1] Ada and Rajneet Kaur “Using Some Data Mining Techniques to Predict the Survival Year of Lung Cancer Patient” International Journal of Computer Science and Mobile Computing, IJCSMC, Vol. 2, Issue. 4, April 2013, pg.1 – 6, ISSN 2320–088X
[2] V.Krishnaiah “Diagnosis of Lung Cancer Prediction System Using Data Mining Classification Techniques” International Journal of Computer Science and Information Technologies, Vol. 4 (1) 2013, 39 – 45 www.ijcsit.Com ISSN: 0975-9646.
[3] Charles Edeki “Comparative Study of Data Mining and Statistical Learning Techniques for Prediction of Cancer Survivability” Mediterranean journal of Social Sciences Vol 3 (14) November 2012, ISSN: 2039-9340.
[4] A. Sahar “Predicting the Serverity of Breast Masses with Data Mining Methods” International Journal of Computer Science Issues, Vol. 10, Issues 2, No 2, March 2013 ISSN (Print):1694-0814| ISSN (Online):1694-0784 www.IJCSI.org
[5] Rajashree Dash “A hybridized K-means clustering approach for high dimensional dataset” International Journal of Engineering, Science and Technology Vol. 2, No. 2, 2010, pp. 59-66
[6] Ritu Chauhan “Data clustering method for Discovering clusters in spatial cancer databases” International Journal of Computer Applications (0975-8887) Volume 10-No.6, November 2010.
[7] Dechang Chen “Developing Prognostic Systems of Cancer Patients by Ensemble Clustering” Hindawi publishing corporation, Journal of Biomedicine and Biotechnology Volume 2009, Article Id 632786.
[8] S M Halawani “A study of digital mammograms by using clustering algorithms” Journal of Scientific & Industrial Research Vol. 71, September 2012, pp. 594-600.
[9] Zakaria Suliman zubi “Improves Treatment Programs of Lung Cancer using Data Mining Techniques” Journal of Software Engineering and Applications, February 2014, 7, 69-77
[10] Labeed K Abdulgafoor “Detection of Brain Tumor using Modified K-Means Algorithm and SVM” International Journal of Computer Applications (0975 – 8887) National Conference on Recent Trends in Computer Applications NCRTCA 2013
[11] Alaa. M. Elsayad “Diagnosis of Breast Cancer using Decision Tree Models and SVM” International Journal of Computer Applications (0975 – 8887) Volume 83 – No 5, December 2013
[12] Neelamadhab Padhy “The Survey of Data Mining Applications and Feature Scope” Asian Journal of Computer Science and Information Technology 2:4(2012) 68-77 ISSN 2249-5126
[13] S. Santhosh Kumar “Development of an Efficient Clustering Technique for Colon Dataset” International Journal of Engineering and Innovative Technology” Volume 1, Issue 5, May 2012 ISSN: 2277-3754
[14] Rafaqat Alam Khan “Classification and Regression Analysis of the Prognostic Breast Cancer using Generation Optimizing Algorithms” International Journal of Computer Applications (0975-8887) Volume 68- No.25, April 2013
[15] K.Kalaivani “Childhood Cancer-a Hospital based study using Decision Tree Techniques” Journal of Computer Science 7(12): 1819-1823, 2011 ISSN: 1549-3636
[16] Boris Milovic “Prediction and Decision Making in Health Care using Data Mining” International Journal of Public Health Science Vol. 1, No. 2, December 2012, pp. 69-78 ISSN: 2252-8806
[17] T.Revathi “A Survey on Data Mining Using Clustering Techniques” International Journal of Scientific & Engineering Research Http://Www.Ijser.Org, Volume 4, Issue 1, January-2013, Issn 2229-5518
[18] Shomona Gracia Jacob “Data Mining in Clinical Data Sets: A. Review” International Journals of Applied Information System (IJAIS) - ISSN: 2249-0868 Foundation of Computer Science FCS, New York, USA, Volume 4-No.6, December 2012-www.ijais.org
[19] G. Rajkumar “ Intelligent Pattern Mining and Data Clustering for Pattern Cluster Analysis using Cancer Data” International journal of Engineering Science and Technology Vol. 2(12), 2010, ISSN: 7459-7469.
[20] M. Durairaj “Data Mining Applications in Healthcare Sector: A Study” International journal of Scientific & Technology Research, Volume 2, Issue 10, October 2013, ISSN: 2277-8616
[21] Vikas Chaurasia “Data Mining Techniques: To Predict and Resolve Breast Cancer Survivability” International journal of Computer Science and Mobile Computing (IJCSMC), Vol.3, Issue. 1, January 2014, pg.10-22, ISSN: 2320-088X
[22] T.Sridevi “An Intelligent Classifier for Breast Cancer Diagnosis based on K-Means Clustering and Rough Set” International Journal of Computer Applications (0975 – 8887) Volume 85 – No 11, January 2014
[23] Reeti Yadav “Chemotheraphy Prediction of Cancer Patient by Using Data Mining Techniques” International Journal of Computer Applications (0975-8887), Volume 76-No.10, August 2013