Mathematical Analysis of Mobile Latitude Software on
Location Tracking
Shaveta Bhatia
Research Scholar,Manav Rachna International University
Faridabad,Haryana,India
Saba Hilal,
PhD.Director, Fausta and Research pvt ltd Faridabad, Haryana, India
ABSTRACT
Location accuracy problem is addressed in Location Based Tracking using mobiles. Location accuracy is a fundamental task because user needs accurate Location to track a child, a friend or culprit etc.The Mathematical Analysis is done in the paper on Location Tracking by mobile phone. A Person is tracked through Latitude Software of a Mobile. The distance of s person (Predicted distance) from different locations is determined through same software on a Mobile. Actual distances are also noted for same locations. By applying various mathematical Algorithms, the study calculates the error and accuracy level of the position of a person through Mobile. The study compares the results of different algorithms and calculates the correlation between distances that leads to conclusions and key issues for further work
.
Keywords
Google Latitude, GPS,Location Tracking, Root mean Square, Least Square Method, Correlation, Regression.
1.
INTRODUCTION
To determine the position of Mobile user accurately is very necessary. If a person wants to know the Location of a child, it is useful when it is accurate. Location Based Applications are becoming popular day by day and provide the user with lot of information based on their location and position [7]. Most popular methods to locate people are based on measurements of Angle of arrival, Time difference of Arrival [9]. The other methods are Trilateration and Multilateration [10].In this Paper, Latitude Software [12] on Mobile is adopted for Track a Location of a Person. The Software uses Global Positioning System [15] as a tool to track a person. The distances of a located person from 17 different Locations are taken into consideration through Idea Alcatel one Touch 918N Mobile. In Latitude Software, the Haversine formula [8] is used to calculate the distance between two Locations”.
Haversine Formula for calculating distance [16]
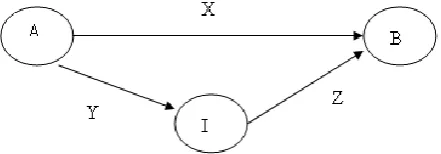
[image:1.595.306.527.317.394.2]The distances determined through this software is not always correct. The study determines the actual distance of different Locations. There are two cases considered regarding actual distance. Case 1: If there is error only in predicted distance (through Latitude).Case 2: There is error in both predicted distance and actual distance. Because while calculating the actual distance, there are different paths to reach a Location as shown in Figure 1.
Fig 1: Showing two paths from Location A to
Location B
Starting from Location A to reach Locatin B,there are two paths A->B and A->I->B.The distance calculated by two paths are different. Therefore, presence of error in actual distance is also considered in the paper. Error percentage of location can be determined by different Mathematical algorithms. The Results are then compared and summarized.
2.
RELATED WORK
Jose Mario Cabero et al proposed two efficient and numerically stable tracking algorithms to infer individual’s trajectories [1]. The algorithm is designed for those networks where distances between the neighbors are available. These algorithms are basically successful for Adhoc networks for real time tracking. This algorithm does not need the communication between the nodes. It saves energy and network bandwidth. The accuracy of these algorithms increases when increases number of nodes; it decreases if number of nodes decreases.
contains idea that the tracker sends its driving requests to various nodes but the method is not accurate.
C.Vinothkumar et al proposed 3D Location tracking algorithm that can be used to gradually locate towards the exact Location of target object and enhancing management [4].It is used for Wireless Sensor Technology for accurate Location tracking information of objects. This method was implemented for real time container tracking system in shipment area.
Silky Feldomann et al proposed Bluetooth based positioning system based on Radio Signal Strength and associated distance between sender and receiver [5].The system is based on Triangulation method. The position estimation is calculated using LSE (Least square estimation) followed by RSSI measurement to distance for Sensor Networks.
Farinaz Koushanfar et al developed an atomic trilateration procedure for calculating the position of node in presence of measurement errors [6].It includes the Location discovery procedure using relative position of nodes. The goal of procedure is to locate each and every node such that discrepancy between measurements and distance according to announced Location is minimized.
Xin Wang et al proposed Non line of sight propagation Algorithm where measurements of Location are taken from Time of arrival and Time difference of Arrival [11].Here Localization is done in 2D plane where position of source is calculated at Location Center using Location Algorithms.
YunZhou Zang et al analyses the process of Centroid Algorithm, Trilateration Algorithm and Maximum Likelihood Estimation [13].The authors compared various algorithms to further improve Localization
.
Sarana Nutanong et al proposed Hausdroff distance Calculation Algorithm to compute Max-Min distance from X to Y [14].This Algorithm is used to measure the distance between Trajectories and used to search similar Trajectories. For searching Trajectory the algorithm is at Marginal.
3.
MATHEMATICAL ALGORITHMS
The Study locates the person through Latitude Software on Idea Alcatel one touch 918N Mobile. The distances of located person to different locations are determined. Various Mathematical Algorithms applied on data collected using the Software.
3.1 Root Mean Square Algorithm
The Algorithm is used to calculate the mean error of position of Located Person.
[image:2.595.319.549.70.260.2]A Person tracked is denoted by H The distance of H from other 17 Locations (A to Q) are determined through Latitude Software denoted by Y. The Calculated actual distance is denoted by X. The data Collected is shown in Table no. 1.
Table 1. Data of 17 Locations collected through Idea Alcatel one Touch 918N Mobile phone
The mean error of Position of Person is calculated using Formula
The Calculated Mean error =13.4
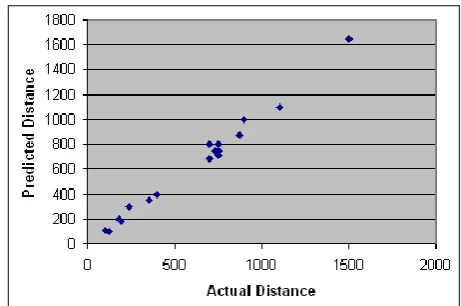
Fig 2: Graph showing the relation between Actual and Predicted Distance determined through Idea Alcatel one
touch 918 Mobile phone.
The above Graph does not contain Straight line. It shows there is an error in predicted distance calculated through latitude on mobile phone.
Error percentage=3.9
3.2 Least Square Method to Fit Straight Line
Algorithms (Error only in predicted distance)
[image:2.595.318.549.424.577.2]Table 2: Data of 9 Locations with collected through Idea Alcatel one Touch 918N Mobile phone
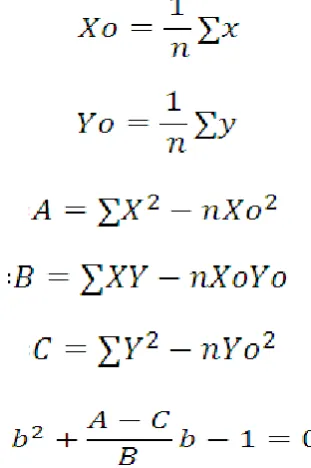
The Straight Line is calculated using
The derived Staright Line equation is:-
Based on above equation, a straight line graph is shown in figure 3.Through this figure, any number of Y values can be determined for X values.
Fig 3: A Straight line graph based on equation y=3.4+1.03x
[image:3.595.303.556.175.339.2]The new values of Y for x values are shown in Table 3.
Table 3. New values of Y using equation Y=3.4+1.03X
The Graph for the new values of Y are shown in Figure 4.Any number of X values can be plot to determine the values of Y for error estimation
.
Fig 4: Graph showing the relation between Actual and Predicted distance determined through new values from
equation Y=3.4+1.03X
The above Graph shows that the error percentage using new points is reduced.
3.3 Least Square method to fit Straight Line
Algorithm (Error both in predicted and
actual distance)
[image:3.595.54.284.461.645.2] [image:3.595.341.497.503.737.2]The derived Equation is
[image:4.595.303.544.70.231.2]Based on above equation, a straight line graph is shown in figure 5.Through this figure, any number of Y values can be determined for X values
Fig 5: A Straight line graph based on equation y=3.6+1.03x
The new values of Y using X values are shown on Table no. 4
Table 4. New values of Y using equation Y=3.6+1.03X
[image:4.595.54.287.257.453.2]The Graph for the new values of Y are shown in Figure 6.Any number of X values can be plot to determine the values of Y for error estimation
Fig 6: Graph showing the relation between Actual and Predicted distance determined through new values from
equation Y=3.6+1.03X
The above Graph shows that the error percentage using new points is reduced.
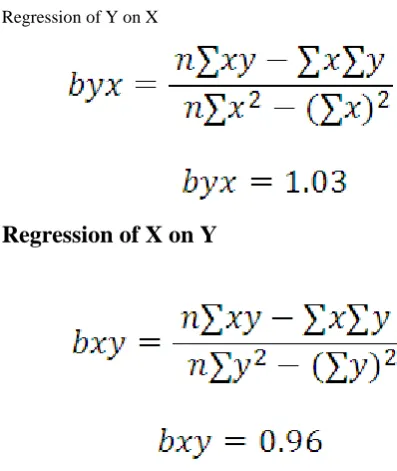
3.4 Correlation and Regression Algorithms
This Algorithm indicates whether Statistical relationship exists between the variables X and Y.
The Formulas used are:- Regression of Y on X
Regression of X on Y
If value is close to 1, there is high degree of positive correlation.
4.
SIMULATION AND RESULT
ANALYSIS
[image:4.595.303.502.380.616.2]1. Calculate the distance of Located Person to 17 different Locations.
2. Calculate mean error and error percentage for 17 Locations.
3. Apply Least Square method to fit straight line to generate two straight lines with prediction of error in X and error in both X and Y.Check for change in error percentage.
4. Find Regression of X and Y on X to calculate relation between X and Y.If value is <1 and nearby 1, the Correlation is positive.
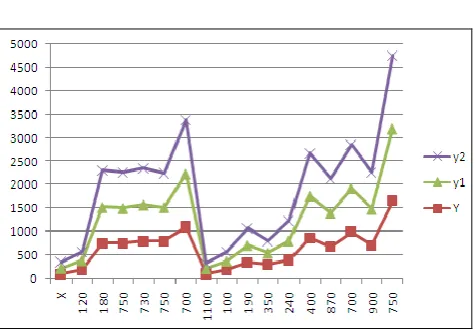
[image:5.595.55.293.254.419.2]5.
The graph shown in figure 7 show the error estimation using three values of Y using three different algorithms defined above.Fig 7: Comparison of different points of Y w.r.t X
The above Graph shows that the error estimation of three values of Y using three different Algorithms.
5.
CONCLUSION
The Various Mathematical Methods used in the above Text show that the mean error calculated from the data collected through Latitude Software is 12.6.This comparison of different algorithms using actual and expected distance is shown on graph. The results shows that Coefficient of Correlation between values of X and Y is positive. Therefore Latitude Software for finding the position of Person is Satisfactory.The aim in our next study shall be to develop an algorithm to improve Location accuracy with decreased mean error.
6.
REFERENCES
[1] Jose Maria Cabero et al,”Tracking Algorithms based on dynamics of individuals and Multidimensional Scaling”, IEEE, Feb 1, 2000.
[2] Mehak Khurana et al,”An improvement of Centroid Algorithm based on distance in Wireless Sensor Network”, International Journal of Smart Sensors and Ad-Hoc Networks,Vol 1,issue 1,2011.
[3] R.Craig Coulter et al,” Implementation of the pure Pursuit Path Tracking Algorithm”, CMU-RI-TR-92-01, Robotics Institute, January 1992
.
[4] C.Vinothkumar et al,”WSN based Three dimensional Location Tracking Algorithm”, International Conference on Computing and Control Engineering, 12 April, 2012. [5] Silky Feldmann et al,”An indoor Bluetooth based
positioning system: concept, implementation and experimental evaluation”, ICWN'03, Las Vegas, USA, 2003. [6] Farinaz Koushanfar et al,”Global Error-Tolerant Algorithms for location Discovery in Wireless Adhoc Networks”, International Conference on Acoutics, speech and signal processing, California, 13-17 May, 2002.
[7] Anthony Clarkson et al,” Hybrid Positioning Algorithms in location based Services”, Proceedings of the Ist workshop on positioning, navigation and communication (WPNC’04).
[8] Wikipedia,”Haversine Formula”, available on http://en.wikipedia.org/wiki/Haversine_formula retrieved on 10 Jan, 2013.
[9] Nissanka B. Priyantha,” The Cricket Location-Support System”, 6th ACM International Conference on Mobile Computing and Networking (ACM MOBICOM), August 2000.
[10]K.Whitehouse,”The effects of ranging noise on multihop localization: an empirical study” in ISPN’05: Proceedings of 4th international symposium on information processing in Sensor Networks, USA: IEEE press, 2005, pp 10.
[11]Xin Wang et al,”A TOA based Location Algorithm Reducing the errors due to Non-Line-of-Sight (NLOS) propagation” IEEE Transactions on Vehicular Technology, Vol 52, No.1, January 2003.
[12]Wikipedia,” Google latitude available at, http://en.wikipedia.org/wiki/google_latitude,retrieved on 24 January, 2013.
[13]Yunzu et al,”Research of Localization and Tracking Algorithms based on Wireless Sensor Networks”, Journal of Informational and Computational Science,Vol8,issue 4,2011,pp 708-715.
[14]Sarana Nutanong et al,”An incremental Hausdorff Distance Calculation Algorithm”, Proceedings of the VLDB Endowment, Vol4, No.8, 2011.
[15]Wikipedia,”Global Positioning System”, available at http://en.wikipedia.org/wiki/Global_Positioning_System,retr eived on 17 January, 2013.