A Grey Level Fitting Mechanism based on Gompertz
Function for Two Phase Flow Imaging using Electrical
Capacitance Tomography Measurement Systems
Josiah Nombo
Department of Electronics and Telecommunication Engineering, Nelson Mandela African Institutionof Science and Technology, Arusha, Tanzania
Alfred Mwambela
Department of Electronics and Telecommunication Engineering, University of Dar es Salaam, Dares Salaam, Tanzania
Michael Kisangiri
Department of Electronics and Telecommunication Engineering, Nelson Mandela African Institutionof Science and Technology, Arusha, Tanzania
ABSTRACT
Electrical Capacitance Tomography (ECT) is an image generating system based on soft field sensory system. The preferred Linear Back Projection (LPB) reconstruction algorithm for multi-phase measurement has blurring effect on the image generated. These two inherent factors, among others, affect the quality of image generated from ECT systems. Introducing fitting in the image generation process is one the solutions to improving its quality. In this article an alternative fitting mechanism based on the Gompertz function has been developed and evaluated. Comparative analysis results shows improvement on the spatial quality of images generated, in terms of minimum relative image and distribution errors, maximum correlation coefficient, and at relatively no additional computational cost. The mechanism is more effective for annular than stratified flow data hence complimenting the weakness of Xie method for annular flow.
General Terms
Industrial Process Tomography, Image Reconstruction Algorithms.
Keywords
Electrical Capacitance Tomography, Image Reconstruction, Linear Back Projection, Image Fitting, Gompertz function.
1
INTRODUCTION
Electrical Capacitance Tomography (ECT) is an innovative imaging technique for visualizing the internal behavior of industrial processes whereby physical parameters of the monitored process are acquired using sensors and then presented in a computer as an image for further analysis.
The ECT is mostly suitable for process involving a mixture of insulating compounds with different permittivity [1]. It can be used to image component concentration distribution and
detect transient dynamic changes of multiphase process. A number of applications have used the ECT measurement technique [2–4]. The first application, which the ECT was used for, is two and three phase imaging of gas-oil-water flows as applied in the oil industry [5,6].
The most popular image reconstruction algorithm is called the Linear Back Projection (LBP) [7]. It is simple and fast, but it produce images of poor quality due to some of its inherent limitations. To improve quality of image from LBP reconstructing algorithm, fitting of normalized capacitance measurement data is often required. The most common fitting mechanism used is the one proposed by Xie et al, [9], which has been shown to be more effective for stratified than annular flows [7]. However, Gompertz function [21], [24] which has been used in optimization problems offers an alternative mechanism to improving the quality of the image under the discussed circumstances.
This paper presents a new grey level fitting mechanism based on Gompertz function. Experimental results shows that the new fitting method produce better image quality in terms of spatial resolution compared to Xie [7] mechanism, and at no computation cost. The new proposed fitting mechanism is more effective for annular than stratified flow data hence complimenting the weakness of Xie method for annular flow.
2
THE ECT SYSTEM
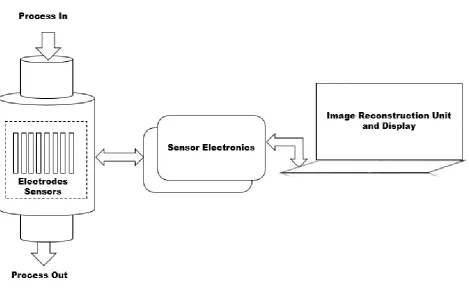
Fig. 1: Block diagram showing main components of the ECT measurement system
The ECT Sensor consists of a set of systematically arranged capacitance electrodes formed by simple metal surrounding the cross-section of the vessel to be imaged, with an earthed screen outside the electrodes to reject external noise. For a sensor with N-measurement electrodes, there are electrode pair and therefore possible independent measurements[9].
ECT system measures the changes of electrical capacitances between all possible combinations of electrodes, which occur when a dielectric material is introduced into the vessel. From these measurements of capacitance change, an image based on the variation of the permittivity of the cross section contents is obtained. ECT Sensor is a soft-field sensor, moreover the number of possible independent measurement is very small compared to the number of required pixel for an acceptable image. These factors make difficult to reconstruct good quality image.
Sensor Electronics or capacitance measurement circuit provide an electronic interface between the ECT sensor and the reconstruction unit, which enable the ECT sensor to interrogate the process. It measures the capacitance between all possible electrode combinations and convert these measurements from the analogue to digital capacitances suitable for further processing and computer control.
The Image Reconstruction Unit is a computer in which reconstruction algorithms are implemented. The main task of reconstruction algorithms is to convert the independent capacitance measurements into an image. Ideally, it involves calculating the value of the permittivity of each pixel from the total number of independent measurements.
3
LINEAR BACK PROJECTION (LBP)
RECONSRUCTION ALGORITHM
In ECT image reconstruction problem, there are two major computational problems: the forward problem and the inverse problem[10–12]. The forward problem is to determine inter-electrode capacitances given the permittivity distribution. This is basically done by solving partial differential equations, governing the sensing domain using Finite Elements Methods (FEM). The inverse problem is to determine the permittivity distribution given the capacitance measurements. The permittivity distributions are usually represented as a visual image, and the process is called image reconstruction. The relationship between capacitance and permittivity distribution is given by:
(1)
Where vector representing normalized capacitance measurements, dielectric constant vector representing grey value information of image reconstruction, the sensitivity distribution matrix reflecting the influence of dielectric constant to capacitance, represent total number of measurements, represent the total number of unknown which represent the total number of pixels.
The task of image reconstruction for ECT is to find unknown from the known using
(2)
Although its reconstruction accuracy is not very good, LBP has the advantage of being quite fast, in practice requiring only multiplication of a fixed reconstruction matrix and the vector of capacitance measurements.
According to [7], the relationship between normalized capacitance and grey level(pixel) is given by
(3)
Where the number of electrodes, is the sensitivity distribution for electrode pair defined by (4) and is the normalized capacitance for electrode pair defined by (5).
(4)
(5)
where is the pixel number, is a correction factor related to the area of the in-pipe element, is the capacitance measured with electrode pair when the area of pixel is full of the higher- permittivity material while the rest of sensor is full of lower- permittivity material, and are capacitances of electrode pair when the sensor is full of high and low- permittivity material, respectively.
4
FITTING MECHANISMS
Because of the smoothing and soft field effects of the LBP algorithm, reconstructed tomograms are distorted. In order to reduce low grey level artifacts on the reconstructed images it is necessary to implement fitting mechanisms, in this section different fitting mechanism used in ECT image reconstruction are outlined, and then the proposed fitting mechanism is presented.
4.1
Simple Fitting Mechanism
Simple fitting mechanism truncates all the grey level values which are less than 0 to 0 and all grey levels values which are greater than 1 to 1 as:
(6)
4.2
Xie Fitting Mechanism
To reduce low grey level artifacts [7] proposed a threshold fitting whereby all values of are truncated to and new grey levels are calculated under the following conditions
(7)
4.3
The Proposed Fitting Mechanism
The proposed solution is to fit the grey levels using Gompertz function [20] presented in (8).
(8)
Gompertz function has been used optimization problems in various areas of applied research such as actuarial science for specifying a mortality law [20], in medicine for tumor growth modeling [21], in biology as a model for describing the
growth of organisms and systems [22], in ecology , in marketing [23].
In order to be applied in grey level fitting equation (8) is modified to equation (9) by setting
(9)
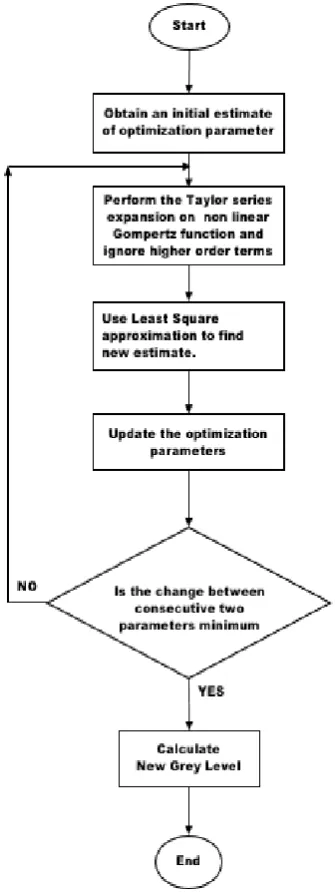
Parameters in (9) have to be estimated from either experimental or empirical data. The common method for estimating parameter is the Least Square method(LSM) [24–26]. When using LSM the sum of the squares of the horizontal and vertical distances between the true permittivity distribution and the calculated permittivity distribution are to be minimized. The non-linear Gompertz function (9) can be linearized as follows
Let (10)
where , and is the total number of pixels. By performing a Taylor series expansion on (10) and ignoring higher order terms (10) can be approximated to
(11)
where represent initial estimation parameters, represent the number of parameters and (0) represent iteration number. Equation (11) can be simplified further by letting,
,
and , so (10) becomes
(12).
In matrix form (12) is given by
(13).
From (13) can be obtained using least square approximation by
(14).
Finally since estimation parameters can be obtained using
(15).
where is between 0 and 1. Equation (15) is an iterative process, the process continues until there is only a minor change in the parameter estimates such that,
(16).
After obtaining the optimization parameters new grey levels are calculated according to
(17)
Fig. 2: Calculation of optimization parameters and new grey levels
5
METHODOLOGY
An evaluation experiments were designed to test the performance of the new proposed fitting algorithm, based on spatial accuracy and computation cost. Spatial accuracy assessment of the processed images was carried out and compared with the reference oil-gas distribution and those images reconstructed by LBP algorithm. Computational cost of the new algorithm was compared to the existed algorithms previously mentioned in the article. Only static stratified and annular flows of oil and gas were used for the exercise.
[image:4.595.75.243.79.526.2]All algorithms used in this work were mainly implemented using MATLAB graphical programming language. Three fitting mechanisms namely; Simple, Xie and the proposed fitting based on Gompertz Optimization function were implemented and evaluated. For discussion purposes the algorithms under considerations are as shown in Table 1.
Table 1: Fitting algorithms used in evaluation process and their associated abbreviations
Abbreviation Long Term
LBPSA LBP with simple fitting LBPXA LBP with Xie fitting
LBPGA LBP with Gompertz function fitting
The following evaluation criteria were used to evaluate the spatial quality of the reconstructed images:
i. Relative Image Error (RIE): Because images are treated as vectors, their norms were used to calculate the relative error [18]. The smaller the percentage RIE the better the quality
(18)
ii. Distribution Error (DE): The average of total sum of the absolute difference in grey level values between the test image and the filtered image [13].
(19)
iii. Correlation Coefficient (CC) between the reference image and the reconstructed image [27]
(20)
The best results from the system should have minimum image error, minimum distribution error, and high correlation coefficient.
6
RESULTS AND DISCUSSION
Qualitative evaluation results based on visual inspections are shown in Fig. 3, where it can be seen that the new algorithm LBPGA outperform other algorithms for both annular and stratified flows.
[image:4.595.310.524.516.603.2]Quantitative evaluation using RIE, DE, and CC are shown in tables 2 – 4 respectively. These results show the superiority of the LBPGA over the others in terms of spatial accuracy or similarity of the generated images to the original distribution.
Table 2: Relative Image Error for the Algorithms Algorithm Relative Image Error (%)
Annular Stratified
LBPSA 43.05 31.08
LBPXA 46.86 29.18
LBPGA 6.97 22.99
Fig 3: Image reconstructed from experimental data Table 3: Distribution Error for the Algorithms Algorithm Distribution Error (%)
Annular Stratified LBPSA 30.57 14.02
LBPXA 29.81 11.14
[image:5.595.110.276.70.346.2]LBPGA 1.12 5.09
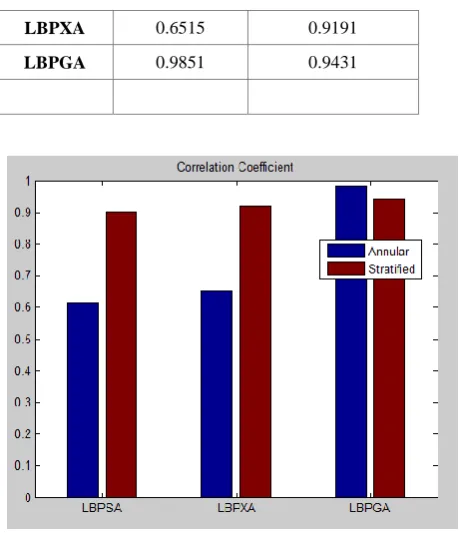
Fig. 4: Distribution Error for the Algorithms Table 4: Correlation Coefficient for the Algorithms Algorithm Correlation Coefficient
Annular Stratified LBPSA 0.6157 0.9022
LBPXA 0.6515 0.9191
LBPGA 0.9851 0.9431
Fig. 5: Correlation Coefficient for the Algorithms
In terms of computational cost, the LBPGA algorithm is relatively computational intensive approximately 10 times more than LBPXA. However, it can be said that this extra time is insignificant for the general system performance. The time taken by LBP reconstruction process is the more dominating aspect of general performance.
7
CONCLUSION
In this paper a new grey level fitting mechanism based on Gompertz function for measurement applications using electrical capacitance tomography systems has been proposed, successfully implemented and evaluated for two-component oil-gas flow imaging. It has been shown that the proposed fitting mechanism outperform other evaluated fitting mechanisms in terms of spatial accuracy and at insignificant additional computational cost. The new algorithm provide more accurate results for annular than stratified flows. Although the proposed mechanism has been used to improve image spatial quality for LBP algorithm but its application is not limited to LBP, it can also be used in other algorithms.
8
ACKNOWLEDGMENTS
The authors wish to thank Nelson Mandela African institution of Science and Technology (NM-AIST) for sponsorship of this work, University of Dar es Salaam (UDSM) for supporting the work to use their ECT system for testing of the algorithms, and Mr. Shamte Kawambwa for his help in the data collection process.
9
REFERENCES
[1] Mwambela A J and Johansen G A 2001 Multiphase flow component volume fraction measurement: experimental evaluation of entropic thresholding methods using an electrical capacitance tomography system Meas. Sci. Technol. 12 1092–101
[image:5.595.51.284.456.679.2][3] PTL 2014 Industries & Applications of Process Tomography
[4] ITS 2014 Applications of Process Tomography
[5] Xie C G, Plaskowski A and Beck M S 1989 8-electrode capacitance system for two-component flow identification. Part 1: Tomographic flow imaging IEE Proc. A (Physical Sci. Meas. Instrumentation, Manag. Educ. 136 173–83
[6] Huang S M, Plaskowski A B, Xie C G and Beck M S 1989 Tomographic imaging of two-component flow using capacitance sensors J. Phys. E. 22 173–7
[7] Xie C G, Huang S M, Beck M S, Hoyle B S, Thorn R, Lenn C and Snowden D 1992 Electrical capacitance tomography for flow imaging: system model for development of image reconstruction algorithms and design of primary sensors IEE Proc. G (Circuits, Devices Syst. 139 89–98
[8] Mwambela A, Isaksen Ø and Johansen G 1997 The use of entropic thresholding methods in reconstruction of capacitance tomography data Chem. Eng. Sci.
[9] Peng L, Ye J, Lu G and Yang W 2012 Evaluation of effect of number of electrodes in ECT sensors on image quality Sensors Journal, IEEE 12 1554–65
[10] Aster R C, Borchers B and Thurber C H 2013 Parameter estimation and inverse problems (Academic Press) [11] Kirsch A 2011 An introduction to the mathematical
theory of inverse problems vol 120 (Springer)
[12] Bilionis I and Zabaras N 2014 Solution of inverse problems with limited forward solver evaluations: a Bayesian perspective Inverse Probl. 30 15004
[13] Isaksen Ø and Nordtvedt J E 1994 An implicit model based reconstruction algorithm for use with a capacitance tomography system Proc. European Concerted Action on Process Tomography, Oporto pp 215–26
[14] Isaksen Ø 1996 A review of reconstruction techniques for capacitance tomography Meas. Sci. Technol. 7 325 [15] Jang J D, Lee S H, Kim K Y and Choi B Y 2006
Modified iterative Landweber method in electrical capacitance tomography Meas. Sci. Technol. 17 1909
[16] Jinchuang Z, Wenli F, Taoshen L and Shi W 2002 An image reconstruction algorithm based on a revised regularization method for electrical capacitance tomography Meas. Sci. Technol. 13 638
[17] Jing L, Liu S, Zhihong L and Meng S 2009 An image reconstruction algorithm based on the extended Tikhonov regularization method for electrical capacitance tomography Measurement 42 368–76 [18] Yang W Q and Peng L 2003 Image reconstruction
algorithms for electrical capacitance tomography Meas. Sci. Technol. 14 R1
[19] Mou C, Peng L, Yao D and Xiao D 2005 Image reconstruction using a genetic algorithm for electrical capacitance tomography Tsinghua Sci. Technol. 10 587– 92
[20] Gompertz B 1825 On the nature of the function expressive of the law of human mortality, and on a new mode of determining the value of life contingencies Philos. Trans. R. Soc. London 513–83
[21] Marusic M and Bajzer Z 1993 Generalized two-parameter equation of growth J. Math. Anal. Appl. 179
446–62
[22] Turner Jr M E, Bradley Jr E L, Kirk K A and Pruitt K M 1976 A theory of growth Math. Biosci. 29 367–73 [23] Franses P H 1994 Fitting a Gompertz curve J. Oper. Res.
Soc. 109–13
[24] Björck A 1996 Numerical methods for least squares problems (Siam)
[25] Demidenko E Z 1989 Optimization and regression Moscow. Publ. House “Nauka”. Main Ed. Phys. Math. Lit. 293
[26] Fletcher R 2013 Practical methods of optimization (John Wiley & Sons)