7024
THE EFFECT OF VIBRATION SOURCE AND TUNED MASS DAMPER
DISTANCE FROM CENTER OF GRAVITY TO THE VIBRATION
RESPONSES OF A 2DOF SYSTEM
Gunturharus Laksana
1, Rohman Abdul
2and Soebagyo Hary
31
Laboratory of Vibration and Dynamics System, Mechanical Engineering Department, Faculty of Industrial Technology, Institute Teknologi Sepuluh Nopember, Surabaya, Indonesia
2
Mechanical Engineering Department, Politeknik Negeri Banyuwangi, Banyuwangi, Indonesia
3
Balai Besar Teknologi Kekuatan Struktur, Badan Pengkajian dan Penerapan Teknologi, Jakarta, Indonesia E-Mail:[email protected]
ABSTRACT
Tuned Mass Damper (TMD) has been studied widely to reduce vibration.This paper discussed the effect of vibration source and TMD distance from the center of gravity (COG) to the vibration responses of a 2DOF main system. The system was mathematically modeled and simulated. The simulation results were verified experimentally and analyzed. The valid model was used to simulate the vibartion responses and vibration reduction of the 2DOF main system due to variation of the vibration source distance and TMD distance from the COG. The best performance of TMD in reducing translational vibaration obtainedat frequency range of 11,6 to 14,8 Hz. Maximum reduction of translational vibration 94,56 % and rotational vibration 0% is obtained at its natural frequency (12,9 Hz) when TMD is located at the COG of the main system, with source of vibration distance from the main system’s COG of 0,12 m. Whereas maximum reduction of translational vibration 94, 81 % and rotational vibration 79, 48 % is obtained at its natural frequency (12,9 Hz) when TMD is located at the COG of the main system, with source of vibration distance from the main system’s COG of 0, 148 m.The simulation and experiment are in a good agreement with error ranging from 5% to 15%.
Keywords: tuned mass damper, simulation, centre of gravity, frequency range.
INTRODUCTION
Dynamic Vibration Absorber (DVA) or Tuned Mass Damper (TMD) has been widely researched and used to absorb the vibration energy of the vibrating main system. The concept is to distribute part of the vibration energy of the main system into the secondary system (TMD).
In general, DVA or TMD uses additional mass-spring-damper system attached to the main system, and known as a passive vibration control. TMD is designed to have natural frequency similar to that the main system’s operating frequency. Recently, the development of TMD come to an adaptive and active TMD, in addition to passive TMD [1][2]. The fundamental concept of passive TMD is first introduced by Watt [3] when investigating the method of how to reduce the effect of rolling of a ship. However, the practical design of TMD first introduced by Frahm [4] in 1902. Frahm designed a fluid tank system to reduce the rolling effect of a ship. In the design, Frahm still ignored the damping of the main system.
The use of TMD has several advantages, i.e.:simple design, easy mounting and effective to reduce low frequency band.TMD is best used as anti-resonance at specific-defined-operating frequency. The best performance of TMD in reducing vibration is when the operating or excitation frequency is constant. However, when the operating frequency is varied, the performance of undamped TMD is low. Ormondroyd and Den Hartog [5] developed a damped TMDwhich has better performance in reducing vibration of the main system in a wide frequency range.
Wang [6] introduced an adaptive vibration absorber to minimize steady state and transient vibrations. In advance,Nishimura [7] used an H∞ control of multi -degree of freedom sturcture of hybrid dynamic vibration absorber and carrying out an experimental work to validate the robustness and control performances.Similar to Wang and Nishimura, Yoshida [8] reported a study on active vibration control for builder subjected to horizontal and vertical large seismic excitation. To improve the effctiveness of the TMD, Sheth [9] and Krenk [10] conducted a research on vibration control of slab breaker machine by passive dual mass tuned vibration absorber.
This paper presents a study on the effect of vibration source and TMD distance from the center of gravity (COG) to the vibration responses of a 2DOF main system. The system was mathematically modeled and simulated. The simulation results were verified experimentally and analyzed. The valid model was used to simulate the vibartion responses and vibration reduction of the 2DOF main system due to variation of the vibration source distance and TMD distance from the COG.
METHOD
Figure-1.Detail drawing of the 2DOF system with TMD.
Figure-2. Dynamic model of the 2DOF system with TMD and exciter.
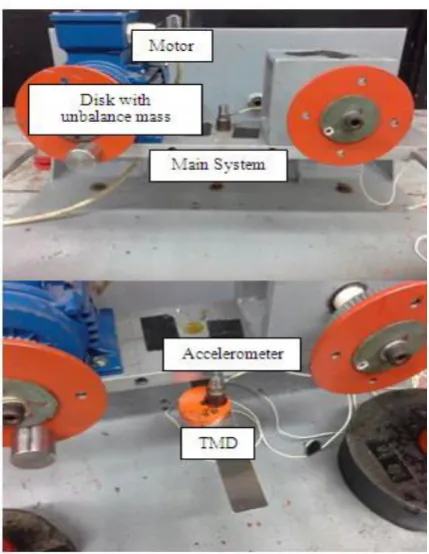
Figure-3. Experimental apparatus, 2DOF system with TMD and unbalance disk as exciter.
It is mainly consist of1.Main system, 2.Plate, 3.Beam as the main system stiffness, 4.Electric Motor, 5.Unbalance mass, 6.Beam as TMD stiffness, 7.TMD mass, 8.Balancer-dummy box.The exciter/source of vibration is made from unbalance disk coupled to electric motor which the rotational velocity can be varied. Figure-2 shows the schematic or dynamic model of the system.
The system was mathematically modeled and simulated. The simulation results were verified experimentally and analyzed. The valid model was used to simulate the vibartion responses and vibration reduction due to variation of the vibration source distance and TMD distance from the COG.
[image:2.595.52.285.294.423.2]Figure-4. Free body force diagram of the 2DOF system without TMD [translational force equilibrium].
[image:2.595.316.530.401.511.2]Figure-5. Free body force diagram of the 2DOF system with TMD.Translational force equilibrium.
Figure-6. Free body force diagram of the TMD.
Theoretical background and dynamic equation
The 2DOF system with and without TMD seen in Figure 1 and 3 are mathematically modelled. Based on the free body force diagram shown in Figure 4 and 5, and owing newton second law of motion for force and moment equlibrium, the equation of motion for translational and rotational motion are obtained.
Equation (1) shows the translational equation of motion of the 2DOF system without TMD, and equaiton
𝑦 𝑦
y
𝑀𝑦
𝑦 𝑦
[image:2.595.53.268.466.743.2] [image:2.595.348.500.558.642.2]7026
(2) is the state variable form of equation (1). Equation (3)and (4) are the rotational equation of motion of the system
without TMD.
𝑦 =
𝑀𝑏[− + yb− ℓ − ℓ 𝜃 − + yb− ℓ − ℓ 𝜃 + + 𝑦𝑦 + m𝜔 𝑅𝑠𝑖 𝛼] (1)
𝐼. 𝜃 + + ℓ θ + ℓ + ℓ 𝜃 = (- ℓ + ℓ yb + (- ℓ + ℓ yb+ m 𝜔 𝑅𝑠𝑖 𝛼 (2)
𝜃 =
𝐼[− + ℓ θ − ℓ + ℓ 𝜃 + − ℓ + ℓ + yb + − ℓ + ℓ yb + m 𝜔 𝑅𝑠𝑖 𝛼] (3)
Equation (5) shows the translational equation of motion of the 2DOF system with TMD, and equaiton (6) is the state variable form of equation (5). Equation (7) and (8) are the rotational equation of motion of the system with TMD.
𝑀 𝑦 + + + 𝑦 yb+ ℓ − ℓ − 𝑦 𝜃 + + + 𝑦 yb+ ℓ − ℓ − 𝑦 𝜃 – 𝑦𝑦 - 𝑦𝑦 = m𝜔 𝑅𝑠𝑖 𝛼 (4)
𝑦 =
𝑀𝑏[
− + + 𝑦 yb− ( ℓ − ℓ − 𝑦 )𝜃
− + + 𝑦 yb− ( ℓ − ℓ − 𝑦 )𝜃
+ 𝑦𝑦 + 𝑦𝑦 + m𝜔 𝑅𝑠𝑖 𝛼
] (5)
𝐼. 𝜃 + + ℓ + 𝑦. θ + ℓ + ℓ +
𝑦. 𝜃 =
(- ℓ + ℓ + 𝑦. yb +(- ℓ + ℓ + 𝑦 yb - 𝑦. 𝑦 - 𝑦 𝑦 + m 𝜔 𝑅𝑠𝑖 𝛼 (6)
𝜃 = 𝐼[−( + ℓ − 𝑦 )θ − ℓ + ℓ − 𝑦 𝜃 + − ℓ + ℓ + 𝑦 yb + − ℓ + ℓ + 𝑦 yb − 𝑦 𝑦 − 𝑦 𝑦 +
m 𝜔 𝑅𝑠𝑖 𝛼] (7)
Based on the governed equation of motion, the state variable equation and the block diagram of simulation are developed. And, simulation was carried out to obtained the vibration responses and reduction at various vibration source and TMD distance from the center of gravity (COG). The notations of the equation are explained in Table-1.
The damping coefficient/constant of the system can be obtained by implementing the equation of free vibration reponse when the intial condition, displacement and velocity are known. Equation (9) can be used to calculate the damping constant of the system when the value of y1 and y2 are known from the experimental result.
2 2 1 1 2 2 ln y
y (8)
where𝛿 ≃ 2𝜋𝜉, and from equation (9), the damping ratio of the system is known, as shown in equation (10).
𝜉 = 𝛿
√ 𝜋 + ln 𝑦𝑦 (9)
where mk c m c n 2 2
, by substituting the
damping ratio into equation (9), the damping constant can be obtained by equation (10).
22 1 2 2 1 ln 2 ln 2 y y mk y y c
(10) EXPERIMENTFigure-3 shows the prototype of the experimental apparatus, 2DOF system with TMD and unbalance disk coupled to electric motor as exciter. Experiment was started by verifying the system’s stiffness and damping constant. To obtained the stiffness, the system was statically weighted with various weight and the static deflection was measured. Stiffness can be calculated from the measured deflection and the applied wheight force.
7027
Table-1. Parameters used in the modelling and simulation.Parameters Notation Value
Weighted mass mk 5 [kg]
Mass of motor mm 5 [kg]
Unbalance mass mu 0,14 [kg]
Plate mass mp 3,09 [kg]
Disk mass md 0,75 [kg]
Total mass of the system m 13,9 [kg]
Exciter distance from COG a 0,145 [m] Cantilever beam 1 distance
from COG L1 0,23 [m]
Cantilever beam 2 distance
from COG L2 0,23 [m]
Disk radius r 0,06 [m]
Motor’s operating frequency f 0 to 30 [rpm]
Stiffness constant 1 and 2 k1, k2
44,8 [kN/m] Damping coefficient cs 50,7 [Ns/m]
TMD damping coefficient ca 1,63 [Ns/m]
Moment of inertia I 0,3 [kg.m2]
RESULTS AND ANALYSIS
Damping constant of the system
Figures 7 and 8 show the transient response of the main system and TMD, respectively, as excited by initial displacement. Owing equation (11) and by susbtituting the value of y1 and y2 from the experimental result shown in
Figures 7 and 8, the damping constant pf the main system and TMD are obtained.The damping constant of the main system isCm=52,99 N.s/m and the damping constant of the
TMD is Ca=1,6 N.s/m.The damping constant then used as
parameter for simulation, in addition to spring constant and other parameters seen in Table-1.
Simulation result and experimental validation
Figures 9 and 10 show the experiment and simultated acceleration responses of the main system without TMD for translational and rotational vibration, respectively. It can be seen that both simulation and experiment are in a good agreement.
Figure-7. Experimental transient response of the main system.
Figure-8. Experimental transient response of the TMD.
Figure-9. Traslational acceleration of the main system without TMD: simulation and experiment.
The difference between experiment and theory is less than 10%. The peak of vibration occurs at frequency 16 Hz, both for translational and rotational response.
7028
Figure-10. Rotational acceleration of the main systemwithout TMD: simulation and experiment.
Figure-11. Tranlational acceleration of the main system with TMD: simulation and experiment.
Figure-12. Rotational acceleration of the main system with TMD: simulation and experiment.
Simulated vibration response and reduction
Figures 13 and 14 show the translational and rotational vibration responses of the main system for various r1 and rf when vibration source is 0.12m away
from the COG.Where r1 is the ratio of TMD and soruce of
vibration distance from the COG and rf is the ratio of
excitation frequency and main system natural frequency. Figure-13 shows that the peak of vibration of the main system before implementing TMD occurs at ratio of frequency (rf)1.5, as seen by the black line curve
(non-DVA). As TMD is implemented to the system, the peak is
devided in two, shifts to left and right part of the previous peak (without TMD) which then become valley. This phenomena occurs due to the additional degree of freedom produce by additional TMD. The change of the ratio of TMD and soruce of vibration distance from the COG (r1)
influence the maximum value of the two peak, but not change the value of rf. Similar phenomena occur for
rotational vibration as seen in Figure 14. Figure 15 and 16 show the percentage of reduction of translational and rotational vibration for various r1 when vibration source is
0.12m away from the COG.In general, the percentage of reduction is high at low frequency for both, translational and rotational vibration.
Figures 17 and 18 show the translational and rotational vibration responses of the main system for various r1 and rf when vibration source is 0.145m away
from the COG. Figure-17 shows that the peak of vibration of the main system before implementing TMD occurs at ratio of frequency (rf)1, as seen by the black line curve
(non-DVA).
Figure-13. Translational vibration responses of the main system for various r1 and rf when vibration source is
0.12m away from the COG.
Figure-14. Rotational vibration responses of the main system for various r1 and rf when vibration source is
0.12m away from the COG.
The change of the ratio of TMD and soruce of vibration distance from the COG (r1) influence the
maximum value of the two peak, but not change the value of rf . Similar phenomena occur for rotational vibration as
various r1 when vibration source is 0.145m away from the
COG.In general, the percentage of reduction is high at low frequency for both, translational and rotational vibration.
Figure-15. Percentage of reduction of translational vibration responses for various r1 when vibration
source is 0.12m away from the COG.
Figure-16. Percentage of reduction of rotational vibration responses for various r1 when vibration source is 0.12m
away from the COG.
Figure-17. Translational vibration responses for various r1 and rf when vibration source is 0,145 m away from
the COG.
Figure-18. Rotational vibration responses for various r1 and rf when vibration source is 0,145 m away from
the COG.
Figure-19. Percentage of reduction of translational vibration responses for various r1 when vibration
source is 0.145 m away from the COG.
Figure-20. Percentage of reduction of rotational vibration responses for various r1 when vibration source is 0.145 m
away from the COG.
CONCLUSIONS
7030
from the main system’s COG of 0, 12 m. Whereasmaximum reduction of translational vibration 94,81 % and rotational vibration 79, 48 % is obtained at its natural frequency (12, 9 Hz) when TMD is located at the COG of the main system, with source of vibration distance from the main system’s COG of 0, 148 m. The simulation and experiment are in a good agreement with error ranging from 5% to 15%.
REFERENCES
[1] Sun H.L., Zhang P.Q., Chen H.B., Zhang K, dan Gong X.L. 2007. Application of Dynamic Vibration Absorber in Structural Vibration Control under Multi-Frequency Harmonic Excitation. J.Applied Acoustics. 69, pp. 1361-1367.
[2] Sun J.Q., Jolly M.R., dan Norris M.A. 1995. Passive, Adaptive, and Active Tuned Vibration Absorber-Survey. Transactions of the ASME. 117, 234-242.
[3] Watt P. 1883. On a method of Reducing the Rolling of Ships at Sea. Transactions of the ASME 50 PAPM-241.
[4] Frahm H. 1911. Device for Damping Vibrations of Bodies. US Patent No. 989958.
[5] Ormondroyd J. and Hartog J. P. D. 1928. Theory of the Dynamic Vibration Absorber. Trans. Am. Soc. Mech. Eng. 50, pp. 9-22.
[6] Wang K.W., Lamncuss J.S., dan Mianzo L.A. 1992. An Adaptive Vibration Absorber to Minimize Steady State and Transien Vibrations. Techincal Report to Lord Corporation, Pennsylvania State University.
[7] Fujita T., Katsu M., Miyano H., dan Takanashi S. 1991. Fundamental Study of Active-Passive Mass Damper Using XY-Motion Mechanism and Hydraulic Actuator for Vibration Control of Tall Building. Transactions of the Japan Society of Mechanical Engineers, Part C. 57: 3532-3539.
[8] Nishimura, H., Nonami, K., Cui, W., dan Shiba, A., 1993. H∞ Control of Multi-Degree-of -Freedom Sturcture of Hybrid Dynamic Vibration Absorber (Experimental Consideration of Robustness and Control Performances). Transactions of the Japan Society of Mechanical Engineers, Part C. 59: 714-720.
[9] Yoshida K. 1996. Active Vibration Control for Builder Subjected to Horizontal and Vertical Large
Seismic Excitation. Proceeding of 35th Conference on Decision and Control.
[10]Sheth A.J., Parmar P.R., Solanki B.L., Sailor N.G., Gohil B.P., dan Patel H.A. 2014. Vibration Control of Slab Breaker Machine by Passive Dual Mass Tuned Vibration Absorber. J. Applied Mechanics and Materials. 592-594: 2112-2116.