Munich Personal RePEc Archive
Interest Rate Determination in Small
Developing Countries
Lorde, Troy and Francis, Brian and Waithe, Kimberly and
Taylor, Timothy
The University of the West Indies, Cave Hill Campus
27 January 2008
Online at
https://mpra.ub.uni-muenchen.de/95621/
Interest Rate Determination in Small Developing Countries
Troy Lordea Brian Francisa , Kimberly Waithea and Timothy G. Taylorb
aDepartment of Economics, University of the West Indies, Cave Hill Campus, Barbados
bFood and Resource Economics Department, University of Florida, Gainesville,
Abstract
This paper investigates the validity of Fisher’s hypothesis in determining nominal interest rates for
five small developing countries—The Bahamas, Barbados, Guyana, Jamaica, and Trinidad and
Tobago. We augment the traditional Fisher test equation by introducing the US nominal interest
rate. Results indicate that there is a long run relationship for The Bahamas and Trinidad and
Tobago; and for Jamaica during the period when the country is under a floating exchange regime.
The nominal interest rate in each of the latter countries is positively related to the US nominal rate.
Specifically, in The Bahamas the relationship is one-for-one, and for the others it is greater than
one-for-one. Expected inflation only has an effect in Jamaica and Trinidad and Tobago, although
the relationship is negative in the case of the latter. Fisher’s hypothesis, even in its augmented
form, does not appear to be a suitable framework for determination of nominal interest rates for
Barbados and Guyana.
Keywords: interest rates; developing countries; Fisher’s hypothesis, monetary policy
1. Introduction
Economists and policymakers have long been concerned about the factors that influence the
determination of interest rates. In many cases, this concern has focused on the relation of interest
rates to the domestic rate of inflation. The theoretical underpinning for examination of this
relationship usually begins with Fisher (1930). Fisher pointed out that in long-run equilibrium
nominal interest rates adjust to changes in inflationary expectations induced by changes in the
money supply growth rate. Thus nominal interest rate movements mirror the movements in
expected inflation, leaving ex ante real interest rates constant, ceteris paribus. This last statement
does not signify that real interest rates will remain constant over time. Rather it signifies that
changes in real interest rates are likely the result of changes in real economic factors (Kinal and
Lahiri, 1988). Fisher’s hypothesis, if true, has implications for the scope of monetary policy.
Specifically, it implies that real interest rates are determined only by real factors and consequently,
monetary policy has no influence on real rates.
A considerable volume of research has investigated Fisher’s hypothesis. With relatively few
exceptions, for example, Thornton (1996), Payne and Ewing (1997) and Berument et al. (2007),
the theoretical and empirical work on the determination of interest rates focused on developed
countries. In most studies, the question of whether Fisher’s hypothesis is valid appears to be
merely an empirical matter. Their main concern is the documentation of the nature of the
relationship.
The current study addresses these shortcomings in the literature in several ways. First, the study
Caribbean—The Bahamas, Barbados, Jamaica and Trinidad and Tobago over the period
1975-2006 and Guyana over the period 1994-1975-2006—within the framework of Fisher’s hypothesis.
Another departure of the current study is that it takes into account the structural economic
characteristics that might allow for the Fisher relation to have relevance for the countries under
study.
The Bahamas and Barbados have each maintained conventional fixed pegs with the United States
dollar (USD) since the early 1970s. Over roughly the first half of the period under study, Jamaica
and Trinidad and Tobago also maintained conventional fixed pegs with the USD. While the latter
countries, including Guyana, currently have flexible exchange rate regimes de jure, their exchange
rates are so closely maintained within narrow bands vis-à-vis the USD that the International
Monetary Fund (IMF) classifies their regimes as fixed de facto (IMF, 2006). Therefore, shocks to
the US are readily transmitted to each Caribbean country since defence of the “anchor” reduces
the ability of each country’s central bank to respond to these shocks, via monetary policy actions.
Another structural feature is that all five countries are highly open, with trade (exports plus
imports) accounting for well over 75% of their respective Gross Domestic Products. Each country
is highly dependent on the US for imports of consumer goods. Thus, there is a high pass-through
from inflation in the US to domestic inflation in each country.
Taken together these characteristics suggest that each Caribbean country is structurally dependent
on the US economy. Given that the US Federal Reserve (FED) controls inflation through
countries under study is not discretionary, but to a great extent mimics US monetary policy. In
this paper, this is taken into account by examining Fisher’s relation augmented with nominal
interest rates from the US.
In investigating the augmented Fisher’s hypothesis for each country, four questions are of interest.
First, is there a long-run relationship between the domestic nominal interest rate, domestic
inflation, and the US nominal interest rate? Second, if such a relationship exists, does the domestic
nominal interest rate move unit proportionally with expected domestic inflation? Third, what is
the speed of adjustment of the nominal interest rate to changes in unanticipated inflation? Fourth,
does the nominal US interest rate Granger-cause the domestic nominal interest rate? Since the
exchange rate regime of Jamaica and Trinidad and Tobago changed over the period under study,
the sample is also split in order to determine if this change may have altered the relationship
between nominal interest rates and inflation in those countries. Given the close relationship
between interest rates and exchange rates, failure to take this switch into account could give
misleading results and lead to erroneous conclusions.
The analysis begins in Section 2 with a discussion of the different versions of the traditional Fisher
hypothesis and how each can be tested. Section 3 describes the data used in the study and outlines
the econometric methodology employed. The empirical evidence is presented and discussed in
2. The Fisher Hypothesis
In his classic contribution to the theory of interest rate determination, Fisher (1930) hypothesised
that a change in the money supply growth rate leads to a full perception of the change in inflation
and a concomitant adjustment of nominal interest rates over the long run. Inherently, this
hypothesis also suggests that ex ante real interest rates will be unresponsive to movements in
anticipated inflation. Put another way, any variation in inflation is fully absorbed in nominal
interest rates, and ex ante real rates only respond to changes in real factors, such as the productivity
of capital and time preference of consumers. If real interest rates respond to anticipated inflation
over the long run, then it implies that nominal interest rates have not fully absorbed inflationary
movements and the traditional Fisher hypothesis is not valid.
Darby (1975) and Feldstein (1976) argue that the Fisher hypothesis is a net-of-tax relationship.
They note that if the real interest rate is independent of anticipated inflation, the nominal taxable
interest rate must adjust greater than one-for-one with anticipated inflation. This strong form of
the hypothesis can be expressed as follows:
(1)
where is the nominal interest rate, is the ex ante real interest rate, is the ex ante real
inflation rate, and is the average tax rate on interest income. Since , if Fisher’s
hypothesis is valid, responds greater than unit proportionally to changes in .
In practice, the assumption is usually made that both and are small, so that the product
* becomes negligible (Fama, 1975; Darby, 1975). Due to the difficulty in observing real
1 1 1
1 1 1
e e e e
t t t t t
i r p r p
t t t
= + +
- -
-t
i rte pte
t 0< <t 1
t
i pte
e t
r pte e
t
r
e t
interest rates, another simplifying assumption is that the real interest rate is constant but can
fluctuate due to random shocks:
(2)
where is a positive constant and is a normally distributed, mean zero shock with constant
variance: . Incorporation of these two assumptions into Equation 1 gives the
semi-strong version of the Fisher hypothesis:
(3)
If the effects of taxes on returns are ignored, or if interest income is exempt from taxation, that is
, then we have an exposition of Fisher’s original weak-form hypothesis:
(4)
Equation 4 implies that nominal interest rates are unit proportional to changes in expected inflation
in the long run subject to short-run zero mean shocks. For the purposes of estimation, Equation 4
can be expressed as:
(5)
where is the constant ex ante real interest rate, is the actual inflation rate at time t and
represents the long-run impact of on . If then a positive long-run unit proportional
relationship exists between and . In order for Equation 5 to be interpreted as an equilibrium
relationship, then must be a stationary process. If is not stationary, then and have no
long-run relationship and implies that Fisher’s equilibrium hypothesis does not hold. *
e
t t
r =r +x
*
r xt
2 ~ (0, )
t N x
x s
1 1 1
*
1 1 1
e
t t t
i r p x
t t t
= + +
- -
-0
t =
* e
t t t
i =r +p +x
0 1
t t t
i =b +b p +x
0
b pt b1
t p t i 1 1 b = t i t p t
Evidence in support of Fisher’s original hypothesis of a one-for-one relation between nominal
taxable yields and anticipated inflation (Equation 4) was found by Fama (1975). However, articles
by Hess and Bicksler (1975), Jones (1977) and Nelson and Schwert (1977), among others,
challenged the assumption of a constant real interest rate. Their evidence suggested that real rates
varied inversely with expected inflation and consequently, nominal taxable rates adjust at a less
than one-for-one rate with anticipated inflation. Fama and Gibbons (1982) countered that as long
as the variation in the real rate is accounted for, the nominal taxable yields will rise unit
proportionally with anticipated inflation. Fama and Gibbons conclude that the real rate is
independent of inflation and that any changes in the real rate are swamped by changes in
anticipated inflation. According to the loanable funds theory, the decision to save and invest
depends on the real interest rate. Therefore taxable yields must include both a tax premium and
an inflation premium. Thus, evidence that supports the pre-tax Fisher hypothesis (Equation 4)
suggests that investors are suffering from “fiscal illusion” (Tanzi, 1980).
An alternative explanation for the relationship between interest rates and inflation expectations
was advanced by Carmichael and Stebbing (1983). The argument is that provided there is some
regulation of interest rates and provided that there is substitutability of financial and monetary
assets, there may be an inversion of Fisher’s hypothesis, especially in after-tax terms. They suggest
that it may be possible for the nominal interest rate to be constant over the long run, while the real
interest rate will move inversely one-for-one with the rate of expected inflation. Moreover,
Carmichael and Stebbing argue that the two versions are mutually exclusive—if the standard
3. Data and Econometric Methodology
All data used in the study are taken from the International Monetary Fund (IMF) online data base
available at: http://imfstatistics.org/imf/. The series are quarterly and run from 1975(1)-2006(2)
for The Bahamas, Barbados, Jamaica, Trinidad and Tobago and the US. Required series for
Guyana are only jointly available for the period 1994(1)-2006(2). The series used are the consumer
price index (2000 = 100) for each Caribbean country; and the treasury bill (t-bill) rate for all
countries including the US, as a measure of the nominal interest rate. The quarterly inflation rate
is modelled as .
Following Fama (1975) and Warner and Wallace (1993), the inflation rate at time t+1 is used to
proxy expected inflation, consistent with the current quarter’s interest rate incorporating forecasts
of next quarter’s inflation rate, which implies perfect foresight in the spirit of Fama’s (1975)
pioneering work. Consequently, nominal interest rates at time t are matched up with the actual
inflation rate attime t+1 which gives us the following estimable relationship:
(6)
where is the actual inflation rate at time t+1 and other variables are as previously defined.
In this work, Equation 6 is augmented with the US interest rate. The motivation for this, discussed
earlier, is based on the structural dependence of these Caribbean territories on the US economy.
The exchange rates of these five countries are pegged or closely maintained vis-à-vis the USD
reducing their capacity for independent monetary policy; and there is a high pass-through from
1
ln(CPIt/CPIt-)
0 1 1
t t t
i b b p x
+
= + +
1 t p
inflation in the US to domestic inflation in each country since these countries are dependent on the
US for imports, especially consumer goods. Therefore, the resulting equation is estimated1:
(7)
where is the US nominal interest rate and all variables are as previously defined.
On the basis of the different approaches and empirical findings, it is reasonable to construe that
the relationship between interest rates and inflation cannot be established a priori. The null
hypothesis for the standard Fisher effect is while the null for the inverted Fisher effect is
. Alternatively, if , then this suggests that nominal interest rates in each country move
one-for-one with US nominal interest rates, implying that inflation in the US is directly responsible
for determining interest rates in the Caribbean. Finally, a value of between zero and one
provides evidence that both the domestic nominal and real interest rates respond to changes in
anticipated (domestic) inflation (contrary to the strict implications of the traditional and inverted
Fisher hypotheses); and a value of between zero and one provides evidence that the domestic
nominal and real interest rates respond to changes in the nominal interest rate in the US.
Since Jamaica and Trinidad and Tobago moved from conventional fixed peg regimes with the
United States dollar (USD) to floating rate regimes in 1991 and 1993 respectively, their samples
will be divided in order to determine if a regime shift may have altered the relationship between
1 The lack of available data on average tax rates for the Caribbean countries under investigation precludes us from
investigating the semi-strong version of Fisher’s hypothesis. However, this allows our findings to be compared with
previous research which typically reports results based on estimation of Equation 5 0 1 1 2
US
t t t t
i b b p b i x
+
= + + +
US t i
1 1
b =
1 0
b = b2 =1
1 b
2
nominal interest rates and inflation in these countries.2 In an attempt to remove any possible
disequilibrium effect on the nominal interest rate/inflation rate relationship occasioned by each
country’s move to a different exchange rate regime, a gap of two years on either side of the year
of floating is imposed. The intention is to clearly define the two periods to see if exchange rate
regimes have any influence on Fisher’s interest rate/inflation rate relationship hypothesis. For
Jamaica, the two subperiods are 1975(1)-1989(4) and 1993(1)-2006(2) and for Trinidad and
Tobago 1975(1)-1991(4) and 1995(1)-2006(2).
To test for the presence of a long-run relationship, the maximum likelihood method developed by
Johansen (1988, 1991) is utilised. Following Johansen, an m-dimensional (mx1) vector
autoregressive model (VAR), y, with Gaussian errors can be expressed by:
, t = 1, 2, …, T (8)
where et is i.i.d. By taking first-differences on the vector, the model in vector error correction
(VECM) form is:
(9)
The matrix conveys information about the long-run relationship between ytvariables. Testing
for cointegration involves testing for the rank of matrix, r, by examining whether the
eigenvalues of are significantly different from zero. Johansen (1991) proposes two test statistics
for testing the number of cointegrating vectors (or the rank of ): the trace (Tr) and the maximum
2 Guyana also moved from a fixed peg to a floating rate, but data is only available after the year in which they floated,
1988.
1 1 2 2 ...
t t t k t k t
y A y A y A y µ e
- -
-= + + + + +
1 1 2 2 ... 1 1 1
t t t k t k t t
y y y y py µ e
- - - - +
-D =G D +G D + +G D - + +
p
p
p
eigenvalue (L-max) statistics. The null hypothesis for the trace test is that there are at most r
cointegrating vectors, while for the max eigenvalue test, the null r = 0 is tested against the
alternative that r = 1; r = 1 against the alternative r = 2; and so forth. The Schwarz Information
Criterion (SIC) will be used to select the number of lags required in the cointegration test.
A necessary precondition to testing for cointegration is to inspect the unit root properties of the
variables under consideration. Several tests for the presence of unit roots in time-series data are
popular in the literature. In this study, unit roots are tested using the Dickey-Fuller
(DF)/Augmented Dickey-Fuller (ADF) test by Dickey and Fuller (1979, 1981); the Phillips-Perron
(PP) test by Phillips and Perron (1988); and the KPSS test by Kwiatkowski, Phillips, Schmidt and
Shin (1992). A conclusion on the degree of integration is made based on the agreement of atleast
two of the three unit root tests. The SIC is employed to determine the lag length k.
Finally, to examine whether a short-run relationship exists, the Granger-causality test developed
from the seminal paper of Granger (1969) will be employed. Basically, this test seeks to ascertain
whether or not the inclusion of past values of a variable x do or do not help in the prediction of
present values of another variable y. If variable y is better predicted by including past values of x
4. Results and Analysis
The procedures described in the previous section are employed to test the validity of Fisher’s
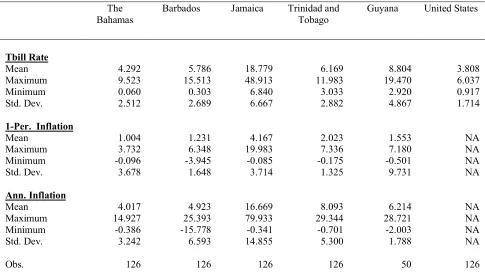
hypothesis for 5 Caribbean countries. Before these procedures are implemented, summary
statistics are calculated and provided in Table 1. The annualised inflation rate, calculated as 4*
, is also reported. Results show that of the 4 countries with observations over the
entire sample period, Jamaica has experienced the highest quarterly and annual inflation rates as
well as the highest spread between t-bill rates. Subject to the caveat that data for Guyana is over
a much shorter sample, summary statistics indicate rates of inflation and t-bill rates similar to those
for The Bahamas, Barbados, and Trinidad and Tobago.
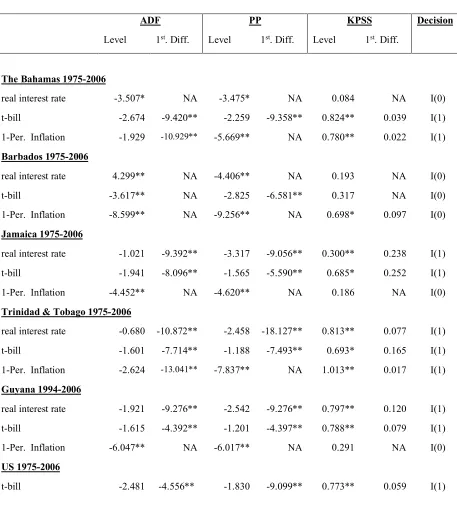
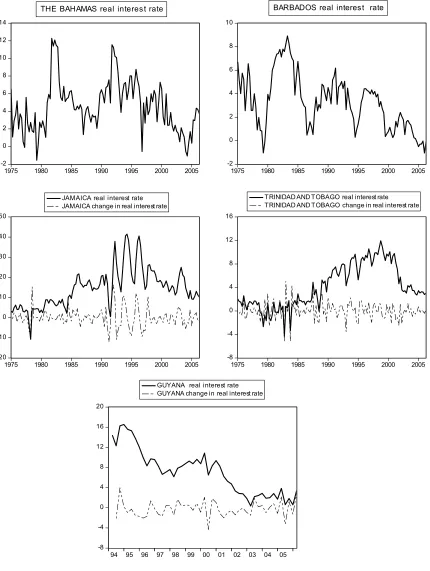
To determine whether the real interest rate for each Caribbean country can be considered to be
constant, formal testing through the use of the ADF, PP and KPSS unit root tests (see Table 2)
were conducted to discern the stationarity of the series. Plots of each series are also shown in
Figure 1. The tests indicate that the real interest rate is constant only for The Bahamas and
Barbados, supporting Fama’s (1975) contention, but not for Jamaica, Trinidad and Tobago, and
Guyana. Further testing indicates that the first difference of the real interest rate for Jamaica,
Trinidad and Tobago and Guyana is constant (stationary). This finding serves to change our
interpretation of the constant term in Equation 7. That is, in the case of The Bahamas and
Barbados, the evidence indicates that the real interest rate is constant, but can fluctuate due to
random shocks, which implies the weak form of the Fisher hypothesis. On the other hand, it is the
change in the real interest rate which is constant over time, but fluctuates due to random shocks in
Jamaica, Guyana and Trinidad and Tobago.
1
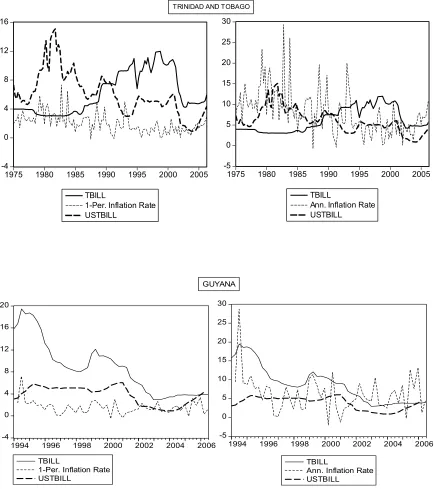
As a preliminary investigation into the long-run relationship between the nominal interest rate and
inflation, Figure 2 plots the domestic t-bill series for each Caribbean country and the US along
with the one-period (quarterly) inflation rate and the annualised inflation rate, respectively. A
visual inspection of Figure 2 shows that for The Bahamas, the domestic t-bill rate appears to
closely follow the long-run behaviour and short-run fluctuations in the US t-bill rate, but slightly
less so for the inflation rate, with a lag. For Barbados, Jamaica, and Guyana, the visual evidence
shows no similar trends between or among the t-bill rate, inflation rates and US t-bill rate, while
for Trinidad and Tobago there appears to be some indication that the domestic t-bill rate and
inflation rate are moving in opposite directions.
Before testing for cointegration, the unit root properties of the domestic and US t-bill rates and the
inflation rate are examined. Table 2 contains the results. The results from the tests indicate that
the t-bill rate and one-period inflation rate follow I(1) processes for The Bahamas and Trinidad
and Tobago over the 1975(1)-2006(2). All series are stationary for Barbados, while for Jamaica
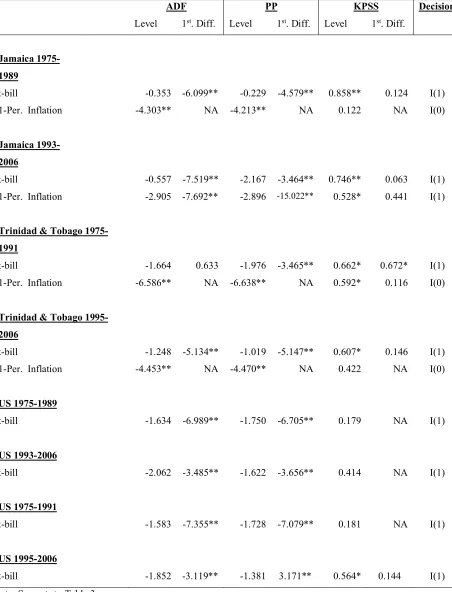
and Guyana, the t-bill rate is I(1) but inflation is I(0). When the series for Jamaica and Trinidad
and Tobago are divided to ascertain whether a shift from fixed exchange rates with the US to
floating regimes has any influence on the interest rate/inflation rate relationship, the findings differ
from those over the entire sample (see Table 3). For Jamaica, over 1975-1989, the t-bill rate is
I(1) and inflation is I(0). Conversely, over 1993-2006, the nominal interest rate and inflation all
follow I(1) processes. For Trinidad and Tobago, the t-bill rate is I(1) and inflation I(0) for each
sub-sample.3 The US t-bill rate is I(1) over each period.
Based on these results, we proceed to test for cointegration between the nominal interest rate and
inflation using the Johansen method for The Bahamas and Trinidad and Tobago from
1975(1)-2006(2), and for Jamaica from 1993(1)-2005(2). Prior to testing for cointegration, we establish
the lag length of the VAR since the Johansen procedure is sensitive to the number of lags used in
the test (Gonzalo, 1989). We allow for up to 12 lags (3 years) of each series and test using the
SIC.
Table 4 reports the results for the trace test and maximum eigenvalue test for cointegration between
the one-period rate of inflation and the t-bill rate. The tests indicate that there is one cointegrating
relationship for The Bahamas, Jamaica and Trinidad and Tobago over the periods as indicated in
the table. Table 5 also shows the cointegrating vectors normalised on the nominal interest rate.
Tests to determine if there is a unit proportional relationship between the domestic nominal interest
rate and inflation and/or between the domestic nominal interest rate and the US nominal interest
rate respectively in each country are conducted. For The Bahamas, evidence supports a
one-for-one relationship with the US interest rate, while there is no such finding for Jamaica and Trinidad
and Tobago. In Jamaica, the nominal interest rate is positively related to inflation and the US
interest rate and responds greater than unit proportionally during the period when it maintains a
flexible exchange rate regime. The nominal interest rate is inversely related to inflation and
positively related to the US interest rate in Trinidad and Tobago. Table 5 also reports the speed of
adjustment of the nominal interest rate to unanticipated inflation. The speed of adjustment for
Although the unit root properties of the series preclude the establishment of a long-run relationship
for Barbados and Guyana, we estimated Equation 7 using ordinary least squares, with the
appropriate variables differenced as necessary. Results for Barbados indicate the nominal interest
rate is not impacted by expected inflation, but is inversely related to the change in the US nominal
interest rate (coefficient of -0.520 significant at 10%). For Guyana, the change in the nominal
interest rate depends positively on expected inflation (coefficient of 0.174 significant at 10%), but
is not affected by the change in the US nominal interest rate.
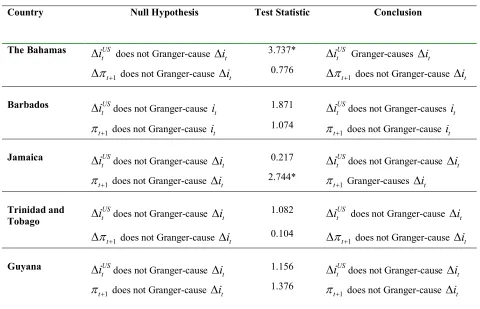
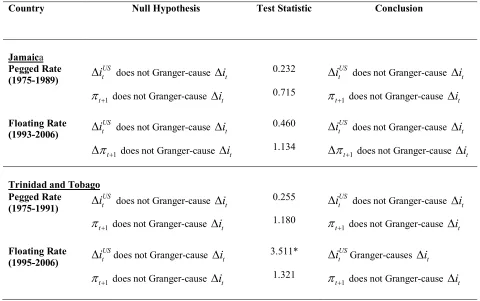
Finally, we perform Granger-causality tests to determine whether any short-run relationships exist.
Variables in the different countries are differenced as necessary in order to satisfy the stationarity
requirements of the tests. Tables 5 and 6 report the results. Over 1975(1) to 2006(2), there is
evidence of short-run causality from the nominal rate in the US to the nominal rate for The
Bahamas and from inflation to the nominal interest rate for Jamaica. For tests on the sub-samples
for Jamaica and Trinidad and Tobago, there is evidence to suggest that the US interest rate
Granger-causes the nominal interest rate in Trinidad and Tobago over 1995(1) to 2006(2);
however, no evidence of Granger-causality is found for Jamaica.
5. Concluding Remarks
This paper sought to determine interest rates in five small developing countries—The Bahamas,
Barbados, Guyana, Jamaica, and Trinidad and Tobago—within the framework of Fisher’s classical
(1930) hypothesis using the techniques of cointegration and error correction. Fisher’s hypothesis
in its standard form posits that the nominal interest rate would adjust one-for-one with anticipated
In this work, the standard Fisher relation is augmented with the US t-bill rate, to account for each
country’s structural dependence on the US, especially import dependence.
Overall, findings do not support Fisher’s original hypothesis of a one-for-one relation between
nominal taxable yields and anticipated inflation posited in Fama (1975). First, the real interest rate
is constant in only The Bahamas and Barbados, while the change in the real interest rate is constant
for the other countries. Second, while there was evidence of a long-run relationship, results are
diverse. Evidence for The Bahamas suggests that its nominal interest rate moves one-for-one with
the US nominal interest rate; for Trinidad and Tobago the nominal interest rate is inversely related
to expected inflation but positively related to the US nominal interest rate; and for Jamaica (after
1993), the nominal interest rate is positive related to both expected inflation and the US nominal
interest rate. It is possible that some unknown influence may be driving the nominal interest rate
and inflation rate in opposite directions, a phenomenon that probably warrants further research to
identify other possible determinants of the nominal interest rate in Trinidad and Tobago. Third,
the speeds of adjustment of the nominal interest rate towards long-run equilibrium in The
Bahamas, Trinidad and Tobago, and Jamaica are 20%, 9%, and 26.9% respectively.
Our results also indicated that there was an interesting structural change in the long-run
relationship for Jamaica, which occurred after it floated its currency in 1991. Another point is that
it is important to also examine short-run relationships. The short-run results for The Bahamas
reinforce the long-run results; however, the short-run effects of the identified relationships for
Jamaica and Trinidad and Tobago over the full and sub samples suggest that there is some
From a policy perspective, our results suggest that monetary policy in The Bahamas, Jamaica, and
Trinidad and Tobago is dependent on monetary policy in the US in the long run (and short run for
The Bahamas). These findings could be as a result of the fact that The Bahamas is completely,
though unofficially, dollarised while as earlier indicated, Jamaica and Trinidad and Tobago
actively intervene in the foreign exchange market in order to maintain stability of their currencies
References
Berument, H., Ceylan, N.D. and Olgun, H. (2007), Inflation uncertainty and interest rates: is the
Fisher relation universal? Applied Economics,39, 53-68.
Carmichael, J. and Stebbing, P. (1983) Fisher’s paradox and the theory of interest, American
Economic Review,73, 619-30.
Darby, M. (1975) The financial and tax effects of monetary policy on interest rates, Economic
Inquiry,13, 266-75.
Dickey, D.A. and Fuller, W.A. (1979) Distribution of the estimators for autoregressive time series
with a unit root, Journal of the American Statistical Association,74, 427-31.
Dickey, D.A. and Fuller, W.A. (1981) Likelihood ratio statistics for autoregressive time series with
a unit root, Econometrica,49, 1057-1072.
Fama, E.F. (1975) Short-term interest rates as predictors of inflation, American Economic Review,
65, 883-87.
Fama, E.F. and Gibbons, M.R. (1982) Inflation, real returns, and capital investment, Journal of
Monetary Economics,9, 297-323.
Feldstein, M.S. (1976) Inflation, income taxes, and the rates of interest: a theoretical analysis,
American Economic Review,66, 809-30.
Fisher, I. (1930) The theory of Interest. New York: MacMillan.
Granger, Clive W.J. (1969) Investigating causal relations by econometric models and cross-sectral
methods, Econometrica, 37, 422-38.
Gonzalo, J. (1989) A comparison of five alternative methods of estimating long-run equilibrium
Hess, P.J. and Bicksler, J.L. (1975) Capital asset prices versus time series model as predictors of
inflation: the expected real rate of interest and market efficiency, Journal of Financial
Economics,3, 341-60
International Monetary Fund (2006) De facto classification of exchange rate regimes and monetary
policy framework, http://www.imf.org/external/np/mfd/er/2006/eng/0706.htm (Accessed
March, 3rd, 2007).
Johansen, S. (1988) Statistical analysis of cointegration vectors, Journal of Economic Dynamic
and Control,(June/Sept), 231-54.
Johansen, S. 1991. Estimation and hypothesis testing of cointegration vectors in gaussian vector
autoregressive models, Econometrica, 59, 1551-80.
Jones, D.H. (1977) Short-term interest rates as predictors of inflation: comments, American
Economics Review,6: 476-77.
Kinal, T. and Lahiri, K. (1988) A model for ex ante real interest rates and derived inflation
forecasts, Journal of the America Statistical Association,83, 665-73.
Kwiatkowski, D., Phillips, P., Schmidt, P. and Shin, Y. (1992) Testing the null hypothesis of
stationarity against the alternative of a unit root, Journal of Econometrics54, 159-78.
MacKinnon, J.G. (1991) Critical values for cointegration tests, in Long-Run Economic
Relationships: Readings in Cointegration (Ed.) R.F. Engle and C.W.J. Granger, Oxford,
United Kingdom: Oxford University Press.
Mackinnon, J.G., Haug, A.A. and Michelis, L. (1999) Numerical distribution functions of
likelihood ratio tests for cointegration, Journal of Applied Econometrics,14, 563-77.
Nelson, C.R., and Schwert, G.W. (1977) Interest rates, income taxes, and anticipated inflation,
Payne, J.E. and Ewing, B.T. (1997) Evidence from lesser developed countries on the Fisher
hypothesis: a cointegration analysis, Applied Economics Letters,4, 683-87.
Phillips, P. and Perron, P. (1988) Testing for unit root in the time series regression. Biometrika,
75, 336-40.
Tanzi, V. (1980) Inflationary expectations, economic activity, taxes and interest rates, American
Economic Review,70, 12-21.
Thornton, J. (1996) The adjustment of nominal interest rates in Mexico: a study of the Fisher effect,
Applied Economics Letters,3, 255-57.
Wallace, M.S. and Warner, J.T. (1993) The Fisher effect and the term structure of interest rates:
Table 1: Summary Statistics of Interest and Inflation Rates 1975(1)-2006(2)
The Bahamas
Barbados Jamaica Trinidad and Tobago
Guyana United States
Tbill Rate
Mean 4.292 5.786 18.779 6.169 8.804 3.808
Maximum 9.523 15.513 48.913 11.983 19.470 6.037
Minimum 0.060 0.303 6.840 3.033 2.920 0.917
Std. Dev. 2.512 2.689 6.667 2.882 4.867 1.714
1-Per. Inflation
Mean 1.004 1.231 4.167 2.023 1.553 NA
Maximum 3.732 6.348 19.983 7.336 7.180 NA
Minimum -0.096 -3.945 -0.085 -0.175 -0.501 NA
Std. Dev. 3.678 1.648 3.714 1.325 9.731 NA
Ann. Inflation
Mean 4.017 4.923 16.669 8.093 6.214 NA
Maximum 14.927 25.393 79.933 29.344 28.721 NA
Minimum -0.386 -15.778 -0.341 -0.701 -2.003 NA
Std. Dev. 3.242 6.593 14.855 5.300 1.788 NA
Obs. 126 126 126 126 50 126
Notes: TBILL stands for treasury bill. 1-Per. inflation stands for one-period (quarterly) rate of inflation. Ann. inflation
Table 2: Unit Root Tests
ADF PP KPSS Decision
Level 1st. Diff. Level 1st. Diff. Level 1st. Diff.
The Bahamas 1975-2006
real interest rate -3.507* NA -3.475* NA 0.084 NA I(0)
t-bill -2.674 -9.420** -2.259 -9.358** 0.824** 0.039 I(1)
1-Per. Inflation -1.929 -10.929** -5.669** NA 0.780** 0.022 I(1)
Barbados 1975-2006
real interest rate 4.299** NA -4.406** NA 0.193 NA I(0)
t-bill -3.617** NA -2.825 -6.581** 0.317 NA I(0)
1-Per. Inflation -8.599** NA -9.256** NA 0.698* 0.097 I(0)
Jamaica 1975-2006
real interest rate -1.021 -9.392** -3.317 -9.056** 0.300** 0.238 I(1)
t-bill -1.941 -8.096** -1.565 -5.590** 0.685* 0.252 I(1)
1-Per. Inflation -4.452** NA -4.620** NA 0.186 NA I(0)
Trinidad & Tobago 1975-2006
real interest rate -0.680 -10.872** -2.458 -18.127** 0.813** 0.077 I(1)
t-bill -1.601 -7.714** -1.188 -7.493** 0.693* 0.165 I(1)
1-Per. Inflation -2.624 -13.041** -7.837** NA 1.013** 0.017 I(1)
Guyana 1994-2006
real interest rate -1.921 -9.276** -2.542 -9.276** 0.797** 0.120 I(1)
t-bill -1.615 -4.392** -1.201 -4.397** 0.788** 0.079 I(1)
1-Per. Inflation -6.047** NA -6.017** NA 0.291 NA I(0)
US 1975-2006
t-bill -2.481 -4.556** -1.830 -9.099** 0.773** 0.059 I(1)
Notes: 1-Per. inflation stands for one-period (quarterly) rate of inflation. Critical values are obtained from MacKinnon
(1991). Unit roots were conducted using a constant as the only deterministic component for each test. **
denotes significance at 1% and * denotes significance at 5%. The last column indicates the order of
Table 3: Unit Root Tests of Sub-samples for Jamaica, Trinidad and Tobago and the US
ADF PP KPSS Decision
Level 1st. Diff. Level 1st. Diff. Level 1st. Diff.
Jamaica
1975-1989
t-bill -0.353 -6.099** -0.229 -4.579** 0.858** 0.124 I(1)
1-Per. Inflation -4.303** NA -4.213** NA 0.122 NA I(0)
Jamaica
1993-2006
t-bill -0.557 -7.519** -2.167 -3.464** 0.746** 0.063 I(1)
1-Per. Inflation -2.905 -7.692** -2.896 -15.022** 0.528* 0.441 I(1)
Trinidad & Tobago
1975-1991
t-bill -1.664 0.633 -1.976 -3.465** 0.662* 0.672* I(1)
1-Per. Inflation -6.586** NA -6.638** NA 0.592* 0.116 I(0)
Trinidad & Tobago
1995-2006
t-bill -1.248 -5.134** -1.019 -5.147** 0.607* 0.146 I(1)
1-Per. Inflation -4.453** NA -4.470** NA 0.422 NA I(0)
US 1975-1989
t-bill -1.634 -6.989** -1.750 -6.705** 0.179 NA I(1)
US 1993-2006
t-bill -2.062 -3.485** -1.622 -3.656** 0.414 NA I(1)
US 1975-1991
t-bill -1.583 -7.355** -1.728 -7.079** 0.181 NA I(1)
US 1995-2006
t-bill -1.852 -3.119** -1.381 3.171** 0.564* 0.144 I(1)
Table 4: Johansen Cointegration Tests
Trace Test Maximum Eigenvalue Test
Bahamas 1975(1)-2006(2)
Null; Alternative Statistic Null; Alternative Statistic
r = 0; r > 0 45.085** r = 0; r = 1 23.371**
r < 1; r > 1 7.714 r = 1; r = 2 8.849
Cointegrating Vectors: LR Test of restriction [1, -1] on : 2.344
Speed of adjustment: -0.20**
Trinidad and Tobago1975(1)-2006(2)
Null; Alternative Statistic Null; Alternative Statistic
r = 0; r > 0 46.945** r = 0; r = 1 38.109**
r < 1; r > 1 8.836 r = 1; r = 2 7.013
Cointegrating Vector: LR Test of restriction [1, -1] on : 29.339**
LR Test of restriction [1, -1] on : 16.136** Speed of Adjustment: -0.091**
Jamaica1993(1)-2006(2)
Null; Alternative Statistic Null; Alternative Statistic
r = 0; r > 0 32.472** r = 0; r = 1 22.780*
r < 1; r > 1 9.691 r = 1; r = 2 9.089
Cointegrating Vector: LR Test of restriction [1, -1] on :12.748**
LR Test of restriction [1, -1] on : 9.711** Speed of Adjustment: -0.269**
Notes: r denotes the number of cointegrating vectors. Critical values for the Trace and Max tests are obtained from
MacKinnon, Haug and Michelis (1999). The LR tests are distributed and are conducted under the 0.717US**
t t
i = i itUS
1
7.534 ** 1.182US**
t t t
i p i
+ =- + 1 t p + US t i 1
4.472 ** 2.463US**
t t t
i p i
+
= + pt+1
Table 5: Granger-Causality Tests 1975(1)-2006(2)
Country Null Hypothesis Test Statistic Conclusion
The Bahamas does not Granger-cause 3.737* Granger-causes
does not Granger-cause 0.776 does not Granger-cause
Barbados does not Granger-cause 1.871 does not Granger-causes
does not Granger-cause 1.074 does not Granger-cause
Jamaica does not Granger-cause 0.217 does not Granger-cause
does not Granger-cause 2.744* Granger-causes
Trinidad and
Tobago does not Granger-cause
1.082 does not Granger-cause
does not Granger-cause 0.104 does not Granger-cause
Guyana does not Granger-cause 1.156 does not Granger-cause
does not Granger-cause 1.376 does not Granger-cause
Notes: The statistic reported is the F-statistic for up to 4 lags of each variable. ** denotes significance at 1% and *
denotes significance at 5%. US
t
i
D Dit
US t
i
D Dit
1 t p + D t i
D Dpt+1 Dit
US t
i
D it
US t
i
D it
1
t
p
+ it pt+1 it
US t
i
D Dit
US t
i
D Dit
1
t
p
+ Dit pt+1 Dit
US t
i
D Dit
US t
i
D Dit
1 t p + D t i
D Dpt+1 Dit
US t
i
D Dit
US t
i
D Dit
1
t
p
Table 6: Granger-Causality Tests of Sub-samples for Jamaica and Trinidad and Tobago
Country Null Hypothesis Test Statistic Conclusion
Jamaica
Pegged Rate
(1975-1989) does not Granger-cause
0.232 does not Granger-cause
does not Granger-cause 0.715 does not Granger-cause
Floating Rate
(1993-2006) does not Granger-cause
0.460 does not Granger-cause
does not Granger-cause 1.134 does not Granger-cause
Trinidad and Tobago Pegged Rate
(1975-1991) does not Granger-cause
0.255 does not Granger-cause
does not Granger-cause 1.180 does not Granger-cause
Floating Rate
(1995-2006) does not Granger-cause
3.511* Granger-causes
does not Granger-cause 1.321 does not Granger-cause
Notes: See note to Table 6.
US t
i
D Dit
US t
i
D Dit
1
t
p
+ Dit pt+1 Dit
US t
i
D Dit
US t
i
D Dit
1 t p + D t i
D Dpt+1 Dit
US t
i
D Dit
US t
i
D Dit
1
t
p
+ Dit pt+1 Dit
US t
i
D Dit
US t
i
D Dit
1
t
p
Figure 1: Plots of Real Interest Rate -2 0 2 4 6 8 10 12 14
1975 1980 1985 1990 1995 2000 2005 THE BAHAMAS real interes t rate
-2 0 2 4 6 8 10
1975 1980 1985 1990 1995 2000 2005 BARBADOS real interes t rate
-20 -10 0 10 20 30 40 50
1975 1980 1985 1990 1995 2000 2005 JAMAICA real interest rate
JAMAICA change in real interest rate
-8 -4 0 4 8 12 16
1975 1980 1985 1990 1995 2000 2005 TRINIDAD AND TOBAGO real interest rate
TRINIDAD AND TOBAGO change in real interest rate
-8 -4 0 4 8 12 16 20
94 95 96 97 98 99 00 01 02 03 04 05 GUYANA real interest rate
Figure 2: Plots of Nominal Interest Rate, Inflation Rate and US Nominal Interest Rate -4 0 4 8 12 16
1975 1980 1985 1990 1995 2000 2005 TBILL
1-Per. Inflation Rate USTBILL -4 0 4 8 12 16
1975 1980 1985 1990 1995 2000 2005 TBILL
Ann. Inflation Rate USTBILL BAHAMAS -8 -4 0 4 8 12 16
1975 1980 1985 1990 1995 2000 2005
TBILL
1-per. Inflation Rate USTBILL -20 -10 0 10 20 30
1975 1980 1985 1990 1995 2000 2005
TBILL
Ann. Inflation Rate USTBILL BARBADOS -10 0 10 20 30 40 50
1975 1980 1985 1990 1995 2000 2005
TBILL
1-Per. Inflation Rate USTBILL -20 0 20 40 60 80 100
1975 1980 1985 1990 1995 2000 2005
TBILL
Figure 2: Plots of Nominal Interest Rate, Inflation Rate and US Nominal Interest Rate
Notes: TBILL stands for treasury bill rate of the relevant Caribbean country. 1-Per. inflation rate stands for one-period
(quarterly) rate of inflation. Ann. inflation rate stands for the annualised (yearly) inflation rate. USTBILL
-4 0 4 8 12 16
1975 1980 1985 1990 1995 2000 2005
TBILL
1-Per. Inflation Rate USTBILL -5 0 5 10 15 20 25 30
1975 1980 1985 1990 1995 2000 2005
TBILL
Ann. Inflation Rate USTBILL
TRINIDAD AND TOBAGO
-4 0 4 8 12 16 20
1994 1996 1998 2000 2002 2004 2006
TBILL
1-Per. Inflation Rate USTBILL -5 0 5 10 15 20 25 30
1994 1996 1998 2000 2002 2004 2006
TBILL
Ann. Inflation Rate USTBILL