Published Online February 2014 in SciRes (http://www.scirp.org/journal/ce) http://dx.doi.org/10.4236/ce.2014.52012
Evaluation of Distance Education through Blended Learning:
Comparisons and Important Factors for the Learning Process
Júlio C. G. Bertolin
1, Ana Carolina Bertoletti De Marchi
21
Graduate Program in Education, University of Passo Fundo, Passo Fundo, Brazil
2Graduate Program in Applied Computing, University of Passo Fundo, Passo Fundo, Brazil
Email: [email protected], [email protected]
Received December 6th, 2013; revised January 6th, 2014; accepted January 13th, 2014
Copyright © 2014 Júlio C. G. Bertolin, Ana Carolina Bertoletti De Marchi. This is an open access article distri-buted under the Creative Commons Attribution License, which permits unrestricted use, distribution, and repro-duction in any medium, provided the original work is properly cited. In accordance of the Creative Commons Attribution License all Copyrights © 2014 are reserved for SCIRP and the owner of the intellectual property Júlio C. G. Bertolin, Ana Carolina Bertoletti De Marchi. All Copyright © 2014 are guarded by law and by SCIRP as a guardian.
Evaluation is a complex issue with significant importance for the qualification of institutions and college education programs. In distance education, quality assessment is even more complex and important as the differences in space and time between professors and students have an impact on the learning process. A blended learning environment is one that combines distance education and face-to-face classroom instruc-tion, and whose courses are an ideal environment for comparison with the conventional method. In this respect, this paper conducts an evaluation of blended learning through which students assess some aspects related to the development of courses and to the learning outcomes. The evaluation revealed that, in gen-eral, students considered that the face-to-face classroom contact facilitated learning and that the profes-sor’s planning and commitment are key factors in distance education.
Keywords: Distance Education; E-Learning; Evaluation Methodologies
Introduction
Evaluation is a complex and significantly important issue concerning quality assessment tools and projects in institutions and college education programs. Different approaches have been used to assess higher education and quality of education, and distinct conceptions and forms for evaluating education have been employed. In the past two decades, the assessment of higher education has been a matter for vigorous debate, with the participation of professionals and researchers from different areas of knowledge. However, in the context of distance educa- tion, studies and works on assessment are still in the process of being developed. In distance education, quality assessment is more complex and more important as the differences in space and time between professors and students have an impact on the learning process.
While some authors and professors call into question whether the quality of distance education is good and whether students can effectively learn from this method, some studies have shown that the quality of this type of education can be as good as or better than face-to-face classroom education. At the same time, distance education has greatly expanded worldwide, both in developed and developing countries.
For instance, in Brazil, the number of distance education students accounted for only 1% of the total of undergraduate programs in 2004, whereas in 2010, nearly 1 million students represented 15% of the whole system. In this period, the growth of distance education averaged 65% p.a. compared to only 5% of face-to-face education in Brazilian higher education pro-
grams. In the United States, studies demonstrate that 3.5 mil- lion students attended distance education programs in higher education institutions in 2006. From 2004 to 2009, there was an average increase of 13% p.a. in the number of enrollments in distance education in the US compared to an average growth of approximately 2% in the whole system.
Another option between distance education and face-to-face classroom instruction is blended learning, which combines both methods. The Brazilian Ministry of Education, for example, allows up to 20% of the total hours in a face-to-face classroom environment to be taught in the distance education mode. Within the scope of a course, education is allowed to take place fully or partially in the distance mode, but tests must be taken in a face-to-face environment. Thus, a course under the blended education mode, despite the predominance of face-to-face in-struction, is significantly flexible in terms of time and space during the learning process. Such flexibility provides a unique environment for the investigation of distance education quality as the same group of students in the same course, taught by the same professor, is submitted to both methods: distance educa-tion and conveneduca-tional face-to-face educaeduca-tion. Consequently, the assessment of distance education quality in the blended educa-tion mode is an ideal environment for comparison with the face-to-face classroom method, both in terms of learning process and course outcomes.
addition to factors that were relevant for the development of distance education. The theoretical and methodological back- ground drew upon the concept of quality in education repre- sented by a set of indicators based on the General Systems Theory (Estrada, 1999) which involve aspects of the learning process and of the assessed educational object.
Evaluation Method and Tool
Given the expansion of and debate on school efficiency, performance or learning of students, several research studies on distance education quality have been undertaken. Among the approaches used to assess this type of education, we have the following: 1) comparison of distance education with face-to- face classroom instruction using predefined quality indicators; 2) the use of tools to identify users’ perceptions through their answers to questionnaires or devices that store and analyze the duration and frequency of login or accessed pages; 3) the comparison with an ideal hypothetical system that contains a set of relevant requirements and functions; and 4) the use of indicators to assess the online learning platform or environment (Valcheva & Todorova, 2005).
In order to assess distance education through the blended ap-proach, the present study drew upon the concept of quality in education represented by a set of indicators based on the Gen-eral Systems Theory that involve input, process and outcome aspects and/or indicators of the assessed educational object. According to Estrada (1999), quality of education assessment is expressed by a value judgment about a set of attributes related to “inputs”, “process” and “outcomes”, or about the relation-ships between them. UNESCO’s Laboratorio Latinoamericano de Evaluación de la Calidad de la Educación also mentions systemic indicators, stating that “the level of quality in educa-tion consists basically of the definieduca-tion of a set of variables that systematically provides a reliable and valid panorama of educa-tional systems that can be used to guide and implement im-provement strategies” (UNESCO, 1997).
According to García (2000), the systems of indicators seek to go beyond the mere sum of data by grouping simple or compo-site indicators as a function of factors and aspects that render them meaningful and provide a significant insight into the sta-tus of educational systems. Experiences with the assessment of indicator systems demonstrate that quality in education is a multiple concept that cannot be evaluated by a single aspect and that should include all the key elements of the system or process. Therefore, we may say that it is possible to assess the quality of education by a value judgment based on a set of attributes, aspects or indicators concerning inputs, process and educational outcomes, or the relationships between them.
Hence, in view of the goals of the evaluation study, we as-sumed that the quality assessment of courses in the blended education model is closely related to the analysis of perfor-mance of a set of input, process and outcome indicators. More specifically, to compare students’ learning between the face-to- face and distance education models, we used three questions about this aspect, as proposed by Bertolin & De Marchi (2010) as evaluation tool for courses in a blended education environ-ment based on systemic indicators (Table 1). Likewise, ques-tions on the process of the same tool were compared with those about learning outcomes in order to identify more relevant fac-tors and improve students’ learning in distance education.
[image:2.595.307.539.109.524.2]The questionnaires were applied to students of 46 courses
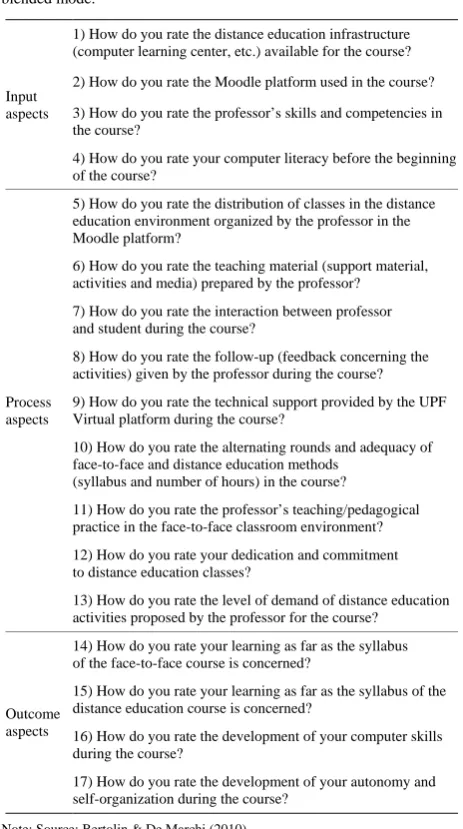
Table 1.
Questions on input, process and outcomes of courses taught in the blended mode.
Input aspects
1) How do you rate the distance education infrastructure (computer learning center, etc.) available for the course?
2) How do you rate the Moodle platform used in the course?
3) How do you rate the professor’s skills and competencies in the course?
4) How do you rate your computer literacy before the beginning of the course?
Process aspects
5) How do you rate the distribution of classes in the distance education environment organized by the professor in the Moodle platform?
6) How do you rate the teaching material (support material, activities and media) prepared by the professor?
7) How do you rate the interaction between professor and student during the course?
8) How do you rate the follow-up (feedback concerning the activities) given by the professor during the course?
9) How do you rate the technical support provided by the UPF Virtual platform during the course?
10) How do you rate the alternating rounds and adequacy of face-to-face and distance education methods
(syllabus and number of hours) in the course?
11) How do you rate the professor’s teaching/pedagogical practice in the face-to-face classroom environment?
12) How do you rate your dedication and commitment to distance education classes?
13) How do you rate the level of demand of distance education activities proposed by the professor for the course?
Outcome aspects
14) How do you rate your learning as far as the syllabus of the face-to-face course is concerned?
15) How do you rate your learning as far as the syllabus of the distance education course is concerned?
16) How do you rate the development of your computer skills during the course?
17) How do you rate the development of your autonomy and self-organization during the course?
Note: Source: Bertolin & De Marchi (2010).
taught in the blended education environment during the second half of year 2011 at a nonprofit university located in southern Brazil. A total of 618 students from different undergraduate programs answered the questionnaire. Class hours accounted for 20%, 50% and 80% of 358, 137 and 123 evaluated courses, respectively. In each question, the students had to check one of the following options: “very poor” (value 1); “poor” (value 2); “fair” (value 3); “good” (value 4); and “excellent” (value 5).
For the comparison of learning between face-to-face and distance education, we performed some calculations: 1) for the total amount of students taking up courses in the blended mode who considered learning in the face-to-face environment to be better than, equal to or worse than distance education; and 2) for the arithmetic means of the 47 courses in the blended me-thod, which refer to students’ perception about learning in the face-to-face and distance education environments (questions 14 and 15).
environment (3), we compared the low means obtained for 11 courses with 50% of classes in the distance mode and 50% of them in the face-to-face mode in the questions on input and process (questions 1 through 13) and the most significant dif-ferences between the means obtained for face-to-face and dis-tance education (question 14 subtracted from question 15).
Calculations and Analyses
The blended learning approach provides a unique environ-ment for the investigation of distance education quality as the same group of students in the same course, taught by the same professor, is submitted to both methods: distance education and conventional face-to-face education.
In the comparison of respondents’ perception about learning in both environments, most answered that learning was better in the face-to-face environment. While 84% of students found face-to-face education to be better than distance education, only 4% thought it was the other way around. Slightly over 10% of 618 respondents considered face-to-face and distance education to be equivalent in terms of quality (Table 2).
More specifically in the course with only 20% of hours in the distance mode, none of the 358 students found distance educa-tion to be better than face-to-face educaeduca-tion. In those courses in which half of the classes were taught in a face-to-face class-room environment and the remaining half given in the distance mode, i.e., when we probably had the best condition for com-parison between the methods, 94% of the students considered face-to-face education to be better.
With respect to the 47 courses taught in the blended method, only three (6%) indicated that learning in the distance mode was better than in the face-to-face environment. In another six courses (13%), the learning quality of face-to-face and distance education was equivalent. In the remaining 38 courses, learning in the face-to-face environment was found to be better. There-fore, it is beyond doubt that most students who took the same course, taught by the same professor, within the same term, under the blended approach, considered face-to-face education to be better than distance education.
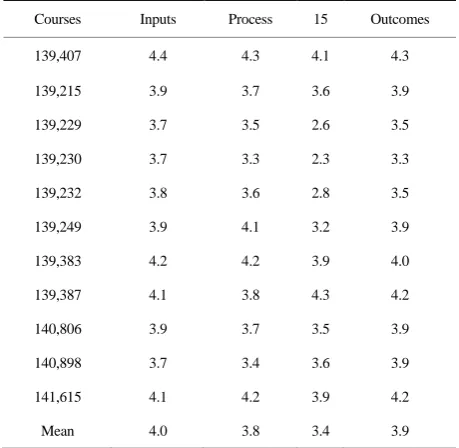
[image:3.595.308.538.500.724.2]According to the logic of indicators based on the General Systems Theory, good inputs and good processes yield good results. Likewise, poor inputs and poor processes yield poor results. As to the courses taken in the blended mode, the mean results (overall means of 3.9) were consistent with those of the inputs (overall means of 4.0) and of the processes (overall means of 3.8).
Table 2.
Comparison of students’ perception about learning in the face-to-face and distance education environments–expressed in numbers and per-centage.
20% DE %
50% DE %
80%
DE % Total %
FFE better
than DE 316 88 129 94 75 61 520 84
DE as good
as FFE 42 12 3 2 28 23 73 12
DE better
than FFE 0 0 5 4 20 16 25 4
Note: Source: Data collected by the authors. FFE = face-to-face education; DE = distance education.
In general, the assessments of input aspects (infrastructure, virtual learning environment, professors’ and students’ skills) and of processes (planning of dynamics, interaction, support, alternation, etc.) were similar to those of the outcomes (learning and skill development). However, the means for question 15 was not always consistent with the assessment of inputs and processes (Table 3). More specifically, the statistical signific-ance of courses 139229, 139230 and 139232 was below the mean obtained for the distance education environment. Thus, the comparison of the means obtained for the questions on in-put and process with the largest differences between the means for the questions in the distance and face-to-face education helped determine the most influential aspects that hinder dis-tance education.
By subtracting the means obtained by the courses taught in the face-to-face mode by the means of those in the distance mode, courses 139229 and 139230 yielded significantly differ-ent results (Table 4). These courses showed much poorer learning rates in the distance mode than in the face-to-face en-vironment. Hence, a more accurate analysis of inputs and processes of these two courses can indicate aspects that have a negative impact on learning in the distance education environ-ment.
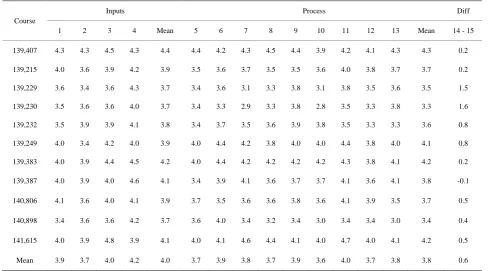
In a more careful interpretation of the assessment of these two courses with the worst results for distance education, we can initially perceive that no question in the input domain was assessed in a significantly different fashion from the mean of all courses (Table 5). However, the questions on professors’ teaching planning and commitment, in the process domain, yielded significantly lower means in courses 139,229 and 139,230 than the overall means of all courses.
This way, the teaching material prepared by the professor (question 6), the interaction between professor and student (question 7) and the alternating rounds and adequacy between face-to-face and distance education (question 10) were more
Table 3.
Means of input, process and outcome aspects of courses in the blended learning environment.
Courses Inputs Process 15 Outcomes
139,407 4.4 4.3 4.1 4.3
139,215 3.9 3.7 3.6 3.9
139,229 3.7 3.5 2.6 3.5
139,230 3.7 3.3 2.3 3.3
139,232 3.8 3.6 2.8 3.5
139,249 3.9 4.1 3.2 3.9
139,383 4.2 4.2 3.9 4.0
139,387 4.1 3.8 4.3 4.2
140,806 3.9 3.7 3.5 3.9
140,898 3.7 3.4 3.6 3.9
141,615 4.1 4.2 3.9 4.2
Mean 4.0 3.8 3.4 3.9
[image:3.595.60.284.624.716.2]relevant for distance education in the assessment of the courses taught in the blended mode.
Table 4.
Differences in learning in the face-to-face and distance education courses taught in the blended mode (50% DE and 50% FFE).
Course Question 14 Question 15 Difference
139,407 4.3 4.1 0.2
139,215 3.8 3.6 0.2
139,229 4.1 2.6 1.5
139,230 3.8 2.3 1.6
139,232 3.7 2.8 0.8
139,249 4.0 3.2 0.8
139,383 4.1 3.9 0.2
139,387 4.1 4.3 −0.1
140,806 4.1 3.5 0.5
140,898 4.0 3.6 0.4
141,615 4.4 3.9 0.5
Mean 4.0 3.4 0.6
Note: DE = distance education; FFE = face-to-face education.
Conclusion
The courses in the blended mode corroborate the unique en-vironment for the investigation into distance education quality given that the same group of students attending the same course taught by the same professor is submitted to alternating rounds of distance and face-to-face education. Consequently, the as-sessment of distance education quality in the blended mode is ideal for comparisons with the conventional method, both in terms of process and outcomes.
The assessment carried out here compared the perception of more than 600 students in almost 50 courses taught in the blended mode. This procedure demonstrated that, by and large, students find it easier to learn in a face-to-face environment. Nonetheless, in some courses, the difference in perception about learning between the face-to-face and distance education methods was very large, calling into question some factors that could be related to learning difficulties in the distance educa-tion mode.
By investigating the factors in the input and process domains that had a greater impact on the comparison of students’ learn-ing in the different teachlearn-ing methods, our assessment showed that the questions on professors’ planning and commitment, in the process domain, are relevant for learning in the distance education environment. The negative assessment of the teach-ing material prepared by the professor, of the interaction be-tween professor and student and of the alternating rounds and adequacy of face-to-face and distance education methods, re-vealed that these process aspects had a negative impact on dis-tance education.
[image:4.595.55.544.454.725.2]Therefore, it is plausible to say that, in the context of distance education, a well-planned course and an appropriate
Table 5.
Assessment of questions on input and process in the blended mode (50% DE and 50% FFE).
Course
Inputs Process Diff
1 2 3 4 Mean 5 6 7 8 9 10 11 12 13 Mean 14 - 15
139,407 4.3 4.3 4.5 4.3 4.4 4.4 4.2 4.3 4.5 4.4 3.9 4.2 4.1 4.3 4.3 0.2
139,215 4.0 3.6 3.9 4.2 3.9 3.5 3.6 3.7 3.5 3.5 3.6 4.0 3.8 3.7 3.7 0.2
139,229 3.6 3.4 3.6 4.3 3.7 3.4 3.6 3.1 3.3 3.8 3.1 3.8 3.5 3.6 3.5 1.5
139,230 3.5 3.6 3.6 4.0 3.7 3.4 3.3 2.9 3.3 3.8 2.8 3.5 3.3 3.8 3.3 1.6
139,232 3.5 3.9 3.9 4.1 3.8 3.4 3.7 3.5 3.6 3.9 3.8 3.5 3.3 3.3 3.6 0.8
139,249 4.0 3.4 4.2 4.0 3.9 4.0 4.4 4.2 3.8 4.0 4.0 4.4 3.8 4.0 4.1 0.8
139,383 4.0 3.9 4.4 4.5 4.2 4.0 4.4 4.2 4.2 4.2 4.2 4.3 3.8 4.1 4.2 0.2
139,387 4.0 3.9 4.0 4.6 4.1 3.4 3.9 4.1 3.6 3.7 3.7 4.1 3.6 4.1 3.8 -0.1
140,806 4.1 3.6 4.0 4.1 3.9 3.7 3.5 3.6 3.6 3.8 3.6 4.1 3.9 3.5 3.7 0.5
140,898 3.4 3.6 3.6 4.2 3.7 3.6 4.0 3.4 3.2 3.4 3.0 3.4 3.4 3.0 3.4 0.4
141,615 4.0 3.9 4.8 3.9 4.1 4.0 4.1 4.6 4.4 4.1 4.0 4.7 4.0 4.1 4.2 0.5
Mean 3.9 3.7 4.0 4.2 4.0 3.7 3.9 3.8 3.7 3.9 3.6 4.0 3.7 3.8 3.8 0.6
professor-student interaction are relevant factors for the im-provement of students’ learning.
REFERENCES
Bertolin, J. C. G., & De Marchi, A. C. B. (2010). Instrumentos para avaliar disciplinas da modalidade semipresencial: Uma proposta ba-seada em sistemas de indicadores. Avaliação (UNICAMP), 15, 1-10. Estrada, L. R. G. (1999). Hacia un modelo de evaluación de la calidad de instituciones de educación superior. Revista Iberoamericana de Educación, 21, 93-103.
García, M. G. (2000). Evaluación y calidad de los sistemas educativos. In: T. G. Ramírez (Ed.), Evaluación y gestión de la calidad educativa (pp. 227-268). Málaga: Ediciones Aljibe.
United Nations Educational, Scientific and Cultural Organization (UNESCO) (1997). Marco conceptual. Documentos—Laboratorio Latinoamericano de Evaluación de la calidad de la educación. San-tiago de Chile: Orealc.