The effect of tooth geometry on power hacksaw blade
performance.
HALES, William M. M.
Available from Sheffield Hallam University Research Archive (SHURA) at: http://shura.shu.ac.uk/19742/
This document is the author deposited version. You are advised to consult the publisher's version if you wish to cite from it.
Published version
HALES, William M. M. (1986). The effect of tooth geometry on power hacksaw blade performance. Doctoral, Sheffield Hallam University (United Kingdom)..
Copyright and re-use policy
See http://shura.shu.ac.uk/information.html
Sheffield Hallam University Research Archive
101 039 701 X
iiiiiiiiini
TELEPEN
Sheffield City Polytechnic Library
REFERENCE ONLY
Return to Learning Centre of issue
Fines are charged at 50p per hour
ProQuest Number: 10697044
All rights reserved
INFORMATION TO ALL USERS
The quality of this reproduction is dependent upon the quality of the copy submitted.
In the unlikely event that the author did not send a com plete manuscript and there are missing pages, these will be noted. Also, if material had to be removed,
a note will indicate the deletion.
uest
ProQuest 10697044
Published by ProQuest LLC(2017). Copyright of the Dissertation is held by the Author.
All rights reserved.
This work is protected against unauthorized copying under Title 17, United States C ode Microform Edition © ProQuest LLC.
ProQuest LLC.
789 East Eisenhower Parkway P.O. Box 1346
THE EFFECT OF TOOTH GEOMETRY
on
POWER H A C K S A W BLADE PERF O R M A N C E
by
William M a l c o l m M a n s o n Hales BSc
A Thesis submitted to the Council for National Academic Awards in partial fulfilment of the requirements for the degree of Doctor of Philosophy.
Sponsoring Establishment Department of Mechanical and
Production Engineering Sheffield City Polytechnic
Collaborating Establishment James Neill Limited
Handsworth, Sheffield
DECLARATION
I declare that, while registered as a candidate for the Council's research degree, I have not been a registered candidate or enrolled student for another award of the CNAA or other academic or professional institution.
Signed:
ABSTRACT
The effect of tooth geometry on hacksaw blade performance.
Author: W M M Hales
Published work concerning the influence of tooth geometry on hacksaw blade performance has been reviewed.
By testing standard and modified hacksaw blades the author has shown that, contrary to previous belief, pitch is not a parameter which affects blade performance. Furthermore experimental evidence is presented to show that gullet size and shape significantly affect blade performance. The author proposes that restriction of chip flow by the gullet causes very inefficient metal removal. This is supported by examination of hacksaw chips, and a
theoretical model has been developed to show how rapidly cutting forces increase when the chip is restricted from flowing.
Two testing procedures have been developed to examine chip formation in the gullet. The first procedure employs
video equipment to show chip formation and cutting forces simultaneously on one VDU, during cutting with single hacksaw teeth. This test is of limited use due to the slow cutting speeds employed. The second procedure, also using single teeth but cutting at realistic speeds, was capable of testing any tooth/gullet geometry cutting any material. The test results confirmed that restriction of
chip flow by the gullet produces inefficient cutting. It has been shown that a particular tooth/gullet geometry can only cut efficiently over a limited range of feeds and workpiece lengths.
The author has developed a method for accurately predicting sawing rates from the single tooth data gathered.
ACKNOWLEDGEMENTS
The author is particularly grateful to his supervisors. Professor D S Dugdale and Dr M Sarwar for their guidance and encouragement.
Many thanks are also due to Dr B Worthington, Dr S Hashmi and Dr D Gillibrand for their constructive and pertinent criticism and advice.
The continual and willing assistance of all the laboratory technicians has been gratefully received. In particular the author wishes to thank Mr S J Leigh, Mr R C Wainwright, Mr T J O’Hara, Mr R C Wilkinson, Mr M Jackson and
Mr J Taylor.
The author wishes to thank the members of the Product Development Department, Eclipse Tools Limited, for their advice and generous supply of blades and materials.
Special thanks go to Mr K Pascoe, Mr A Fleming and Mr P Wilkinson.
CONTENTS
Page
DECLARATION (i)
ACKNOWLEDGEMENTS (i i)
ABSTRACT (iii)
1 CHAPTER ONE - Introduction 1
1.1 Hacksaw Machines 3
1.2 Power Hacksaw Blades 4
1.2.1 Power hacksaw blade nomenclature 6
1.2.2 BS 1919 8
1.3 Blade Performance Assessment Methods 8
1.3.1 A blade manufacturer's testing
procedure 8
1.3.2 The BS1919 performance test 10
1.3.3 The performance test developed by
Sarwar and Thompson 11
1.4 Tooth Geometry 14
1.4.1 Rake angle and cutting edge radius 15
1.4.2 Set 18
1.4.3 Clearance angle 20
1.4.4 Tooth pitch 20
1.4.5 Gullet 21
1.5 Blade Wear 21
2 CHAPTER TWO - Blade Performance Tests 24
2.1 Performance Tests on Modified Blades to
Determine the Effect of Pitch 25
2.1.1 Discussion of results 26
2.2 Performance Tests on Modified Blades to
Determine the Effect of Gullet Size 27
2.3 Hacksaw Chip Formation 28
2.3.1 Chip formation affected by the
Page 3 CHAPTER THREE - Single Tooth & Gullet Tests at
Slow Cutting Speeds 31
3.1 Test Objectives 31
3.2 Testing & Instrumentation 31
3.3 Cutting Conditions & Tests 35
3.4 Discussion of Results 36
3.4.1 Relevance of results to hacksawing 39
3.4.2 Comparison of 4, 6 & 10 TPI teeth 40
3.4.3 Effects of slow cutting speed 40
3.4.4 Examinations of video films 43
4 CHAPTER FOUR - Single Tooth & Gullet Tests at
Higher Cutting Speeds 44
4.1 The Test Rig 44
4.2 The Testing Procedure 47
4.3 Measurement of Undeformed Chip Thickness 4 8
4.4 Data Handling 49
4.5 Tests Carried out at Higher Cutting Speeds 50
4.5.1 Tools 50
4.5.2 Workpiece materials 50
4.6 The Improvements Caused by Testing at
Higher Cutting Speeds 51
4.7 Cutting Performance of Single Tooth Tools 52
4.8 Results & Discussion 53
4.8.1 Restriction of chip flow by the
gullet 53
4.8.1.1 Aluminium workpieces 53
4.8.1.2 Mild steel workpieces 54
4.8.1.3 Stainless steel workpieces 56
4.8.2 The effect of length of workpiece
on cutting performance 56
4.8.3 The effect of gullet size on
performance 57
Page
5 CHAPTER FIVE - Theoretical Model of Inefficient Chip Formation by Restriction in
Tooth Gullet 60
5.1 The Model 60
5.2 Estimation of Shear Stress (k) 64
5.2.1 Estimation of shear stress using
cutting thrust force data 64
5.2.2 Estimation of shear stress from
hardness test 65
5.2.3 Estimation of shear stress from
compression tests 66
5.3 The Correlation Between the Model and the
Empirical Data 66
5.3.1 Chip shape 66
5.3.2 Cutting force 67
6 CHAPTER SIX - Prediction of Sawing Time from
Single Tooth & Gullet Data 6 8
6.1 Theory _ 68
6.2 Predicted Hacksawing Rates 70
6.3 Undeformed Chip Thickness in Hacksawing 72
7 CHAPTER SEVEN - The Effect of Tooth & Gullet Geometry on the Performance of
Hacksaw Blades 73
7.1 Improving Tooth/Gullet Performance by
Altering the Nominal Rake Angle 74
7.2 Improving Tooth/Gullet Performance by Reducing the Restriction to Chip Flow
Imposed by the Gullet 77
Page
8 CHAPTER EIGHT - Conclusions and Further Work
(Introduction) 81
8.1 Conclusions 82
8.2 Suggestions for Further Work 85
8.2.1 Power hacksaw blades 85
8.2.2 Wear tests 85
8.2.3 Chip breaking 86
8.2.4 Removal of chips from the gullet
and saw slot. 86
REFERENCES 87
BIBLIOGRAPHY 89
FIGURES
APPENDIX 1 A. 1
APPENDIX 2 A.4
APPENDIX 3 A.6
APPENDIX 4 A.20
LIST OF FIGURES FIGURE 1.1 1.2 1.3 1.4 1.5 1.6 1.7 1.8 f' 1.9 1.10 2.1 2.2 2.3 2.4 2.5 2.6 2.7 CAPTION
A blade manufacturer's performance criterion. BS 1919. Test conditions and acceptance limits for power hacksaw blades.
Two different tooth and gullet geometries. Models of chip formation at various rake angles.
Cutting geometry of a hacksaw blade tooth. Diagram of effective rake angle, 0, when the cutting edge radius is large compared to undeformed chip thickness.
Soderberg's model showing variations in
undeformed chip thickness along the edge for an averaged feed per tooth of 50 um.
Experimental data presented by Sarwar and Thompson.
Thompson and Taylor's wear model for hacksaw teeth.
Soderberg's wear model for hacksaw teeth cutting; (a) a quenched & tempered carbon steel, and (b) an austenitic stainless steel.
Experimental data presented by Sarwar and
Thompson showing the effect of workpiece width on cutting performance.
Performance curves of blades.
Performance of blades as workpiece width increases.
FIGURE 2.9a-b 2.9c-d 2. 9e-f 3.1 3.2 3.3 3.4 3.5 3.6 3.7a 3.7b 3.8 3.9 3.10 3.11 3.12 3.13 3.14a 3.14b 3.15a CAPTION
Hacksaw chips cut by a 10 TPI blade. Hacksaw chips cut by a 6 TPI blade. Hacksaw chips cut by a 4 TPI blade.
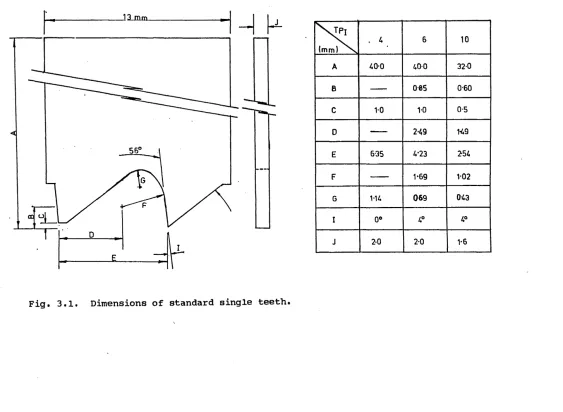
Dimensions of standard single teeth.
Tool holder for individual hacksaw teeth. Close-up of bridge and DTI arrangement, for measurement of undeformed chip thickness. Original design for single tooth and gullet test.
6 TPI cutting and thrust force traces for 0.043 mm undeformed chip thickness.
Third design of single tooth and gullet test. Equipment used for method three of the
simulation test.
Close-up of the workpiece, reference plate force platform and flat plate.
10 TPI tooth as new and with modified gullet. Maximum cutting force versus undeformed chip thickness.
Cutting force traces relating to points A and B on Figure 3.9.
Cutting force traces relating to points C and D on Figure 3.9.
Sketches of stages of chip formation in a 10 TPI gullet, cutting mild steel at 95 mm/min. Average specific cutting energy versus
undeformed chip thickness for a 10 TPI tooth. Cutting force trace of 10 TPI tooth cutting mild steel. 50 mm long.
Chip formation in 10 TPI gullet.
FIGURE 3.15b 3.16
3.17
3.18
3.19
3.20
4.1
4.2
4.3
4.4
4.5a
4. 5b
4.6
CAPTION
Chip formation in a 10 TPI gullet.
4, 6 and 10 TPI tooth and gullet cutting 50 mm mild steel workpiece.
Surface finish traces of: (a) a saw slot bed, and (b) a slot bed
produced by a 4 TPI tooth cutting at 95 mm/min. SEM photograph of a chip cut by a single
standard 4 TPI hacksaw tooth at 95 mm/min. Chips produced cutting mild steel with single hacksaw teeth at 95 mm/min.
Diagram of ”non-built-up-edge" chip formation at low speeds, as described by Chandiramani and Cook (12) .
The screw cutting lathe used in the single tooth tests at realistic cutting speeds. The holder for the single hacksaw teeth in Figure 3.1.
Workpiece holder for single tooth tests at realistic cutting speeds.
Workpiece dimensions for single tooth tests at realistic cutting speeds.
The instrumentation used for the single tooth tests at realistic cutting speeds.
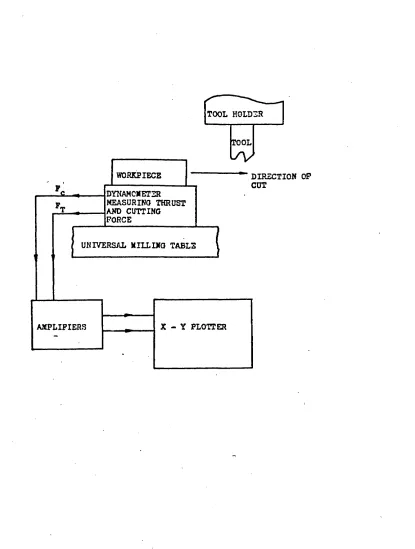
Diagramatic layout of the instrumentation used for the single tooth tests at realistic cutting speeds.
FIGURE 4.7
4.8
4.9
4.10
4.11
4.12
4.13
4.14
4.15
4.16
CAPTION
The performance of a 4 TPI tooth cutting aluminium:
(a) showing thrust force/unit width of tooth versus undeformed chip thickness, and (b) showing specific thrust pressure versus
undeformed chip thickness.
The performance of a 4 TPI tooth cutting
aluminium, and the performance of a 6 TPI tooth cutting aluminium.
Length of cut 50 mm.
The performance of a 4 TPI tooth cutting aluminium at three different lengths of cut. Some mild steel chips produced by single hacksaw teeth cutting at a realistic speed. Cutting and thrust force traces for a standard
4 TPI tooth cutting 25 mm of mild steel. Undeformed chip thickness 0.071 mm.
Typical surface finish of the slot bed caused by a .4 TPI tooth cutting 50 mm mild steel at 30 m/min.
Performance of a standard 4 TPI tooth cutting aluminium. Length of cut 75 mm. Cutting speed 30 m/min.
Thrust force traces for points X, Y and Z in Figure 4.13.
Chips relating to points X, Y and Z in Figure 4.13.
Graph showing, for a standard 4 TPI tooth cutting aluminium:
(a) the average performance over each cut; (b) the instantaneous maximum specific thrust
pressure, and
FIGURE 4.17
4.18
4.19
4.20
4.21
4.22
4.23
4.24 4.25a-c
4.26a-c
4.27a-c
CAPTION
Aluminium chips cut by:
(a) a standard 4 TPI tooth, and (b) a standard 10 TPI tooth Undeformed thickness:
(a) 0.04 mm (b) 0. 03 9 mm Length of cut:
(a) 75 mm (b) 12 mm
Graph showing the length of cut at which chip flow was first restricted in standard 4, 6 and 10 TPI teeth cutting aluminium at 30 m/min. Graph showing the data in Figure 4.18
normalised by the height of the gullet. The performance of a standard 4 TPI tooth cutting mild steel. Length of cut 75 mm. Cutting speed 3 0 m/min.
Chip and associated thrust force trace for point X on Figure 4.20.
Performance of a standard 4 TPI tooth cutting stainless steel. Length of cut 75 mm. Cutting speed 30 m/min.
The thrust force trace relating to point X on Figure 4.22.
The chip relating to point X on Figure 4.22. The performance 4, 6 and 10 TPI single teeth cutting various lengths of aluminium workpiece at 3 0 m/min cutting speed.
The performance 4, 6 and 10 TPI single teeth cutting various lengths of mild steel workpiece at 30 m/min cutting speed.
CAPTION
Performance of different pitch standard single teeth cutting aluminium:
(a) 50 mm (b) 25 mm (c) 12 mm
Performance of different pitch standard single teeth cutting mild steel:
(a) 50 mm (b) 2 5 mm (c) 12 mm
Performance of different pitch standard single teeth cutting stainless steel:
(a) 50 mm (b) 2 5 mm (c) 12 mm
Diagram of the shear planes OX and OA along which the chip material shears when the chip is
restricted from flowing along the rake face. The associated hodograph shows the relative velocity of chip material along OX and OA.
Diagram of alternate secondary shear planes OA, OB and OC and the associated hodograph.
Diagram of chip shape when the tool has travelled 3 t after the chip flow has been restricted.
Modelled chip shape at a distance? (a) 6 t, (b) 15 t, (c) 24 t, (d) 36 t and (e) 54 t, after chip restriction occurred. Rake angle, 0*.
Modelled chip shape at a distance; (a) 6 t, (b) • 15 t, (c) 24 t, (d) 36 t and (e) 54 t, after chip restriction occurred. Rake angle, -4*. Diagram showing the geometrical relationship between the cutting and thrust forces and the force acting along the shear plane.
Equivalent stress and logarithmic strain for mild steel and aluminium. Data taken from
FIGURE 5.8a
5.8b
5. 8c
5.9
6.1
6.2
7.1
7.2
7.3
CAPTION
Theoretical and experimental values of cutting force subsequent to chip flow restriction
occurring, for a standard 4 TPI tooth cutting aluminium. UCT is 0.067 mm.
Theoretical and experimental values of cutting force subsequent to chip flow restriction
occurring, for a standard 6 TPI tooth cutting aluminium. UCT is 0.074 mm.
Theoretical and experimental values of cutting force subsequent to chip flow restriction
occurring, for standard 4 and 6 TPI tooth cutting mild steel. UCT is 0.067 mm.
Chip and force trace showing the effect of the chip sticking and then slipping. The peaks are caused by the chip sticking and the subsequent drop in force occurs when the chip slips up the rake face.
Single tooth data used to predict sawing times, showing thrust force per unit width of tooth versus undeformed chip thickness.
Thrust force trace generated by a hydralic hacksaw machine.
4 TPI tooth having no restricting gullet with: (a) a zero degree rake angle?
(b) a 11* rake angle.
Standard 4 TPI tooth/gullet geometry with: (a) a zero degree rake angle
(b) a 10* rake angle
Performance of 4 TPI hacksaw tooth with no restricting gullet:
(a) with zero degree rake angle (b) with 11* rake angle.
FIGURE 7.4
7.5
7.6
7.7
7.8
7.9
7.10
7.11
7.12
7.13
CAPTION
Performance of standard 4 TPI tooth: (a) with zero degree rake angle (b) with 10° rake angle.
Mild steel workpiece. Length of cut 50 mm. Specific cutting energy versus undeformed chip thickness for single hacksaw teeth having no restricting gullet. Workpiece mild steel. 0* rake angle and 11* rake angle.
Single hacksaw teeth having a single radius root:
(a) 1.25 mm radius (b) 1.75 mm radius
New tooth/gullet geometry for improved chip curl.
The performances of:
(a) the single root radius teeth, Figure 7.6? and (b) the new tooth/gullet, Figure 7.7,
compared to the performance of a standard 4 TPI tooth cutting a 50 mm workpiece.
The single tooth shown in Figure 7.6 with chips which have curled to the same radius as the roots. There is sufficient spring in these chips to prevent them from falling out of the gullet.
Chip created by a hacksaw tooth having no restricting gullet.
Chips produced by the new tooth/gullet, Figure 7.7,
The performances of a standard 4 TPI
tooth/gullet and the new tooth/gullet, Figure 7.7, cutting a 75 mm mild steel workpiece. The performances of a standard 4 TPI
CHAPTER ONE
' INTRODUCTION
Cutting-off is the first process in many manufacturing sequences, because material is rarely delivered in suitable lengths for subsequent forging or machining processes.
Sawing is one of the most common cut-off processes used in industry, because it provides good output rates and
tolerances. The sawing processes in commonest use are:
(i) Power hacksawing;
(ii) Bandsawing;
(iii) Circular sawing.
The relative merits of each are briefly considered below.
Power hacksawing has the slowest output rate because it is not a continuous cutting process. The blade does not cut on the return stroke and therefore the return time is unproductive. Both bandsaws and circular saws cut continuously, having no unproductive cutting time.
Circular sawing has the highest output rate of the three processes, because the blade is the most rigid, and can therefore apply the highest cutting forces.
Hacksaw machines are generally cheaper than either
designed for particular applications thus making
production costs high. They are not throw-away tools, like band- and hacksaw blades, but have to be re-sharpened throughout their cutting lives. Some circular saws have replaceable segmental teeth which prolongs the life of the blade.
Bandsaw and hacksaw blades are throw-away tools, hacksaw blades being considerably cheaper. The price of the blade in a sawing process is particularly important if the
material is difficult to cut, causing rapid or inconsistent blade wear.
Kerf loss is greatest in circular sawing. The thickness of a circular saw blade determines the rigidity of the blade and is therefore thicker than band- and hacksaw blades in which rigidity is obtained by longitudinal tensioning. Kerf loss is particularly important when expensive materials or short pieces are being cut.,
Bandsaw blades, being the least rigid, have the worst run out. This is particularly severe when cutting broad
workpieces because the blade guides have to be positioned far apart.
Circular saws cut the mot accurately, this is partly due to the rigidity of the blade, but it is also due to the close tolerances to which these blades are manufactured.
The competition which hacksawing has received from
bandsawing and circular sawing is considerable, but there still appears to be a share of the cut-off market best served by power hacksawing. The process is particularly suited to cutting large workpieces of difficult-to-machine materials.
1.1 Hacksaw Machines
The essential features of a power hacksaw machine are the swing-arm assembly, which carries the saw blade and its bow, a mechanical drive to reciprocate the blade, and a device for developing thrust load between the blade and the workpiece. The thrust load is required to feed the blade into the
workpiece. It is applied during the cutting stroke and relieved to lift the blade on the return stroke. A number of different types of machines are
available, and they can be classified according to the method used to develop the thrust load.
Gravity fed machines develop the thrust load from the gravity force acting on a massive blade bow and swing arm assembly. In some machines an adjustable mass is provided on the swing arm assembly so that
the gravity force can be adjusted.
In hydraulic machines the thrust load is produced by the action of a hydraulic device. The control which the operator has over the thrust load generated by the hydraulic device is imprecise, and varies over the length of the stroke. However, this type of machine is common and is capable of applying large
thrust loads which makes it applicable for heavy duty work.
/
Positive feed machines control the feed rate to the blade directly by a mechanical screw device. The feed rate per stroke is pre-set and remains constant throughout the cut. When using gravity fed or
hydraulic machines, feed rate is controlled by the thrust load. Positive feed machines, however, control the thrust load by the feed rate. The
developed thrust load increases as the blade wears, for a given feed rate, and this can lead to
premature blade fracture. This lack of control over the thrust load and the resultant tendency to break blades are the main disadvantages of the positive displacement machines.
1.2 Power Hacksaw Blades
There are many brands of hacksaw bl.ade on the market. The types of blade available can be
categorised by the material from which they are made.
(i) Low alloy steel blades
These blades contain more than 1% tungsten. The whole blade is hardened and tempered uniformly, and only a small portion of the blade around the pinholes is softened.
Blades which have been heat-treated in this manner are known as 'all-hard* blades. (BS
1919) .
'All-hard' blades are rigid and will break into a number of pieces if bent beyond a critical radius.
(ii) High speed steel blades. All-hard. The high speed steel usually contains
molybdenum. Often M2 or M42 steels are used for these blades.
(iii) Bi-metal high speed steel blades
These blades are manufactured with the toothed edge formed from high speed steel joined to a spring steel backing strip. The toothed edge is fully hardened and tempered, whilst the backing strip is retained in a spring-like condition. Bi-metal blades are therefore flexible and shatter-proof.
1.2.1 Power hacksaw blade nomenclature
BS 1919 defines the nomenclature used for power hacksaw blades as below:
Nomenclature
Centre line The longitudinal line which passes through the centres of the pin holes.
Pin hole The hole at each end of the blade by means of which the blade is held and tensioned when
in use.
Teeth The serrations formed across the thickness of the blade to provide cutting edges.
Toothed edge The longitudinal edge along which the teeth have been formed.
Cutting edge The transverse edge of each tooth, formed by the intersection of the flank and the face.
Face The surface of the tooth adjacent to the
cutting edge on which the chip impinges as it is cut from the material being sawn.
Flank The surface behind the cutting edge of the » tooth which extends to the root radius.
Root radius The radius connected to the face of one tooth and the flank of the preceding one.
Back edge The longitudinal edge parallel to the toothed edge.
Side The flat surface between the toothed edge and the back edge.
Set The projection of teeth from the sides of the blade to provide cutting clearance.
Linear dimensions and size designation
Blade length The dimension between the centres of the pin holes, measured along the centre line of the blade.
Overall length The dimension between the ends of the blade measured along its centre line.
Width The dimension between the toothed edge and the back edge.
Thickness The dimension between the two sides, excluding the set.
Pitch (P) The distance between adjacent cutting
edges measured in millimetres.
Number of teeth (N) Number of complete teeth
contained in any 25 mm length measured along the toothed edge.
Size designation The blade length, width,
thickness and pitch and (number of teeth per 25 mm) are always expressed in this order as given in the following example:
1.2.2 BS 1919
The BS for hand and power blades places few
constraints on blade design, and manufacturers are free to design any tooth geometry, set pattern and side clearance.
Blade Performance Assessment Methods
To know how well a blade 'performs' is necessary for manufacturers' of hacksaw blades;
(a) for quality control; and
(b) for comparison with other manufacturers' blades
Hacksaw blade performance does not have a clearly defined standard, and as a result there are several methods of testing performance.
Three of these methods are now discussed:
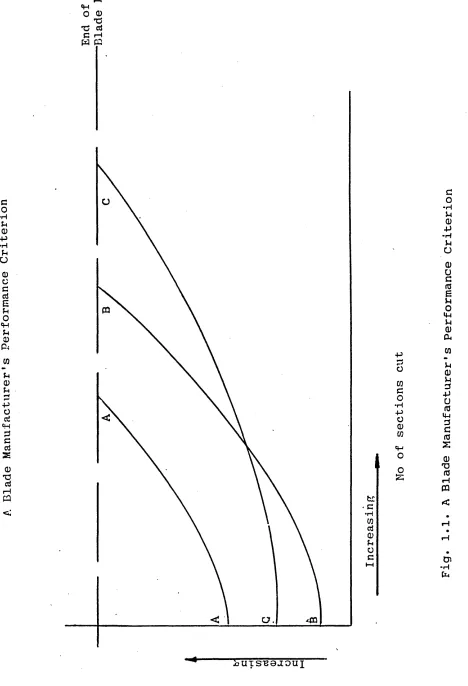
1.3.1 A blade manufacturer's testing procedure
each section is recorded, and from this a peformance criterion is evaluated, which is a measure of both the starting performance and wear rate of the blade. Figure 1.1 shows the performance of three blades; it is clear that blade A performs worse than the other two blades, because it takes more strokes to cut through the workpiece and wears out faster than the other two blades. However, the relative performance levels of blades B and C are more difficult to
assess. Blade B's initial output rate is better than C's, but it wears out faster.
In this test the applied thrust force is not
measured for each blade tested, but is arranged to be constant from test to test and is assumed to be constant from one machine to another. However, fundamental studies of hacksaw machines (2) carried out at Sheffield City Polytechnic, have shown that the thrust force characteristics of various machines differ considerably and therefore to compare the performance of two blades using this method, both
1 must be tested on the same machine. A better
performance test would eliminate the effect of the machine characteristics from the performance of the
blade, so that the performance of the blade itself would be obtained.
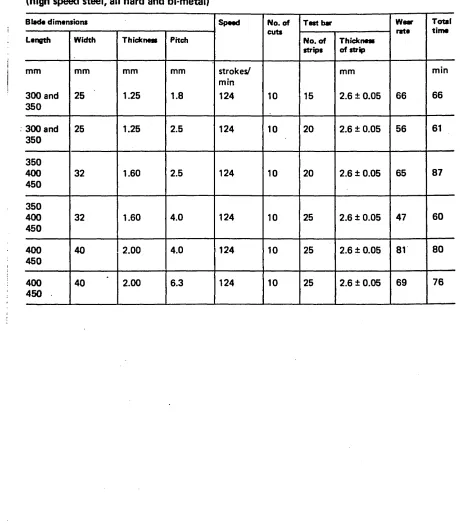
1.3.2 The BS 1919 British Standard performance test
The British Standard performance test, based on work carried out at Sheffield City Polytechnic and the British Hacksaw Manufacturers' Association, attempts to eliminate as many unwanted test variables (eg machine characteristics, workpiece length and material, etc) as possible.
To this end, the proposal specifies the material to be cut, and the width of the workpiece which varies depending on the pitch of the blade. It also
specifies the machine characteristics in detail. The specified machine parameters are:
(a) gravity feed;
(b) cutting in one direction only; (c) cutting speed;
(d) stroke length; (e) blade angle; (f) stroke rate;
(g) level of lift off on return stroke;
(h) the average thrust force per cutting stroke; and (i) the coolant used.
For each blade tested the number of sections cut is specified.
The procedure followed to test a blade is:
(i) set up the workpiece of specified width; (ii) cut the number of sections specified;
(iii) record the number of strokes to cut each section; (iv) calculate the 'wear rate' and 'total time' and
compare them with the standards given. Wear rate is a measure of the increase in cutting time per section cut for the whole test.
Figure 1.2 shows one of the proposed standards for power hacksaw blades.
1.3.3 The performance test developed by Sarwar and Thompson
Tests carried out by Sarwar and Thompson (1) had shown that for a given workpiece width and material/ the depth of cut per stroke is dependent on the
thrust force applied to the blade. Any performance criterion, therefore, should be able to take account of the effect of varying thrust forces which occur during hacksawing.
The performance criterion, proposed by Sarwar and Thompson, gave consistent results when various hydraulic and gravity feed machines were used (2). This suggested that the machine characteristics of
The procedure followed in testing a blade is:
(a) Set up a rectangular cross-section workpiece of known dimensions in a hacksaw machine equipped with a load measuring device.
(b) Cut through the workpiece, measuring the time to cut through the workpiece, and the thrust force for one stroke at approximately mid-way through the specimen.
(c) A few more cuts are taken at different thrust forces as in (b) above.
(d) The performance criterion is calculated using the time to cut through each section, and the force measurements.
The performance criterion (K) is calculated by dividing the average depth of cut per stroke per tooth (5a) by the average thrust force per unit width of tooth per tooth in contact with the workpiece (ftm).
(1.1)
ftm B.p“Ftm t1 (1.2)
where:
D = Depth of workpiece
w = Width of the saw slot
B = Breadth of workpiece
t = Thickness of saw teeth
p = Tooth pitch
s = Stroke length
s.p"^ = Number of teeth cutting per stroke
N = Number of strokes to cut through the
workpiece
= The average thrust force applied to the blade per stroke
B.p”^ = The number of teeth in contact with the workpiece.
K = #
-f tm
Thus from (1.1) + (1.2) K = „D,W-;VB ■ (1.3)
tm ' Sarwar (2) showed that:
Ftm = C -Fcm f1*4*
where:
= the average cutting force applied to the blade per stroke; and
C = a constant
Substituting (1.4) in (1.3): D. w. B
K =
c -FcmN-S
C.F^.N.S is the total cutting energy required to cut the section.
Thus K, the blade performance criterion, is proportional to the inverse of specific cutting energy.
The Sarwar and Thompson blade performance test is generally used to give the performance of a blade in its new state. However the test can be used to give the performance of a blade at different stages of its cutting life, and can be used to measure blade wear rate. (3)
1.4 Tooth Geometry
The aim of this research project was to gain more understanding of the influences of the various elements of tooth geometry on the cutting
performance of power hacksaw blades so that their performance can be improved.
Hacksaw tooth geometry varies from one brand of
\
blade to another. The only feature common to all brands is the pitch, for which there is an
internationally agreed standard. Table 1.1.
Pitch
of teeth (mm) 0.8 1.0 1.4 1.8 2.5 4.0 6.3 Number of
teeth/25 mm 32 24 18 14 10 6 4
These values are nominal and subject to a variation of + 6 %.
Some manufacturers make blades with a larger tooth pitch than 6.3 mm, but there are no pitches produced between those shown in Table 1.1.
Two tooth geometries are shown in Figure 1.3 to illustrate the difference between brands of hacksaws.
In the following sections of this chapter, various aspects of tool geometry are discussed in relation to hacksaw teeth.
1.4.1 Rake angle and cutting edge radius
Figures 1.4 a-d show the effect of rake angle on continuous chip formation in orthogonal cutting.
The positive rake angle tool , Figure 1.4af produces a larger shear plane angle, f, than the zero/ rake angle tool, Figure 1.4b. Its shear plane length AB is therefore shorter and the forces required to shear the chip across this plane are less. As the rake angle becomes more negative, Figure 1.4 c, the
shear plane angle decreases, and the shear plane length and shear force increase. When the rake angle becomes very negative, Figure 1.4d, the force required to shear along the chip/tool interface AC will approach that required to shear along the shear plane AB. This model of cutting cannot occur in practice because the area of metal AOC is unable to flow under these conditions. Thus AOC becomes a dead metal zone and shear planes are created along AO, OC and OB, Figure 1.4d (2) .
-In most metal cutting operations, eg turning, milling, shaping, the rake angle is never more
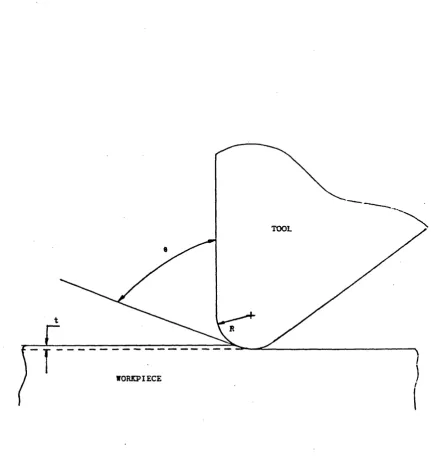
negative than -15°. However, for some processes, eg grinding and hacksawing, the effective rake angle can be more negative than -15° ranging between 0° and -90°. This is due to the small undeformed chip thickness to cutting edge radius ratio. Early work carried out at Sheffield City Polytechnic (1, 4) showed that the cutting edge radii, Figure 1.5, of hacksaw teeth are large and can vary in size from 0.02 mm to 0.08 mm. The blunt cutting edge is a result of the heat treatment process which is carried out after the teeth have been milled to size. (There is no sharpening of the teeth after heat treatment). The average undeformed chip thickness per tooth was estimated (4) to vary
between 0.002 mm and O'OSO mm which is small compared
to the cutting edge radius. Figure 1.6 shows the effective rake angle when the cutting edge radius,
(R) , to undeformed chip thickness, (— ) , ratio istc
large.
Cutting tests (2, 5) have shown that tools with large cutting edge radii to undeformed chip
thickness ratios, cut significantly less efficiently than sharper tools. During these tests (2,5,6), cutting copper, Sarwar and Thompson observed that a dead metal cap formed in front of the blunt tools at the start of each cut. Furthermore they reported that a transient phase of chip formation occurred during the beginning of the cut until a steady state of chip formation was produced. The chip was
thinner in the transient phase and required less force to be produced than in the steady state phase, despite the undeformed chip thickness remaining
constant throughout the cut. Thus chip formation was more efficient in the transient phase than the steady state phase.
Sarwar and Hales also carried out tests on blunt cutting tools (7) which had nominal rake angles varying from 0° to 15°. The cutting edge radii tested were nominally sharp, 0.3 mm and 0.5 mm.
Nominal rake angle had no effect on performance when cutting ENlA, a leaded mild steel, but when cutting copper the 5° rake angle tool performed better than the 0° rake angle tool. The conclusion drawn from these tests was that when the cutting edge radius to undeformed chip thickness ratio is high then nominal rake angle does not affect cutting performance for mild steel but does for copper. The relevance of
these tests to hacksawing is discussed in Chapter Seven.
When the cutting edge radius to undeformed chip thickness ratio is very large, the chip formed during the time that the tooth traverses the
workpieces will not grow large enough to give chip*
contact on the tooth face beyond the end of the edge radius. Under these conditions, rake angle of the tooth face must be irrelevant to the cutting action.
1.4.2 Set
The teeth on a hacksaw blade are set to give
clearance between the blade and the slot wall which, if not provided, would cause frictional forces
sufficient to break the blade and/or temperatures capable of softening the blade.
The author is unaware of any published work which covers theoretical or experimental examinations of set angle with regard to blade performance. However, Thompson & Taylor (8) have considered the effect of set on the lateral displacement of a blade. They conclude that "setting angle errors are the prime cause of the lateral displacements produced by new un-worn blades".
it
Soderberg (9) makes a passing reference to the effect of set on the undeformed chip thickness cut by each tooth on a blade. He reports that there is a variation in undeformed chip thickness along the
it
tooth cutting edge. Soderberg showed, Figure 1.7, that some parts of a new tooth edge do not cut at all. Chips from hacksawing are frequently not as wide as the teeth on the blade, which corroborates
it
Soderberg's suggestion.
1.4.3 Clearance angle
The clearance angle on a standard hacksaw tooth, 34° - 38°, Figure 1.5, is much larger than that found on conventional tools used for turning, shaping,
milling, etc. A larger clearance angle will obviously lead to a smaller size of land wear. However a large clearance angle produces a small wedge angle which reduces the strength of the tool, and decreases the wear resistance of the tool
further because heat conduction from the tool tip is restricted. Therefore a compromise must be made between the size of the clearance angle and the wedge angle.
The clearance angle also affects the size of the gullet. Some manufacturers have two clearance angles on each tooth, Figure 1.3. The primary clearance angle provides a large wedge angle, and the secondary angle provides space in the gullet for the chip to form.
1.4.4 Tooth pitch
Performance tests carried out by Sarwar and Thompson (1,2) have shown that blades with large pitches cut better than those with small pitches, Figure 1.8. Thompson (4) explains this effect by reference to the transient cutting force build-up produced by
blunt tools (6). The model Thompson (4) proposed, showed that pitch affected cutting performance. The pitch effect is discussed in Chapter Two.
1.4.5 Gullet
The effect of the gullet on the cutting performance of hacksaw blades has not been investigated in the past. Thompson (10) reports that "A number of
gullet shapes are used, but it is believed that they do not have a major influence on cutting performance providing that ‘clogging* of the teeth does not
occur. The primary cause of clogging is the
adhesion of the metal removed to the teeth so that it is carried by the blade to the beginning of the subsequent cut".
A major proportion of the author*s work, for this research project, is concerned with gullet shape and
size
.
1.5 Blade Wear
(i) Superficial plastic deformation by high temperatures.
shear at
(ii) Plastic deformation of the cutting edge. (iii) Wear based on diffusion.
(iv) Attrition wear. (v) Abrasive wear.
Thompson & Taylor (3) proposed that mechanisms^ (i) and (ii) were the main processes by which hacksaw blades wear. Figure 1.9 shows the wear model of a hacksaw tooth as proposed by Thompson and Taylor. They suggest that flank wear of this type maintains the blunt cutting edge profile.
Thompson and Taylor (3) also proposed a model which could determine the effects of various cutting
conditions on the wear rate of hacksaw blades. Wear rate being a measure of the loss in cutting
efficiency per cutting stroke. They report that cutting speed and thrust load had the greatest effect on wear rate: doubling cutting speed
increased wear rate by six-fold, and doubling thrust force tripled wear rate. Also small workpiece
breadths were shown to induce a higher wear rate than large workpiece breadths.
Thompson and Taylor (3) suggested three applications for their model:
(i) To validate improvements, applications and developments in blade design;
(ii) To test the effectiveness of coolants; and (iii) To compare one blade with another.
A more detailed study of wear mechanisms in power hacksawing has been carried out'by Soderberg et al
(9) . They report that wear mechanisms vary
depending on workpiece material. When cutting a quenched and tempered carbon steel (0.36% C, 322 VHN) flank and crater wear were caused by abrasion. However, when cutting an austenitic stainless steel
(18% Cr, 183 VHN) they report that flank wear was caused by plastic deformation due to high
temperatures, and that wear on the rake face was caused by spalling. Figure 1.10 shows the
characteristic profile of a tooth after cutting each of the materials mentioned above.
An interesting recent development in hacksaw technology is that some hacksaw manufacturers have produced blades which have the corners of each tooth ground away.
Standard hacksaw teeth generally wear most severely on the corners due to poor heat conduction from the
CHAPTER TWO
BLADE PERFORMANCE TESTS
Work carried out by Sarwar and Thompson (1 r 2) had shown that, for one make of hacksaw blade, there was a
difference in performance between 4, 6 and 10 TPI blades; the 4 TPI blade cutting better than the 6 TPI blade which cut better than the 10 TPI blade. Figure 1.8. Furthermore it had been shown that cutting performance, for a
particular blade, varied according to width of workpiece. As workpiece width increases, cutting performance falls, Figure 2.1. These tests have been repeated by the author using a Kasto hydraulic feed machine, and the results. Figures 2.2 and 2.3 corroborated those of Sarwar. The reason given by Thompson (4) for the difference in performance as workpiece width increases is that, a
smaller proportion of the teeth in contact are cutting in the transient chip formation phase section for a wide workpiece than for a narrow workpiece. Cutting in the transient phase is more efficient than in the steady state phase, because the cutting forces are not as high.
Furthermore, Thompson (4) produced a mathematical model showing that as the number of teeth in contact with the workpiece (Nc) increases the cutting performance falls.
The above supposition would explain why performance varies with breadth of workpiece, Figure 2.3, assuming that the transient phase was large in proportion to the breadth of workpiece. However, whether or not pitch affects
performance needed further investigation.
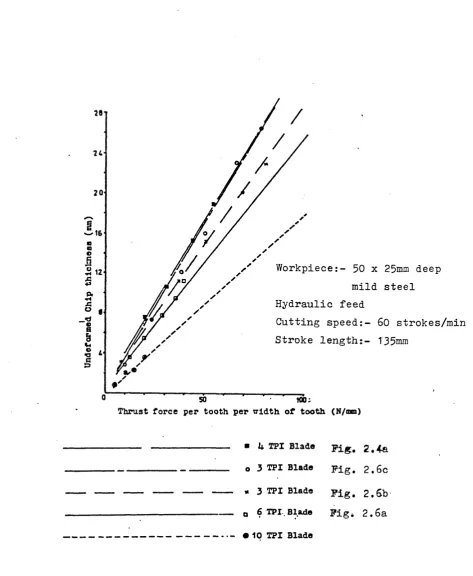
2.1 Performance Tests on Modified Blades to Determine the Effect of Pitch
The following results are given in terms of the Sarwar and Thompson performance criterion, section 1.3.3, in which the depth of cut per tooth is
plotted against thrust force per tooth; the steeper the curve the better the performance.
Test machine: Kasto hydraulic feed
Cutting
conditions:-Cutting rate: 50 strokes/min
Stroke length: 13 5 mm
Coolant: None
Workpiece specification:
Mild Steel (0.17% C, 0.73% Mn, 0.24% Si,
0.06% S, 0.13% P, 0.20% Ni, 0.10% Cr, 0.06% Cu, 0.06% Mo, 0.012% Al).
An initial test compared the cutting performance of a 400 x 40 x 2 mm 4 TPI blade, raker set in its new condition, Figure 2.4a, and the cutting performance of the same blade modif ied by the removal of the cutting edge of every other tooth, Figure 2.4b.
(The modification did not change the raker set pattern). The modified blade was effectively a 2 TPI blade, and would therefore cut better than the new 4 TPI blade if pitch affected cutting
performance. As can be seen from Figure 2.5, there was no appreciable difference in cutting performance between the 4 TPI blade and the 2 TPI blade which suggests that pitch is not a parameter which affects performance.
I
The blade used for the above test was modified further by the removal of every other tooth, see Figure 2.4c, and its performance tested once again.
Figure 2.5 shows that the further modification improved the cutting performance of. the blade.
2.1.1 Discussion of results
From the evidence provided by these results it was suggested that the size of the gullet affects
cutting performance of hacksaw blades. The
reasoning behind this suggestion is that the first modification did not alter the gullet size of the
blade and did not alter the cutting performance of the blade, but the second modification enlarged the gullet and improved the cutting performance of the blade.
It is indeed feasible that a small gullet would
restrict the flow of a chip more than a large gullet would/ and that this restriction could cause a fall
in cutting efficiency. (Chapter Five).
2.2 Performance Tests on Modified Blades to Determine the Effect of Gullet Size
To check the above conclusion concerning gullet size and cutting performance, three more tests were
carried out using the same experimental set-up as before, but in this test a 400 x 40 x 2 mm - 6 TPI blade was used.
Initially the blade was tested in its new condition, Figure 2.6a. Every other tooth was then removed down to the root of the gullet, Figure 2*6b, thus
creating a 3 TPI blade with a larger gullet area than the 6 TPI blade.
A further modification of the 3 TPI blade was made which enlarged every gullet so that the height of the gullet was the same as that of a new 4 TPI blade, Figure 2.6c. The performance of this blade was better than that of the 3 TPI blade with the
smaller gullet, but it was no better than the 4 TPI blade which had a smaller gullet, Figure 2.7.
These results show that size is not the only aspect#
of the gullet geometry which affects cutting ^
performance. Shape is also important when considering gullet geometry.
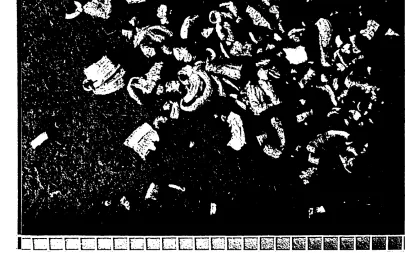
2. 3 Hacksaw Chip Formation
The premise that gullet size and shape affects the performance of hacksaw blades has been made in section 2.2. Evidence to support this assumption has been found in the formation of hacksaw chips.
The sizes and shapes of hacksaw chips vary greatly. Figure 2.8 a-c. There are several factors in the hacksawing process which cause the variations in chip size.
(i) The variable thrust load applied during each stroke by hydraulic feed machines causes the depth of cut per tooth to vary during each stroke.
(ii) Hacksaw teeth vary in size, Appendix 1, thus a large tooth will remove more material than a small tooth.
(iii) The set of the teeth varies along the length of the blade. A tooth having a large set will remove more material than one with a smaller set.
(iv) Chip thickness varies from tooth to tooth due to variations in cutting edge radius.
(v) Due to the set of the teeth some teeth do not cut across the full width of the cutting
edge, Figure 1.7 (9).
When studying hacksaw chips, it is therefore,
impossible to know which tooth cut which chip, the undeformed chip thicknesses, or even whether the chips are broken or whole. Despite these
limitations it is possible to glean some information by studying hacksaw chips.
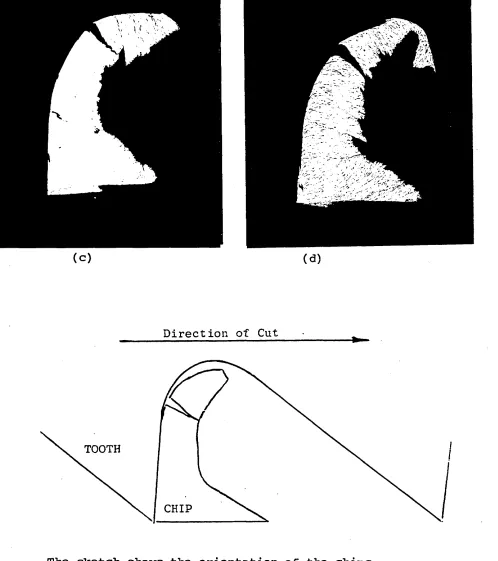
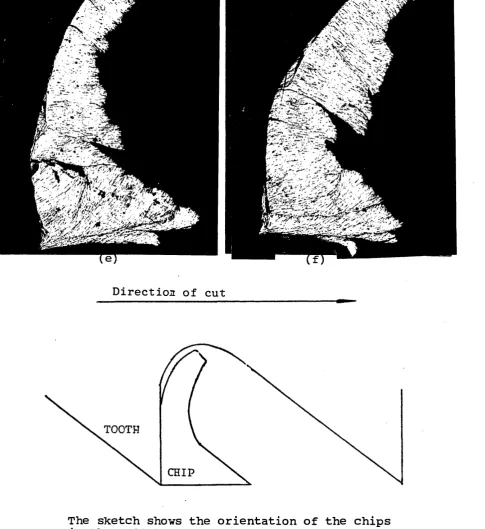
2.3.1 Chip formation affected by the gullet
I
Some chips have been mounted in bakelite, sectioned and etched in 2% Nital solution, Figures 2.9 a-f. Consider Figure 2.9, a chip taken from a 10 TPI blade cutting a 50 mm broad mild steel workpiece on a
to cut the bottom part of the chip than the top. The flow lines show that the shear plane angle has decreased towards the bottom of the chip. It is possible that this type of chip formation is caused by the gullet restricting the flow of the chip up the rake face. (Chapter Five).
Figures 2.9 b-d also show thickening at the base of the chip.
CHAPTER THREE
SINGLE TOOTH & GULLET TESTS AT SLOW CUTTING SPEEDS
The effect of gullet size and shape on blade performance appeared to be sufficiently important for a study of gullet size and shape to be initiated.
3.1 Test Objectives
A testing procedure was developed with three major objectives in mind:
(i) To determine the difference in cutting
performance of 4, 6 and 10 TPI teeth-gullet combinations for various workpiece materials.
(ii) To determine the effect of length of cut on cutting performance for various workpiece materials.
(iii) To determine the effect of modifications to gullet shape and size cutting performance for various workpiece materials.
3.2 Testing & Instrumentation
In order to avoid the complexities of the hacksawing process, single teeth were tested on the same rig as was used by Sarwar (2) for testing the cutting
A universal miller was used to provide the relative motion of the tool ar^d workpiece. The workpiece was
securely mounted on a flat reference plate which was bolted to a three force component dynamometer
which in turn was secured to a ground steel plate, bolted on the milling machine. The dynamometer measured the cutting and thrust forces and its
output signals were amplified and recorded on an X-Y: *■£
plotter.
The tools used for this test were straight teeth taken from new all-hard HSS hacksaw blades. The geometry and dimensions of the teeth are shown in Figure 3.1, and for the purposes of this thesis will be referred to as the ’’standard” tooth/gullet
geometries. Each tooth was viewed under a
microscope and checked for uniformity of geometry, and the cutting edge radius was estimated using a shadow-graph projector. Teeth having cutting edge radii of 0.05 mm * .01 mm were used. When under test, a tooth was secured in a holder, Figure 3.2, which was clamped to the headstock of the milling machine.
The height of the slot surface cut by the tool, was measured relative to the reference plate, using a
three places along the slot and an average value of undeformed chip thickness was calculated for each cut. The test went through three stages of
development.
METHOD 1 Figure 3.4
The procedure for this method was:
(i) Set an undeformed chip thickness by raising the mill table.
(ii) Start the cut by traversing the table. The tool cut on the surface of the workpiece/ not in a groove, so that the chip could be viewed as it formed.
(iii) An X-Y plotter recorded the cutting and thrust forces during the cut. The
characteristics of the chip formation was recorded during the cut.
(iv) The depth of cut was measured before and
after each cut in three places using a DTI, to determine an accurate value for the average undeformed chip thickness.
The limitation of this methbd was the imprecise nature of the recording of the chip formation. It was impossible to write down, in sufficient detail,
METHOD 2
The procedure for this method was the same as for Method 1, with the exception that instead of writing down how the chips formed, every cut was filmed
using video equipment. An oblique view of the cutting tool was filmed so that both the front and one side of the chip could be seen at the same time.
Despite the vast improvement made by filming each cut, it was still difficult to relate a particular event on the film, such as the chip breaking, to the relevant part of the force trace. The need to
relate chip formation to the cutting forces was particularly important owing to large variations occurring in the cutting forces for a single cut, at a constant undeformed chip thickness. Figure 3.5 shows a cutting force trace exhibiting considerable variation as the chip formed.
METHOD 3
This method was the same as Method 2, but with the addition of a storage oscilloscope and a second
video camera. A diagram of the test set-up is shown in Figure 3.6 and photos of the instrumentation in Figure 3.7.
The storage oscilloscope recorded the same cutting and thrust forces as the X-Y plotter. The second
camera filmed the oscilloscope during each cut, and its picture was superimposed on that of the first camera giving a picture of the force traces and chip formation simultaneously on one screen.
This enabled a study of both chip formation and force variations to be made simultaneously.
3.3 Cutting Conditions & Tests
Machine Tool Universal Milling Machine
Cutting speed 95 mm/min
Lubricant None
Material Mild Steel
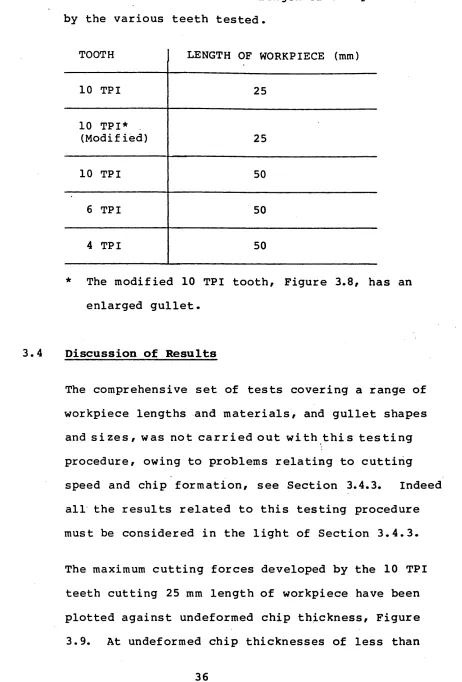
Table 3.1 below, shows the length of workpieces cut by the various teeth tested.
TOOTH LENGTH OF WORKPIECE (mm)
10 TPI 25
10 TPI*
(Modified) 25
10 TPI 50
6 TPI 50
4 TPI 50
* The modified 10 TPI tooth, Figure 3.8, has an enlarged gullet.
3.4 Discussion of Results
The comprehensive set of tests covering a range of workpiece lengths and materials, and gullet shapes
and sizes, was not carried out with this testing procedure, owing to problems relating to cutting speed and chip formation, see Section 3.4.3. Indeed all the results related to this testing procedure must be considered in the light of Section 3.4.3.
The maximum cutting forces developed by the 10 TPI teeth cutting 25 mm length of workpiece have been plotted against undeformed chip thickness, Figure 3.9. At undeformed chip thicknesses of less than
[image:55.612.58.520.31.713.2]0.03 mm the two teeth perform the same. However at 0.037 mm there is a significant difference in
cutting force. The force traces for the points A and Bf Figure 3.10 show that, for the tooth in its new state there was a rapid rise in cutting force towards the end of the cut. This did not happen with the modified tooth, points C and D, Figure
3.11, nor did it happen when cutting at smaller
undeformed chip thicknesses with the tooth in itst
new state. The rapid rise in cutting force, Figure 3.10 was caused by restriction of the chip flow by the gullet.
Figure 3.12 shows sketches of the chip formation at various stages during a cut in which restriction by
the gullet occurred. These sketches have been made
from the video film of the cut. (It was not
possible to take still photographs from the video screen, because the video equipment used could not provide a still picture with good definition). The chip forms, initially, with a tight curl, Figure 3.12a and does not curl sharply again until the chip makes contact with the root, Figure 3.12b. At this
therefore, when the chip is restricted from flowing. The cuts made at small undeformed chip thickness values did not produce chips large enough for their flow to be restricted by the gullet and therefore the rapid increase in cutting forces did not occur. Cutting with the modified tooth, Figure 3.8, did not cause any rapid increase in cutting force because there was no gullet to restrict chip flow.
It is interesting to note that restriction of chip flow by the gullet occurs before the gullet is completely full of chip material. The area of the 10 TPI gullet profile was approximately 2 mm . To completely fill this gullet, an undeformed chip
thickness of 0.08 mm would be needed, assuming a 25 mm length of cut. The force traces, Figure 3.10a and b, suggest that the chip flow is restricted when the gullet is approxmately 35% full of chip material. The specific cutting energy curve for the tool in
its new state, Figure 3.13, shows the rise in
average specific cutting energy as undeformed chip thickness increases past 0.03 mm.
Several other tests, cutting with 10 TPI teeth having restricting gullets, have shown the same characteristic force trace as in Figure 3.10. Two more sets of traces and sketches of the chip
and as a result the undeformed chip thickness
required to cause chip flow restriction (0.027 mm) was less than for the 25 mm length of cut.
3.4.1 Relevance of the results to hacksawing
The results of the above tests can be related directly to positive feed hacksawing operations. They show that if too high a feed is set on the machine, then very high cutting forces will be
induced, possibly resulting in tooth and/or blade fracture.
The relevance of the above results to gravity and hydraulic feed hacksawing machines is not so direct. Feed is controlled by thrust force in these machines but in the simulation test the thrust force was
controlled by the applied feed. The thrust force created by cutting in the simulation test had the same characteristic shape as the cutting force, when restriction of the chip flow occurred, Figure 3.10. On a hydraulic hacksaw, the rise in thrust force would partially or completely relieve the thrust force acting between the workpiece and the other teeth, thus reducing the blade’s cutting
performance.
3.4.2 Comparison of 4, 6 and 10 TPI teeth
The performance of the 4, 6 and 10 TPI teeth cutting 50 mm length workpieces is shown in Figure 3.16. Lines of best fit have been drawn through the data points using linear regression. The 4 TPI tool performs better than the 6 TPI tool which in turn performs better than the 10 TPI tool. This trend is the same as for hacksaw blades, Figure 2.7.
3.4.3 Effects of slow cutting speed
At this stage it is necessary to report on a limitation in this simulation test which did not come to light, until after a great amount of time had been spent setting up and carrying out the test.
The cutting speed for this test was 95 mm/min. This is slow compared to that available on hacksaw
machines, but was used to facilitate observation and filming of the chip formation. Hacksaws cut over a range of speeds, eg 0 to 3 0 m/min, during each
stroke due to the crank action of the drive.
However, most of the material is removed whilst the blade is moving at its fastest, because the thrust forces are highest during this time (9) .
Cutting at such a slow speed in the simulation test produced a very rough surface finish, Figure 3.17, after the first 7-10 mm length of cut, which made
accurate measurement of undeformed chip thickness difficult. Also the backs of the chips had several transverse cracks, Figure 3.18, and the forces
developed during the cuts were very uneven, Figure 3.5. The chips produced by the 4 to 6 TPI Teeth appeared to be very weak, frequently breaking when coming in contact with the gullet root. This was attributed to the cracks in the backs of the chips. A study of the microstructure of the chips was made to determine the size of the cracks. Some typical chips were taken from a 4 TPI tooth cutting on the simulation rig. They were mounted in bakelite, sectioned and etched using 2% Nital, Figure 3.19. The chips appear to be discontinuous in the
photographs, however the sides of the chips, which cannot be seen in the central section shown, were continuous.
The chip formation bears a close similarity to that described by Chandiramani and Cook (12) in the
increases the stresses around the tool tip.
In the second stage a crack, caused by the high stresses is formed in the chip at the tool tip.
This crack propogates through the chip, breaking it. The broken part of the chip no longer applies a
force to the workpiece, and therefore the forces, stresses, and shear plane length decrease.
In the third stage, the chip flows up the rake face until again the frictional forces increase to a level high enough for the chip to stick. The cycle then repeats itself. Figure 3.20 shows a diagram of the chip formation described above.
Furthermore the authors report (12) that at very low cutting speeds surface finish was very poor.
The simulation test did not produce a chip formation similar to that which it was designed to simulate. The number of cracks in the simulation test chips was far greater than those in hacksawing chips,
Figures 2.8 and 2.9. The cracked chips being very v weak, prevented any useful data being obtained when
cutting with 4 and 6 TPI teeth, because when the gullet restricted chip flow the chips broke thus relieving the restriction. The data obtained from cutting with 10 TPI tools is however more reliable. The initial parts of the chips were free from cracks and therefore relatively strong, Figure 3.19. The
10 TPI gullet was s m a l l enough to restrict the flow
of this inital part of the chip, which, being free
from cracks did not break. The restriction was
therefore m a i n t a i n e d as the cut progressed, causing
the chip to thicken and the cutting forces to
i n c r e a s e .
A true p i c ture of the effect of the gullet size on
hacksawing p e r f o r m a n c e could not be obtained on this
simulation rig, b e c a u s e the chip f o r m a t i o n was
signifi c a n t l y d i s s i m i l a r to that produced in
hacksawing, Figure 3.19.
3.4.4 E x a m i n a t i o n s of vi d e o films
The use of the v i d e o f i l m s was f o u n d to be s e v e r e l y
limited for the 4 and 6 TPI tools, because the
cracks in the c h i p s w e r e o n l y v i s i b l e on the b a c k s
of the c h i p s a n d t h e r e f o r e not in the v i e w of t h e
camera. Thus, rises and falls in the cutting forces
could not be expl a i n e d by reference to the video
f i l m s .
However, for the 10 TPI tools the video film gave a
good m a c r o v i e w of the c h i p r e s t r i c t i o n in the
C H A P T E R FOUR
SINGLE TOOTH & GULLET TESTS AT HIGHER CUTTING SPEEDS
The test rig and p r o c e d u r e d e s c r i b e d be l o w was d e v e l o p e d
to fulfil the o bjectives stated in Section 3.1 at
realistic power hacksaw c u t ting speeds.
4.1 The Test Rig
A screw cutting lathe, Figure 4.1, was used to
p r o v i d e the rel a t i v e m o t i o n b e t w e e n the w o r k p i e c e
and tooth. The w o r k p i e c e holder, Figure 4.3, wa s
held in t h e t h r e e j a w c h u c k and c e n t r e d for
rigidity. The tool was m o u n t e d in a holder, Figure
4.2, w h i c h w a s s e c u r e d to a K i s t l e r t h r e e f o r c e
dyna m o m e t e r p l a t f o r m , w h i c h in t u r n w a s b o l t e d to
the c r o s s -slide of the lathe.
The toolholder, Figure 4.2, w a s d e s i g n e d to hold
tools of the d i m e n s i o n s s h o w n in Figure 3.1. The
f u nction of the t w o s i d e p i e c e s w a s to s i m u l a t e th e
slot w all in h a c k s a w i n g w h i c h prevents the chip from
m o v i n g sideways' o u t of the g u l l e t w h i l s t a t o o t h is
cutting.
The w o r k p i e c e and holder, Figures 4.3 and 4.4 w e r e
designed such that, by tra v e r s i n g at an a p p r o p r i a t e
s c r e w feed, the t o o l w o u l d cu t the w o r k p i e c e o n c e
only per test cut. This was n e c e s s a r y because the
c hip c o l l e c t e d an d identified.
The holder has a large diameter for the following reasons:
(i) To keep the helix angle, at which the tool
cuts to less than 1°, ie to crea t e orthogonal
c u t t i n g conditions;
(ii) To s i m u l a t e t h e f l a t s l o t b ed p r o d u c e d in
hack s a w i n g ; and
(iii) To m a i n t a i n rigidity.
The w o r k p i e c e is b oth s i m p l e and i nexpensive to
produce. The len g t h of w o r k p i e c e can be varied from
10-100 m m and a ny w o r k p i e c e m a t e r i a l can be tested.
The locating pins provide a c c u r a t e r e l o c a t i o n of the
workpiece if required.
The i n s t r u m e n t a t i o n used is s h o w n in Figures 4.5a
and b. The c u t t i n g and thr u s t force o u t p u t s from
the Kistler charge a m p l i f i e r s w e r e fed into a
digital s t o r a g e oscilloscope. A hard copy of the
force t r a c e s w h i c h h a d b e e n s t o r e d by the
oscilloscope, w a s taken by an X-Y plotter. (The
oscilloscope w a s n e c e s s a r y as an i n t e r m e d i a t e data
store, b e c a u s e the X-Y plotter's r e s p o n s e t ime w a s
too long to r ead data as each test cut was made).
The analogue o u t p u t f r o m the o s c i l l o s c o p e was also