EXPLORING THE LINK BETWEEN
LOCAL AND GLOBAL KNOWLEDGE
SPILLOVERS
Barrios, Salvador and Bertinelli, Luisito and Heinen, Andreas
and Strobl, Eric
Institute for Prospective Technological Studies, Joint Research
Centre, European Commission
2 August 2007
Online at
https://mpra.ub.uni-muenchen.de/6301/
File name: paper_barrios_KfG
Author: <Salvador Barrios, Luisito Bertinelli, Andreas Heinen, Eric Strobl> Status: <Draft>
Last updated: August 2007
Organisation: European Commission DG JRC, Institute for Prospective Technological Studies, CREA, Université du Luxembourg, Universidad Carlos III Madrid, Ecole Polytechnique Paris
EXPLORING THE LINK
BETWEEN LOCAL AND GLOBAL
KNOWLEDGE SPILLOVERS
CONTRIBUTED PAPER FOR THE 2007 CONFERENCE ON
CORPORATE R&D (CONCORD)
TABLE OF CONTENTS
1 Introduction ...3
2 Data Description and Summary Statistics...7
3 Econometric Analysis...14
4 Concluding remarks ...26
5 Tables………27
6 Figures………..32
7 References………...34
Annex 1: Detailed Data Description……….37
Annex 2: Calculation of Total Factor Productivity………..38
1 Chapter 1: Introduction
The observed productivity differences across countries are arguably one of the main
forces behind observed disparities in per capita income. The primary candidate driving
such productivity differences is of course the state of technological knowhow of a
country. 1 In this regard, one of the main difficulties in quantifying technological know
how’s true contribution to productivity is related to its very public nature and hence the
possibility of externalities, where those other than the ones that generate the knowledge
may benefit from it. There are now a large number of empirical papers that have
investigated the existence of such knowledge spillovers. Some of these have focused on
the influence of both technological and geographical distances on knowledge flows at the
local level as, for example, Jaffe (1986), Adam and Jaffe (1996) and Orlando (2004) –
while others have been concerned with examining knowledge spillovers across countries,
either directly or through such channels as FDI and trade; see, in particular, Helpman and
Coe (1995) and Keller (2004) for a review. In general these studies have tended to show,
on the one hand, that local spillovers are subject to distance decay effects and, on the
other hand, that within country spillovers tend to be more prominent than between country
spillovers, although the latter evidence has, to date, been mainly based on aggregate,
industrylevel studies rather than microlevel data. 2
Importantly, however, one needs to note that existing empirical evidence is usually
derived from treating local and global knowledge spillovers separately. Exceptions to this
are the recent papers by Cassiman and Veugelers (2004), Branstetter (2006), and Griffith
et al. (2007). Cassiman and Veugelers (2004) consider technology acquisitions by a
sample of firms based in Belgium and observe that firms that source technology
internationally generate local transfers more intensively, especially in the case of foreign
affiliates based in Belgium. The authors also find, however, that, after controlling for
access to international technology markets, foreign affiliates are less prone to transfer
technology to the local economy. In contrast, Branstetter (2006) analyses both local and
international knowledge spillovers through patent citations between Japanese firms and
their affiliates located in the US and discovers that knowledge flows operate in both
directions.
While the evidence provided by Cassiman and Veugelers (2004), and Branstetter
(2006) sheds important light on the existence of international R&D spillovers, these studies
do not measure the actual productivity gains due to these. In a recent paper, Griffith et al.
(2007), provide such a productivity analysis using firmlevel data to compare the
productivity performance of UK firms with R&D labs located in the US relative to that of US
firms with R&D labs based in the UK. Their results show that UK firms with research
activity located in the US benefited from their USbased R&D activity through higher
productivity levels. US firms with R&D activity in the UK, however, do not benefit from
similar R&D spillovers emanating from their UKbased R&D labs. The authors conclude
that, because of the overall higher technological capability of US firms, R&D spillovers are
only significant when they flow from the most technologically advanced country (i.e., the
US) to the least technologically advanced one (i.e., the UK). While these results highlight
the magnitude of crossborder spillovers, one should note that Griffith et al.’s (2007)
analysis does not take account of intranational R&D spillovers.
In the present paper we argue that it is important to consider local and global
knowledge spillovers together in a single analytical framework since the benefits derived
from the growing internationalisation of knowledge are likely to be influenced by the local
exposure to foreign innovations and technological improvements, as well as the local
capacity to benefit from these. Our contribution to the existing literature in this regard is to
consider a distinctive layer of transmission of knowledge represented by the spatial
agglomeration of economic activities which can favour the absorption of both intranational
and international knowledge spillovers and the interaction between the two. In this paper
we study such local and global knowledge spillovers together by considering the role
played by geographic and technological distance in conjunction with that of international
trade and FDI. To this end we make use of plantlevel data for the Irish manufacturing
industries spanning the time period 19901995 and focus on knowledge spillovers derived
from R&D activity. Our research strategy borrows directly from Orlando (2004), who
analyses the existence of local R&D spillovers by looking at the influence of R&D activity
undertaken by distant plants making the distinction between technological distance
(depending on whether R&D activity is carried out by plants within or outside a given
industrial sector) and geographical distance measuring distance in kilometres between
each pair of plant. However, unlike Orlando (2004), we avail of much more detailed
geographic information concerning the location of each plant, allowing us to test for the
existence of local R&D spillovers by considering distancedecay effects in a more precise
manner. Moreover, we allow for local FDI, as well as trade, to act as additional potential
channels of R&D spillovers.
Another major advantage of our data is that it is exhaustive, allowing us to measure
all R&D activity performed within Ireland over our sample period, rather than for just a sub
sample of plants, and hence is able to capture all potential spillovers arising from local
R&D activity. 3 We also avail of information regarding the nationality of ownership for each
plant so that we are able to study domestic Irish plants and foreign affiliates based in
Ireland separately. Furthermore, given that we have the exact nationality of foreign
affiliates, we can link the productivity performance of foreign affiliates based in Ireland with
the R&D activity in their home country using OECD data on sectorlevel R&D activity. This
allows us to analyse the role of foreign affiliates as vehicles for transmitting international
R&D spillovers originated in their home country.
It should be noted that the use of plantlevel data has been argued to represent a
clear advantage over studies using aggregate FDI flows data at the sector level given that
it provides a more precise measure of the influence of foreign presence on indigenous
plants. In particular, an issue that has been traditionally faced by empirical researchers
willing to consider trade and FDI simultaneously as channels for international R&D
spillovers, is that these two variables are usually highly correlated, making it difficult to
consider them jointly for empirical testing; see Mohnen (1996) and Keller (2002). We are
able to circumvent this limitation by measuring the influence of FDI through their local
presence instead of more aggregate FDI flows.
Ireland serves arguably as a particularly good casestudy to measure the influence
of foreign technological activity on local productivity levels because R&D spillovers have
been shown to be traditionally more important for small rather than for large countries; see,
for instance, Pottelsberghe de la Potterie and Lichtenberg (2001). Moreover, foreign plants
in Ireland have been responsible for the largest share of R&D activity, representing
approximately 70% of R&D spending over the period considered here. Nevertheless,
despite the well known high growth rates of productivity in the Irish manufacturing sector,
total R&D activity has been by international standards relatively low, suggesting the
existence of other driving sources for productivity growth. 4 In this regard existing evidence
4 In particular, during the period 19851994, which corresponds to the period covered by the present study,
tends to suggest that trade and FDI have played a major role in promoting Irish
productivity over the past two decades or so. For instance, van Pottelsberghe de la
Potterie and Lichtenberg (2001) provide evidence for Ireland showing that tradeembodied
knowledge spillovers has been especially pronounced in Ireland compared to other OECD
countries. A possible reason for this result could be Ireland’s higher absorptive capacity of
foreign knowledge spillovers, as has been suggested by Acharya and Keller (2007). More
precisely, using US firm level data these authors find that Ireland is the primary beneficiary
of US spillovers, even more so than Canada, and estimate that the elasticity of US R&D
spillovers to be 46.5 per cent, compared to 24.5 per cent for the UK. Our analysis will allow
us to shed greater light on whether R&D spillovers may have really played such a role.
The rest of the paper is organised as follows, in Section II we provide a description
of the data used, in Section III we describe our main econometric results. Section IV
concludes.
2 Data Description and Summary Statistics
2 1 A. Data Sources
We utilise information from three data sources collected by Forfás, the Irish policy
and advisory board with responsibility for enterprise, trade, science, and technology in
Ireland. As details of these are provided in Appendix A we only outline their most
important attributes here. The first is the Forfás employment survey which is an
exhaustive annual plant level survey with information on the location, nationality of
ownership, sector of production, and yearly level of employment, and has been carried out
since 1972.
The second source of information is the Irish Economy Expenditure (IEE) Survey,
an annual survey of larger plants in Irish manufacturing with at least 2030 employees,
with a coverage rate varying between 60 and 80 per cent. This data set provides us with
information on the level of output, value added, the level of employment, total wages, and
the capital stock since 1990.
The most important data for the purpose of the current paper is the degree of R&D
activity, measured as expenditure on R&D, of firms in Irish manufacturing. For this we are
able to draw on Forfás’ plant level Research and Development Surveys 1986, 1988, 1990,
1991, 1993, and 1995, and Innovation Surveys 19901992 and 19941996, which collect
information on R&D activity within Irish manufacturing. Importantly, these surveys are
believed by Forfás to cover all R&D active firms, except for 1994, and thus can be argued
to be exhaustive with regard to these seven years.
In terms of using these three data sources in conjunction with each other one
should note that Forfás provides each plant with a unique numerical identifier, which
allows one to link information across data sources and years. For our econometric
analysis we use the employment data for identifying the population of plants in each of the
relevant years and the R&D/Innovation surveys for identifying the subset of the population
which are R&D active and the extent of their activity. The IEE then allows for a subset of
these total factor productivity to be calculated.
We use OECD data on R&D and bilateral trade between Ireland and its main OECD
partners to measure global R&D spillovers. The countries for which R&D data is available
in the ANBERD database are Australia, Belgium, Canada, Denmark, Finland, France,
Germany, Italy, Japan, the Netherlands, Norway, Sweden, the UK and the US. These
countries also constitute the main origins of FDI in Irish manufacturing industry since they
cover over 90% of total foreign employment in the industry. One should note that the
OECD provides data on R&D activities by sector only at the ISIC 2 digit level, which gives
us 21 sectors (shown in Table 1). Since we want to consider internationally as well as
locally generated R&D spillovers simultaneously, we are thus limited to using this sector
classification throughout our analysis.
2 2 Calculation of Total Factor Productivity
Following Hall and Mairesse (1995), we base our empirical specification on a
productionfunction framework. An important issue in measuring plant level total factor
productivity is how to deal with the endogeneity of input choices, including R&D. More
precisely, if a plant can observe at least part of its total factor productivity early enough
then it may choose to change its factor inputs, making direct estimates of productivity from
regressing output on inputs biased. In a novel approach, Olley and Pakes (1996) use a
structural model of firm dynamics to derive an estimation procedure that allows one to
overcome this problem. This method provides robust estimation of the production function
allowing for endogeneity of some of the inputs and controlling for unobserved quasifixed
differences across plants. In the context of R&D, one problem with the Olley and Pakes
(1996) procedure is, however, that arguably investment in R&D may have an effect on the
distribution of future productivity realizations. If this were the case, then not taking account
of this could result in inconsistent estimates even under the Olley and Pakes (1996)
procedure. 5 In this regard, Buettner (2003) has recently proposed an extension of the
Olley and Pakes (1996) model incorporating R&D, and derived a revised estimation
technique of total factor productivity. As Griffith et al (2007), we implement this extended
approach, details of which are given in Appendix B on our data.
5 One should note that this problem is also present in Levinsohn and Petrin’s (2003) extension of the Olley
2 3 Local R&D Stocks
We are specifically interested in whether there are ‘spillovers’ from local and
international R&D on plant level productivity. In this regard we assume, as Orlando
(2004), a production function where plantlevel R&D and R&D local spillovers related to
the R&D activity of other plants belonging to the same industry influence productivity. Also
following Orlando (2004), we distinguish between sectoral and geographical proximity,
where sectoral proximity depends on whether plants belongs to the same sector of activity,
while geographical distance is measured by the distance in kilometres between each pair
of plant.
Our measure of R&D pool therefore combine the geographical dimension , sector
dimension and nationality of ownership of the plant responsible for the R&D spending.
Throughout the rest of the paper the R&D pool variables will therefore be assigned a
superscript indicating whether the R&D is done in Ireland (IE) or outside Ireland (OECD or
US). The superscript will also indicate, when relevant, whether the R&D performed in
Ireland is done by domestic (D) or foreign plants (F). The geographical and sectoral scope
of the R&D pool are indicated in the subscripts depending on whether the R&D is done
inside or outside a given geographical area (where SA stands for same area and OA
stands for other areas) and within or outside a given sector of activity (where SS stands for
same sector and OS stands for other sector).
In order to construct our local R&D pool we consider an area A around each plant
and sum all relevant R&D stocks within this area, where the relevant stocks are the
cumulative value of R&D expenditure of existing plants since 1986 depreciated at a rate of
15 per cent. We construct four R&D spillover variables: IE SA SS
RD , is the total R&D pool in the
same sector (SS) in the same area (SA) by other plants located in Ireland (IE), IE OA SS
the total R&D stock in the same sector but outside the area (OA), IE SA OS
RD , is the total R&D
pool in other sectors of activity (OS) in the same area, while IE OA OS
RD , , is the total R&D pool
in other sectors of activity outside of the area – each measured as total R&D pool per
square kilometre in 1995 values. Thus the sum of these four proxies constitute the total
R&D stock in Ireland – except for a plant’s own R&D pool which is excluded.
Of particular importance is the definition of area A. In this regard our data provides
us with information on the location of all plants in terms of geographical areas termed
DEDs. These DEDs have, on average, an area of 21 km 2 (standard deviation of 14 km 2 ),
which, for Ireland, represents 3440 spatial units see Map 1. Since we do not have the
exact address of plants within DEDs we follow the suggestion made by Duranton and
Overman (2004) and randomly allocate each plant to a unique coordinate within their DED.
Using this coordinate we can then ‘draw’ a plantspecific circle with a given radius r for
each plant and consider this the appropriate area A that allows us to construct our location
specific spillover variables. Therefore, contrary to previous studies on R&D productivity
spillovers, as for example Orlando (2004) 6 , the geographic dimension considered here is
based on a close approximation of the actual location of plants. One should note that this
implies that the four spillovers variables can differ across plants by the fact that each plant
is assigned a different location. The local R&D stocks variables are therefore timevarying
plantspecific variables likely to capture the influence of geographical distance on local
R&D spillovers. 7 The location of plants across Ireland are shown for 1995 in Figure 2. As
can be seen, while there is some dispersion, there is also considerable agglomeration,
particular around the major cities in Ireland (Cork, Dublin, Galway, and Limerick).
6 Orlando (2004) has for his US data the county at firmlevel and assigns these to countycentres to calculate
out distances between plants.
7 Moreover, one should keep in mind that, depending on the location of the plant and the definition of radius
2 4 Global R&D Stocks
In order to capture international R&D spillovers we consider R&D activities outside
of Ireland in terms of those OECD countries for which R&D data was available for the
same sectors of activity and the time period we use. In this regard, we follow Coe and
Helpman (1995) and the extension proposed by Lichtenberg and van Pottelsberghe de la
Potterie (1998) who use trade data in order to obtain a weighted measure of R&D
spillovers. These weights are given as follows:
jt IE
jt c jt
c PROD
IMPORT w
, ,
, = (1)
where IMPORTc,jt are import of Ireland in goods in sector j coming from country c at a
given year t, and PRODIE,jt is the corresponding production level for this specific industry in
Ireland. Using these weights we calculate our measure of international R&D pool for a
given sector j at a given year:
å
=
c
t c
OECD w RD
RD (2)
where RDct is the R&D stock of country c at time t and is calculated as the cumulative sum
since 1986, deprecated at a rate of 15 per cent. The variable RD OECD measures therefore
the foreign stock of R&D and is used to capture the R&D spillovers embodied in trade
between Ireland and its main OECD partners. The idea behind using trade flow intensity
as a weighting scheme is that foreign R&D stock will influence domestic productivity levels
if trade is particularly intensive with Irish trade partners that are also R&D intensive.
However, because such measure have been shown to be sensitive to potential bias 8 , we
also experimented with using the geographical distance between Ireland and its OECD
partners as a weighting scheme for international R&D spill in a way similar to Keller
(2002). The results obtained in this case were fairly similar to those of our benchmark
measure so that we only report the latter.
2 5 Descriptive Statistics
Combining all our data sets resulted in a sample of 1790 plants with 4308
observations for the period 1990 through 1995, excluding 1994. Of these 22 per cent were
R&D active over our sample period, and 29 per cent were foreign affiliates. Table 1
provides some summary statistics of R&D activity and foreign presence by sector of
activity for our sample. As can be seen, only 12% of plants have declared R&D spending
over the period considered. Nevertheless, there is considerable across sector
heterogeneity in the degree of R&D activity, where this is highest in industries generally
considered to be technology intensive, such as Motor Vehicles, Radio & TV, Chemicals
and Rubber Plastics, well as Electrical Machinery NEC.
Columns 2 and 3 of Table 1 provide the percentage of, respectively, total
employment and total R&D due to foreign plants. Accordingly, foreign companies employ
35% of the total workforce, but constitute nearly 70 per cent of all R&D activity. As a matter
of fact in some sectors, such as the Tobacco, Chemicals, Rubber and Plastics, Medical
and Precision instruments sectors, nearly all of R&D is undertaken by foreign affiliates.
Nevertheless, there are some sectors, such as Food & Drinks, Pulp & Paper, Clothing and
Basic Metals, where the percentage of R&D done by domestic plants is substantially
higher than their foreign counterparts. One may want to note that these also tend to be the
more lowtechnology intensive industries.
It is also of interest to examine the R&D intensity of domestic and foreign R&D
active plants, where R&D intensity is measured as the R&D spending per employee.
intensity of foreign plants is in general much higher than for domestic plants, except for
sectors such as Computers and Office Machinery and Electrical Machiney nec.
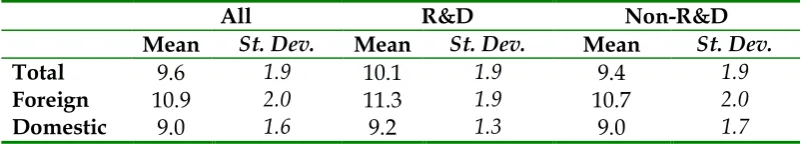
Table 2 provides summary statistics concerning the productivity level of foreign and
domestic plants, where we also distinguish within these categories between those that
conduct R&D and those that did not over our sample period. Firstly, one may want to note
that on average productivity levels of R&Dactive plants are higher than those of nonR&D
plants, independently of their nationality of ownership. The statistics also reveal that
foreign plants that perform R&D have higher mean productivity levels compared to
domestic ones.
3 A. Econometric Analysis
3 1 Econometric specification
The main focus of this paper is to measure the impact of R&D spillovers, both local
and international, on plants’ productivity. Our benchmark equation to be estimated is
similar to that in Griffith et al (2007) and given by: ) 3 ( , 6 , 5 , 4 , 3 , 2 1 it ijt jt OECD it IE OA OS it IE SA OS it IE OA SS it IE SA SS PLANT it it X RD RD RD RD RD RD TFP m l b b b b b b a + + + + + + + + =
where TFP is total factor productivity, RD PLANT is a plant’s own R&D stock,
( IE
SA SS
RD , , IE OA SS
RD , , IE SA OS
RD , , IE OA OS
RD , ) are the local spillovers variables, RD OECD is the global
(or international) spillover variable, X is a vector of other control variables, m is an error
term, and i, j, and t denote subscripts for plant, industry, and time varying variables. One
should note that we have summarised definitions of all our variables used throughout our
econometric analysis in Appendix C.
An important aspect to consider in terms of the estimation of (3) is that m should not
One should note in this respect that TFP is, conditional on the appropriateness of the
underlying structural model, by construction an unbiased estimator of total factor
productivity and controls for unobserved quasifixed differences, as outlined in Section II
and detailed in Appendix 2. Similarly, as noted by Griffith et al (2007), RD PLANT , i.e., a
plant’s own R&D stock, can be argued to be exogenous. With regard to our local spillover
proxies one should recall that these by construction exclude a plant’s own R&D stock.
Nevertheless, there may be other productivity enhancing, geographic factors that are the
driving force behind location choices of plants and their decision to spend on R&D. In
particular, the economic geography and regional growth literature has provided evidence
on the role played by agglomeration economies on the location of innovative and R&D
intensive activities and on productivity levels; see Ciccone and Hall (1996) and Audretsch
and Feldman (1996). In order to control for such agglomeration economies, we follow
Ciccone and Hall (1996) and include as a control variable the employment density within
the same area, EDENSITY SA . We also take account of sector specific business cycles with
the sectoral employment growth rate, denoted as SEGROWTH. Finally, we include year,
sector, and county dummies to control for unobservable time specific, sector specific time
invariant, and county specific time invariant determinants of productivity, respectively. 9 10
Given that we can be fairly confident that all our control variables in are exogenous,
we estimate (3) using OLS. An alternative approach may have been to estimate
productivity directly by including all factor inputs in (3) and using value added as the
dependent variable and employing the GMM estimator proposed by Blundell and Bond
9 Note that countries are different from the DEDs areas and cover much broader areas. Ireland is divided into
27 counties.
10 While, given our set of controls and the fact that the spillover variables exclude a plant’s own R&D, our
(1998). 11 However, given the lack of variation over time for our very short panel this
approach would not have been feasible.
Another important issue in estimating (3) is that for some of the determinants of
plantlevel productivity we are examining the effect of more aggregated (mostly sectoral
and regional) level variables on plantlevel productivity. As shown by Moulton (1990),
because standard errors are likely to be correlated for observations within more
aggregated units their estimates may be biased downward under OLS. In order to take
account of this we follow Bertrand et al (2003) and instead implement an alternative test
derived from block bootstrapping. More precisely, let β * be the estimated coefficient under
OLS, se(β * ) its standard error, and t the resultant tstatistic. We construct a bootstrap
sample by drawing observations with replacement from all geographical areas and
sectoral units, then run OLS on this sample, obtain the estimate β b , and construct the
absolute tstatistic:
) (
) ( *
b b b
se abs t
b b b -
= (4)
Drawing 500 boostrapped samples and subsequent values of the absolute tstatistic, we
reject the null hypothesis that β=0 at the 95 per cent confidence level if 95 per cent of the
t b are smaller than t. We report relevant pvalues for this test in all our estimations. 12
11 One should note that Griffith et al (2007) also experiment with this alternative approach in their study, but
find similar results as in using OLS the Buettner (2003) version of the Olley and Pakes productivity proxy.
12 We also experimented with allowing the error terms to be correlated within DEDs and sectors as
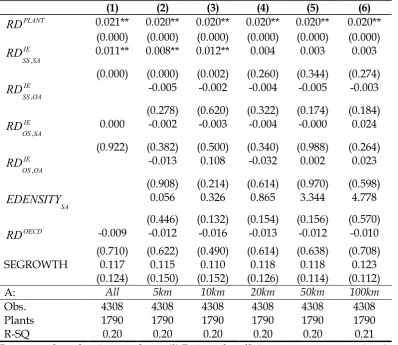
3 2 Econometric Results
We start off by abstracting from any nationality of ownership differences and
estimate (1) for our total sample of plants for various specifications in Table 3. In the first
column we also initially ignore any local dimension of the R&D stock within Ireland and
consider the area A to be the whole of Ireland, so that IE SA SS
RD , and IE SA OS
RD , measure just
the sum of the total stocks of R&D in the same and outside of the sector, respectively, of a
plant and we thus do not need to include IE OA SS
RD , and IE OA OS
RD , . As can be seen,
reassuringly, own R&D stock has a positive and significant effect on productivity. One
also finds that the total R&D stock within the sector increases a plant’s productivity, while
this is not the case for R&D done in other sectors. In other words, there are intra but no
intersectoral R&D spillovers. Our measure of the international stock of R&D, LP, has,
however, no significant impact. Similarly sectoral business cycles do not affect plants’
productivity.
In the remaining columns of Table 3 we then decompose both the within and
outside of the sector R&D stocks into that located internal and that external of some pre
defined area, measured as a circle of a given radius around a plant. We first start off with
a relatively small area, namely a 5km radius circle, the results of which are shown in the
second column. One should note that we also include all other appropriate regional
controls to ensure that our within the same sector/area spillover proxies are not capturing
any other sectoral and/or area effects, as discussed earlier. As can be seen, from all our
geographical variables, only IE SA SS
RD , , i.e., the local R&D stock of plants operating in the
same sector, is a significant determinant of productivity. This result implies that
geographical distance matters in terms of benefiting from R&D spillovers, at least at a very
indicates that technological distance matters, although, given our level of sectoral
aggregation, in a relatively broad sense.
In columns 3 through to 6 we then proceeded to enlarge the circle along predefined
radiuses, namely to 10, 20, 50, and 100kms. 13 As can be seen, enlarging the circle to a
10 km radius provides qualitatively identical results to that of 5km. Moreover, the
coefficient on IE SA SS
RD , increases by about 50 per cent, indicating that the full extent of
spillovers from local R&D are not completely captured within a 5km radius circle.
However, further increasing the size of the circle around plants not only substantially
reduces the size of the coefficient, but also renders it insignificant – as is apparent from
columns 4 through 6, where r was set at 20, 50, and 100 km, respectively. These results
thus strongly indicate that R&D spillovers are spatially bounded at a relatively short
distance. In contrast, no matter what specification, we find no support for plants benefiting
from international spillovers, at least as measured by RD OECD .
One obvious problem with pooling all our data is that one is abstracting from the
heterogeneities across plants, where these could potentially mean differences in the ability
to benefit from R&D spillovers. For example, in Ireland it is well known that foreign
multinationals constitute an important presence. However, foreign multinationals are
generally assumed to be more technologically advanced than domestic plants and serve
as transmitters of new technologies, see Görg and Strobl (2001) and Görg and Greenaway
(2004) for a review of the literature. Multinationals thus may have greater absorptive
capacity to benefit from technological spillovers than their domestic counterparts and may,
eventually, transmit new knowledge and technological improvements to the local economy
13 One should note in this regard, that while we report only results for these, we also experimented
via their activity and interactions with local companies. 14 As discussed by Keller (2004),
FDIspillovers may thus be considered, like R&D spillovers, as a potential channel
favouring knowledge transfer across national boundaries.
It must be noted, however, that in such economies like the Republic of Ireland
foreign multinationals are often suspected to mainly use the host country as a means to
entering the European market, so that international R&D spillovers may be much more
important than local ones if market access and trade is considered as an important
channel for transmitting R&D spillovers. 15 Even if this were not the case, one would
normally expect multinational firms to have more access to global knowledge pools given
the relationships between different plants belonging to the same multinational, see Keller
(2004). Indeed, this latter argument is similar to the one made in the case of plants
belonging to the same firm but located in different places within the same country. For
instance, Adam and Jaffe (1996) show that plants belonging to the same company benefit
from firmlevel R&D activity. It follows then that, when measuring the benefits of R&D
investment and R&D spillovers on plants' productivity, one is likely to miss an important
part of the story if one only looks at ownplants and local R&D stocks, especially in the
case of multinationals. However, the aforementioned authors also find that R&D spillovers
are negatively influenced by distance decay effects and vanish as the number of plants
belonging to the same company grows. This argument may also apply here since foreign
affiliates based in Ireland may simply constitute a small link in the whole production
process of multinationals and be producing products very different from that of (very
distant) plants located in other countries. Adam and Jaffe (1996) call this the ‘dilution’ of
R&D across multiple plants.
14 See Barrios et al. (2006) for an analysis of the local dimension of FDIrelated spillovers in the Irish case.
15 Indeed, on average, the largest proportion of total output of foreign multinational based in Ireland is for export
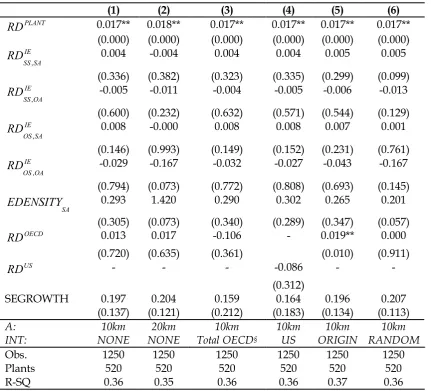
To further investigate the potentially different role of local and international R&D for
foreign affiliates based in Ireland we reestimated our base specification where the local
area is defined by a 10 km radius in the first column of Table 4 for this subsample. 16 The
results show that, while own R&D remains significant, there is, in contrast to the overall
sample, no longer any trace of local R&D spillovers. This lack of spillover effects
continues to hold when we enlarge the circle to anything greater than a radius of 10km,
although we only report results for r equal to 20km. As argued above, this may be in part
because for foreign multinationals the international R&D stock may be much more
important than the local one. However, as with the overall sample, the measure of
international R&D pool, RD OECD remains insignificant.
One of the problems with the variable RD OECD is, of course, that it only allows for
trade as a channel to benefit from international R&D activity, while foreign multinationals
may arguably have a much stronger direct link into the global technological community.
We thus additionally proxied the total global technological knowledge pool available to a
foreign plant with the total R&D stock within a sector in the OECD without using trade
weighting scheme described in equation (8). As can be seen from the third column of
Table 4, this variable similarly shows no significant impact of productivity. Since the US is
often argued to be the technological leader in many manufacturing sectors we further
experimented with only using the US stock of R&D within the same sector as a measure of
potential spillovers. Again, however, this alternatively measure, shown in the fourth
column, remains insignificant.
One could also argue, as discussed earlier, that multinationals may be much more
likely to be able to tap into the technological pool of their origin country rather than that of
the global community. To proxy for this we thus alternatively used only the R&D stocks
within the same sector of the origin country described in Section III as potentially spillover
creating, the results of the inclusion of this are shown in the fifth column of Table 3. 17
Supportive of our proposition, the origin country specific measure displays a significant
positive coefficient, thus suggesting that foreign multinationals do actually benefit from
spillovers from R&D activity generated within their sector in their origin country.
As a robustness check of this latter result, we use the same variable but this time,
for each Nace 2 digit sector, randomly distribute its values across countries. In doing this
we follow the idea developed by Keller (1998) concerning the influence of international
R&D spillovers through trade found by Helpman and Coe (1995). Keller argues that by
matching countries depending on their trade link, one is likely to capture otherthantrade
related R&D spillovers. In order to make his point, Keller considers instead randomly
allocated bilateral trade flows and still find a positive and significant influence of R&D
spillovers suggesting that trade only provide part of the story and that other, more general,
mechanisms must be at play explaining the existence of international R&D spillovers.
Using a similar approach, we reassign OECD countries’ R&D stock by sector by
distributing randomly the country of origin of the foreign affiliate for a given sector of
activity. 18 Reassuringly, our results from the final column of Table 4, where the coefficient
is now insignificant, however, suggest that the country of origin of foreign affiliate located
in Ireland positively influence their productivity level. 19
Our arguments for why multinationals may differ in their ability to benefit from R&D
spillovers of course also provide justification for separately examining domestic plants and
we do so in Table 5. First of all one should note that, as for foreign plants, their own R&D
17 As indicated in Section II, these countries are Australia, Belgium, Canada, Denmark, Finland, France, Germany,
Italy, Japan, the Netherlands, Norway, Sweden, the UK and the US and nearly concern all the foreign presence in Irish manufacturing for the period considered.
18 The approach used for the random distribution of countries of origin is…[put reference here]
19 We also repeated this experiment with alternative random distribution and still found insignificant results. Result
stock significantly increases productivity. In contrast, international R&D as measured by
OECD
RD is not a significant determinant. In this regard, we also experimented with using
the total OECD R&D stock without the tradeweighting scheme, but similarly the coefficient
was insignificant.
In terms of our measure of local spillovers, we find for domestic plants that the R&D
stock of plants operating in the same sector within a 10 km radius has positive effects on
productivity. Increasing the local area to any greater radius makes, these spillover effects
vanish, however, although we only report results for r equal to 20km. Thus, local spillovers
are shown here again to take place within a fairly narrow geographic scope. This also
suggests that the general results found in Table 3 when considering all plants (i.e.,
domestic and foreign plants together) was in fact driven by the domestic rather than
foreign plants in the sample. Another potentially interesting finding is that in the first
column of Table 5, where the local area of reference is defined by a circle of a 10km radius
around a given plant, the coefficient on IE SA OS
RD , 1 is significantly negative – in other words,
local R&D activity by plants in other sectors reduces productivity. A possible reason for this
may be that greater local R&D activity may put a strain on local inputs, such as skilled
labour. While this appears to be compensated for by positive spillovers for R&D that is
technologically close, this is not the case for knowledge created that has relatively little to
do with a plant’s own production process. One may want to note in this regard, that once
one considers these two countervailing forces, the overall benefits per square kilometre
are close to zero, indicated by the relative size of the coefficients of these two variables.
As suggested by the FDI literature, many domestic plants simply may not have the
absorptive capacity to benefit from R&D done by neighbouring foreign multinationals. In
contrast, they may potentially benefit from innovative activity of similar domestic plants.
separately, as shown in the third column of Table 5, where these are indicated by “F” and
“D” subscripts. 20 Our results of this exercise displayed in Column 3 of Table 5 show that
while the same sector/same area foreign R&D stock ( IE F SA SS
RD , 1
, ) is insignificant, the
coefficient on the domestic counterpart ( IE D SA SS
RD , 1
, ) not only is significant, but also is 20 per
cent larger than for the total R&D stock measure. However, again the negative spillovers
from innovative activity of other domestic plants in other sectors essentially outweighs any
per square kilometre benefits. Also, further increasing the size of the local area to a 20km
radius again renders any local domestic R&D spillovers insignificant, thus indicating that
the scope for geographical spillovers takes place within in a relatively small distance.
It is important to note that in Ireland many domestic plants act as intermediate
suppliers to foreign multinationals, and that such a direct link may make distance less
relevant for R&D spillovers. We thus increased the spatial scope of the area for which
such spillovers from local FDI may take place, while holding the scope of domestic
spillovers to occur within a 10km radius. In addition to redefining the other local foreign
controls accordingly, we also additionally included a measure of local employment density
for this greater locality. The results shown in columns (5) and (6) of Table 5 for areas of
both 20 and 50 km (as well as using other nonreported larger radiuses) suggest that
different geographical scopes by nationality are not likely to be the cause behind the lack
of spillovers from foreign R&D. Interestingly, though, the employment density variable
displays a positive and significant coefficient, suggesting the presence of wider
agglomeration economies which are not necessarily related to R&D activities, in line with
the findings of Ciccone and Hall (1996).
20 One should note that while we, in order to simplify the readability, only report the results when decomposing the
R&D spillovers for the same sector (i.e., IE SA SS
RD , and IE OA SS
RD , ) into its domestic and foreign component, we also
As discussed earlier, by definition multinational plants are part of a greater multi
plant corporation, where the headquarters and other affiliates are located outside Ireland.
Thus, R&D activity in Ireland may only be a small part of total R&D expenditure by the
entire operation of a given multinational and hence a poor proxy of the total local foreign
pool of innovative knowledge that domestic plants can potentially tap into. In this regard,
one would ideally like to know how much R&D done within the entire global operation for
all foreign affiliates located in Ireland – information that is, unsurprisingly, not available to
us. Instead we use as a proxy for the total local knowledge available from foreign plants
located near a domestic plant the total R&D stock within the same sector in the origin
country of the foreign plant. One should note in this regard that the results from our
foreign plant sample provided some evidence that this may not be an unreasonable proxy
of the knowledge pool that a foreign affiliate in Ireland has access to.
To arrive at a measure of the total potential local foreign knowledge pool for each
plant we weight and sum the OECD R&D stocks by the relative share of total foreign
employment of the relevant foreign plants within the same geographical area and the
same sector of activity. Omitting, for convenience sake, the sector of activity subscript, the
measure of R&D pool is therefore:
OECD SA SS
RD , =
å
c c A c
RD ,
a (5)
where
A A c A
c EMP
EMP ,
, =
a
and a C,A is the share of employment in a geographic area A by multinationals of nationality
from a country c for a given sector of activity j and where EMPc,A and EMPA are the
employment level of all multinationals from country C in area A and the level of total
pool outside the area A, OECD OA SS
RD , . As before, given that the geographical areas considered
are plantspecific and based on distance measured between each pair of plant, these
variables defined are unique for each plant considered. 21
The results of including OECD SA SS
RD , and OECD
OA SS
RD , where the local area is defined as
falling within a 10km radius are shown in the first column of Table 6. As can be seen,
there is no evidence of any spillovers arising from access to the foreign pool of R&D via
the local foreign affiliates. In line with our previous argument, we also allowed for a
greater geographic scope of foreign R&D spillovers for domestic plants by systematically
increasing this radius for columns (2) through (6), while holding the size of domestic
locality constant. Accordingly, while there is still no sign of productivity benefits arising
from being `close’ to innovative foreign multinationals when one moves from 10 to 20 and
then to 50 km, once the circle around each plant is enlarged to 100km, one finds a positive
and significant coefficient on our variable of interest, OECD SA SS
RD , 2 . Further enlarging A2 to
200km radius means further increasing the value of the coefficient on OECD SA SS
RD , 2 from
0.004 to 0.027, while remaining significant. It is also noteworthy that this coefficient is
higher than that on the local R&D spillovers emanating from R&D undertaken by domestic
Irish plants. However, an additional increase to a radius of 300km renders it insignificant. 22
This thus suggests that once one allows for the possibility of access to the knowledge pool
of the origin country via local foreign presence and a greater geographic scope than for
domestically produced R&D stock, domestic plants can indeed benefit from R&D spillovers
arising from local multinationals.
21 Note that, in order to keep to the presentation of our results short we have omitted here the inclusion of the same
variables as defined in (5) but for other sectors of activity. The results presented here are similar enough such that we
preferred reporting only those including the OECD
SA SS
RD , and OECD
SA SS
RD , variables.
4 Concluding Remarks
In this paper we linked local and global knowledge spillovers to analyse their impact
on plants' productivity using the case study of Ireland. Arguably our paper provides a
number of contributions to the existing literature on R&Drelated spillovers. For one, we
believe it to be the first to test the existence and relative importance of both local and
global R&D spillovers in the context of productivity analysis at plant level. Secondly, while
possible interactions between the two types of spillovers have been left untouched by
existing empirical studies, our paper shows that these interactions do exist and are
especially important for domestic plants.
Our results show that while domestic plants benefit from local R&D spillovers, these
spillovers are spatially bounded. Furthermore, domestic plants do not appear to benefit
from R&D done by foreign affiliates based in Ireland. This finding can be related to
Cassiman and Veugelers (2004) who find for Belgium that foreign affiliates do in fact
generate less local transfers of technology than their domestic counterparts once superior
access to international technology markets is accounted for. We also discover that there
can be interactions between two major, as advocated by Keller (2004), channels of
knowledge spillovers, namely FDI and international R&D activity. In particular, the
evidence here suggests that foreign affiliates allow domestic plants to tap into their
countries’ knowledge pool through their presence on the local market rather by their own
local R&D activity. Moreover, this positive, indirect, effect of foreign presence also
deteriorates with geographical distance, where its geographical scope is much wider than
that derived from R&D spillovers from other indigenous plants. In contrast, we find no
evidence that foreign multinationals in Ireland are recipients of local R&D spillovers, but do
5 Tables
Table 1: Summary Statistics
Sector (1)
R&D plants (% of total)
(2) Empl. of For.
plants (% of total)
(3) R&D of For.
plants (% of total)
(4) R&D intensity Dom. plants (5) R&D intensity For. plants
Food Pr. & Drinks 0.08 0.27 0.24 0.29 0.32
Tobacco Pr. 0.10 0.84 1.00 0.00 0.11
Textiles 0.11 0.39 0.59 0.24 0.18
Clothing 0.11 0.21 0.06 0.13 0.09
Wood Pr. & Cork 0.04 0.28 0.57 0.08 0.21
Pulp, Paper, etc. 0.12 0.17 0.10 0.38 0.13
Publish., Printing 0.06 0.07 0.14 0.07 0.43
Chemicals 0.22 0.36 0.83 0.44 2.94
Rubber & Plastic 0.22 0.38 0.88 0.51 2.84
O. NonMet. Mi. 0.05 0.11 0.12 0.13 0.32
Basic Metals 0.15 0.39 0.04 0.27 0.14
Fabricated Metal 0.06 0.15 0.26 0.09 0.88
Mach. & Equ. nec 0.11 0.22 0.41 0.58 1.01
Comp. & Off. M. 0.17 0.80 0.64 0.94 0.94
Elect. Mach. nec 0.20 0.60 0.48 1.49 0.71
Radio, TV, etc. 0.36 0.70 0.68 0.90 1.01
Med.& Prec. Instr., etc. 0.19 0.81 0.80 0.87 3.05
Motor Vehicles 0.31 0.57 0.76 1.38 3.23
O. Transp. Equ. 0.09 0.38 0.32 0.34 0.54
TOTAL* 0.12 0.35 0.69 0.32 1.36
(1) % of plants doing R&D
(2) % of employment in foreignowned companies (3) % of R&D in the sector done by foreign companies
(4) R&D spending per employee in thousands euros (1986 prices)
(5) R&D spending per employee in thousands euros (1986 prices)unweighted mean values
Table 2: TFP Measure
All R&D NonR&D
Mean St. Dev. Mean St. Dev. Mean St. Dev.
Total 9.6 1.9 10.1 1.9 9.4 1.9
Foreign 10.9 2.0 11.3 1.9 10.7 2.0
[image:28.595.97.498.621.693.2]Table 3: All Plants
(1) (2) (3) (4) (5) (6)
PLANT
RD 0.021** 0.020** 0.020** 0.020** 0.020** 0.020**
(0.000) (0.000) (0.000) (0.000) (0.000) (0.000)
IE SA SS
RD , 0.011** 0.008** 0.012** 0.004 0.003 0.003
(0.000) (0.000) (0.002) (0.260) (0.344) (0.274)
IE OA SS
RD , 0.005 0.002 0.004 0.005 0.003
(0.278) (0.620) (0.322) (0.174) (0.184)
IE SA OS
RD , 0.000 0.002 0.003 0.004 0.000 0.024
(0.922) (0.382) (0.500) (0.340) (0.988) (0.264)
IE OA OS
RD , 0.013 0.108 0.032 0.002 0.023
(0.908) (0.214) (0.614) (0.970) (0.598)
SA
EDENSITY 0.056 0.326 0.865 3.344 4.778
(0.446) (0.132) (0.154) (0.156) (0.570)
OECD
RD 0.009 0.012 0.016 0.013 0.012 0.010
(0.710) (0.622) (0.490) (0.614) (0.638) (0.708)
SEGROWTH 0.117 0.115 0.110 0.118 0.118 0.123
(0.124) (0.150) (0.152) (0.126) (0.114) (0.112)
A: All 5km 10km 20km 50km 100km
Obs. 4308 4308 4308 4308 4308 4308
Plants 1790 1790 1790 1790 1790 1790
RSQ 0.20 0.20 0.20 0.20 0.20 0.21
Table 4: Foreign Plants
(1) (2) (3) (4) (5) (6)
PLANT
RD 0.017** 0.018** 0.017** 0.017** 0.017** 0.017**
(0.000) (0.000) (0.000) (0.000) (0.000) (0.000)
IE SA SS
RD , 0.004 0.004 0.004 0.004 0.005 0.005
(0.336) (0.382) (0.323) (0.335) (0.299) (0.099)
IE OA SS
RD , 0.005 0.011 0.004 0.005 0.006 0.013
(0.600) (0.232) (0.632) (0.571) (0.544) (0.129)
IE SA OS
RD , 0.008 0.000 0.008 0.008 0.007 0.001
(0.146) (0.993) (0.149) (0.152) (0.231) (0.761)
IE OA OS
RD , 0.029 0.167 0.032 0.027 0.043 0.167
(0.794) (0.073) (0.772) (0.808) (0.693) (0.145)
SA
EDENSITY 0.293 1.420 0.290 0.302 0.265 0.201
(0.305) (0.073) (0.340) (0.289) (0.347) (0.057)
OECD
RD 0.013 0.017 0.106 0.019** 0.000
(0.720) (0.635) (0.361) (0.010) (0.911)
US
RD 0.086
(0.312)
SEGROWTH 0.197 0.204 0.159 0.164 0.196 0.207
(0.137) (0.121) (0.212) (0.183) (0.134) (0.113)
A: 10km 20km 10km 10km 10km 10km INT: NONE NONE Total OECD § US ORIGIN RANDOM
Obs. 1250 1250 1250 1250 1250 1250
Plants 520 520 520 520 520 520
RSQ 0.36 0.35 0.36 0.36 0.37 0.36
Notes: (1) Boostrapped pvalues in parentheses. (2) Estimated coefficients on constant term, time (year) dummies, and sector (Nace 2 digit) dummies not reported. (3) A: Size of Area; PLANT: own plant R&D; IE: R&D performed in Ireland. SS: same Nace 2digit sector; OS: outside Nace 2digit sector; SA: same area; OA: outside area; EDENSITY: employment density; (4) ** and * signify statistical significance at the 1 and 5 per cent levels, respectively.
§ simple sum of R&D in OECD countries by sector, without considering the weighted scheme described in