RISK MANAGEMENT PRIORITIES FOR PROJECTS IN SAUDI
ARABIA: IDENTIFYING PROJECT RISK SOURCES AND
POTENTIAL CONSEQUENCES
1
Taghreed M.H. Mango, 2Naill M. Al Momani 1,2
Business Administration Department-Faculty Of Economics And Administration- King Abdul Aziz University- Jedda, Saudi Arabia.
ABSTRACT
This paper investigates potential risk sources for projects in Saudi Arabia through different perspective of owners, and contractors, as well as consultant in order to understand the risk contributors and be able to manage such risk. Therefore, we identify risk sources through literature review, preparing survey questionnaire, collecting and analyzing data, and finally draw a clear picture of risk priorities in projects for Saudi Arabia.
Responses from 269 participants were received, among which 23 discarded due to not complete information and the rest of 246 participants were analyzed, summarized and reported for each type of projects objectives in terms of cost, time, quality, and environment, as well as safety. In order to understand different perspectives of projects owners, contractors, and consultants we reanalyzed responses to measure the significance score index for each risk sources. 25 participants were for owner, 87 for contractors, 29 for consultants, and 33 for participants without specifying their roles in projects.
It is clear that there are differences in risk significance index for each risk sources for different project stakeholders. Such differences might shift available resources to mitigate their consequences. Therefore, a consensus between stakeholders should be established early in project planning process through having quick survey to realize the most important risk contributors and be able to manage them accordingly with minimal impact on cost, time, quality, and safety, as well as environment.
1. INTRODUCTION
Risk is perceived as the potential for unwanted or negative consequences of an event or
activity, a combination of hazard and exposure. Recent researches tends to emphasize the
two-edged nature of risks, such as a threat and a challenge, the chance of something
happening that will have an impact on objectives; may have a positive or negative impact,
combination of the probability or frequency of occurrence of a defined threat or opportunity
and the magnitude of the consequences of the occurrence. This paper examines mainly the
negative impacts of risks inherent in projects through a combined consideration of the
likelihood of occurrence and the magnitude of consequence in Saudi Arabia.
Risk management is ‘a system which aims to identify and quantify all risks to which the
business or project is exposed so that a conscious decision can be taken on how to manage
the risks’ (Flanagan R, Norman, 1993). PMBOK included risk management as one of the nine focuses in project management and described it as ‘the processes concerned with
conducting risk management planning, identification, analysis, responses, and monitoring and
control on a project’. AS/NZS 4360 defined risk management as ‘the culture, processes and
structures that are directed towards realizing potential opportunities whilst managing adverse
effects’. Contractors and consultants may play major roles in identifying, analyzing,
mitigating, and controlling project risks, but project risk management is not a function that
the owner can completely delegate to contractors or to consultants with impunity. All projects
experience some degree of uncertainty, and some uncertainties can create risks to achieving
the project objectives. Project managers are inherently motivated to achieve the intended
project goals and meet the project objective in terms of time, cost, quality, and safety, aswell
as environment. Therefore they are motivated to manage project risks effectively through
identifying and prioritizing risk sources to be able to have proper mitigation measures to
prevent, reduce, and compensate human and financial losses. Flyvbjerg (2002) has argued
that there are times, especially in large projects, when project managers are motivated to
obscure or hide the risks inherent in a project. Uncertainty, as it relates to project
performance, cost, quality, and duration, comes from a lack of knowledge about the future. It
is neither objective nor measurable but rather based on subjective assessments, which can
decisions in an uncertain world and, in the absence of good historical data-bases, subjective
probability estimates are the only available measures of uncertainty. Projects continually face
new risks, which must be identified, analyzed, and understood in order to develop a
framework both for selecting the right projects to execute and for successfully executing
them. Thus project owners, sponsors, and managers are increasingly concerned with ways to
analyze risks and to mitigate them. March and Shapira (1987) observed risks, on the basis of
the following general characteristics:
Managers typically define risk as their exposure to loss.
Managers aren't necessarily interested in reducing project risks to a single number.
Instead, risks are considered multidimensional with the maximum exposure considered
for each risk dimension.
Managers are more likely to take risky actions when their jobs are threatened than when
they feel safe. The risks taken on a project are relative to the alternative options and
opportunities available. For example, contractors will take more risks (such as submitting
very low bids to buy jobs) when business is bad and their survival is under threat than
they are willing to take when they have ample backlogs.
Studies of projects with low and high degrees of uncertainty (see, e.g., Shenhar, 2001)
show that as uncertainty increases there is also an increased likelihood of the following:
Increased project budgets,
Increased project duration,
Increased planning effort,
Increased number of activities in the planning network,
Increased number of design cycles,
Increased number of design reviews,
Delayed final design,
Increased need for exchange of information outside of formal meetings and documentation,
Increased management attention and effort (probabilistic risk assessment, risk mitigation),
Increased quality management effort.
Alexopoulos et al. (2009) stated that decision makers perceive risks differently in various
situations, which is affected by factors such as early experience, education background,
personal beliefs, and culture. Those subjective perceptions cause variations in decision
making, making it impossible for people to make correct decision in all the situations in
pursuit of maximum expected value. Wang, J, Yuan, H (2010) studied the factors affecting
contractors’ risk attitudes in construction projects in China and the found that the ranking of
important factors affecting contractors' risk attitudes are the following of importance:
Consequences of decision making, engineering experience, completeness of project
information, sensitivity to external information, decision motivation, professional knowledge,
education background, scope of knowledge, boldness, judgment ability, company’s economic
strength, social experience, values, interest in the engineering, desire for decision objectives,
external economic environment.
Contractors’ risk attitudes are influenced and determined by many factors in construction
practice. It is neither practical nor necessary to identify and understand all related factors for
minimizing their influence on contractors’ risk attitudes. Lu et al. (2008) presents that a
smarter way is to identify some critical factors to help contractors to be more focused,
through which the usage of limited resources such as money, manpower, time, and
management efforts can be maximized. Santrock (2007) stated that we carry values with us
that influence our thoughts, feelings, and actions, but each individual possesses a unique
conception of values. It is the unique characteristic of values that makes contractors’ risk
attitudes different. For instance, contractors might tend to take risks if extra economic
benefits could be obtained by successfully addressing the risk problems, while those who are
more conservative might tend to pursue the success accomplishments of project objectives.
Shen et. al. (2006) conducted a study to understand the role of public and private partnerships
to manage risks in public sector projects in Hong Kong. In this study, it is found that
allocation of site acquisition risk and legal and policy risks to the public sector is more
effective while private sector could effectively allocate the design and construction risks,
operation risks and industrial action risk to the private sector. Also, development risks,
market risks, financial risks and force majeure could be shared effectively between the two
poor safety performance, poor quality and environmental performance in delivering public
sector project remain to large extent unchanged. Moreover, Flyvbjerg et al. (2002) examined
258 large transport infrastructure projects covering 20 countries, and they found that cost
overruns occurred in almost 90% of the projects examined, with the highest cost overruns of
86% and 28% on average.
A number of studies have been undertaken worldwide to identify the risks that affect the
performance of public sector projects for example, Arditi et. al (1985) . According to these
studies, risks affecting public sector projects can be grouped into the following major
categories:
Project-related risks: These risks include cost and time overruns, poor contract
management, contractual disputes, delays of tendering and selection procedures, poor
communication between project parties.
Government-related risks: These risks consist of inadequate approved project budgets,
delays in obtaining permissions, changes in Government regulations and laws, lack of
project controls, administrative interference.
Client-related risks: These risks include inadequate project budgets, poor project brief, variations in project specifications, delays in the settlement of contractor’s claims, lack of
project control.
Design-related risks: These risks represent inadequate soil investigation, delays in design,
ambiguities and inconsistencies in design and design changes.
Contractor-related risks: These risks include inadequate estimates, financial difficulties,
lack of experience, poor management, difficult in controlling nominated subcontractors.
Consultant-related risks: These risks represent lack of experience, performance delays,
and poor communication with other project parties.
Market-related risks: These risks include increase in wages, shortages of technical
personnel,
In a survey to understand management perspectives of the state of workplace health and
safety practices in Kenya Mbakaya et. al. (1999) found that most respondents (70%) were
audited by labor inspectors while 45% said injured workers were not treated well by
management. Many workplaces (65%) violated the mandatory legal requirement on the
establishment of health and safety committees. Many approaches have been suggested in the
literature for classifying risks. Perry and Hayes (1985) presented a list of factors extracted
from several sources which were divided in terms of risks retainable by contractors,
consultants and clients. Flanagan and Norman (1993) suggested three ways of classifying
risk: by identifying the consequence, type and impact of risk. Chapman (2001) grouped risks
into four subsets: environment, industry, client and project. Of the 58 identified risks
associated with Sino-Foreign construction joint ventures, Shen et al. (2001) categorized them
into six groups in accordance with the nature of the risks, i.e. financial, legal, management,
market, policy and political, as well as technical risks. In this paper, risks were grouped with
reference to Zou et. al. (2007) method in order to study risks from the project stakeholder
perspectives. Kanagary (1995) conducted a study to identify risks within the top 100 large
USA construction contractors. In this study respondent were asked to identify the importance
of risks associated with construction from the owner's and contractor's perspective. Also, they
were asked to place these risks into three allocations. Allocated to the owner, construction
contractor, or shared between the two parties.
In our research we investigated perspectives in terms of risk likelihood and magnitude
which could affect the potential consequences from identified risks. An example of low
likelihood with high magnitude events is nuclear facility accident. In which it has low
probability of occurrences but when it occurs it could cause high human and monetary losses.
On the other hand, conventional power plant facilities might has lower magnitude of risk
through exposing human and environment to hazardous gases with high likelihood of
occurrences that could be on daily effects. Both events could result in the same level of losses
over long time of exposure.
Some risks, once identified, can easily be eliminated or reduced. However, most risks are
much more difficult to mitigate, particularly high-impact low-probability risks. Therefore,
risk mitigation and management need to be long-term efforts by project managers throughout
the project. Some of the options for risk mitigation are: Risk transfer and contracting, risk
buffering, risk avoidance, risk control, and risk assumption. Most organizations implement
achieve predefined objectives in terms of time, cost, quality, and safety, as well as
environment force public and private organization to shut down their operations and run out
of business. Therefore, it is important to understand what the main project risk sources
contributors and shed light on them so project stakeholders such as project directors, project
executives, project suppliers and others be able to manage them to a degree project objectives
could be met effectively and efficiently. Different project stakeholders such as owner,
contractor, and consultant could have different perspectives on risk priorities which discard
their efforts to manage them. Therefore, in this research we identified the main risk
contributors in terms of likelihood and magnitude, as well as consequences and be able to
rank them in order of importance. Moreover, we identified the main risk contributors from
point view of owner, consultant, and contractor.
2. RESEARCH OBJECTIVES
The objective of this research is to investigate different perspectives for project risks in
Saudi Arabia. In particular, the research will:
1. Present the main risk contributors which could prevent project from achieving
predefined objectives. These risk are identified from cost, time, quality, safety, and
environment sources.
2. Measure significance risk index for each risk source in order to priorities risk sources
for each risk group and rank them accordingly to small, moderate, large potential
consequences
3. Understand different perspectives for risk priorities from the standpoint of projects’
owners, consultants, and contractors.
3. RESEARCH SCOPE AND LIMITATIONS
The aim of this research is to identify risk management priorities for projects in Saudi
Arabia. Therefore, the study will investigate different risk sources and classify them after
estimating risk index for each risk sources from different perspectives or owners, consultants,
It will not study different perspectives for different types of projects such as
infrastructure, housing, public assets and commercial buildings. Also, it will not analyze
different perspective within the same role classification. i.e., within contractors the study will
not analyze the results based on their company size or classification. Moreover, this research
will not make analysis based on project ownership such as public or private one.
4. SIGNIFICANCE OF THIS STUDY
Projects fail to achieve their main objectives due to different reasons that are related to
time, cost, quality, and safety, as well as environment. Identifying and priorities risk sources
from different perspectives such as owner, contractor, and consultant enable project owners
to draw clear picture to secure their future project investment successfully. Risk assessment is
the first step toward risk management. Since sometimes, we are not able to prevent or reduce
project risk due to lack of understanding the potential project risk consequences. Project risks
consequences come from two elements. The first is the risk likelihood, i.e., how likely the
risk could occur which could be expressed as high, low or moderate. The second one is the
risk magnitude, i.e. how large is it to have such risk sources. This magnitude could be related
to the size of business interruption that prevent achieving project objectives. Therefore, this
research will facilitate project successes through guiding future project stakeholders toward
the main risk contributors and be able to manage them.
5. RESEARCH METHODOLOGY
The research methodology will include the following steps:
Step one: A comprehensive literature review of the available work reported on risk
management, allocation of risks and the importance of these risks.
Step two: Definition of important risk parameters and categories related to risk allocation,
risk importance and effects of risks on projects.
Step three: Design of a questionnaire related to the allocation of risks, importance and effects
of these risks.
Step four: Data was collected and compiled
Step six: Results from the analyzed data were summarized and presented
Step seven: Conclusion of the research, recommendations and suggestions for further studies
were incorporated.
6. DESIGN OF QUESTIONNAIRE
The questionnaire was designed to be distributed to bilingual respondents in both
English and Arabic. It starts with greeting participants and explaining the reasons behind the
survey and it's for scientific purpose only and the content will not disclosed to other party.
Section A of the questionnaire asked for general information about respondents to know
their type of job or position, educational background, years of work experience and types of
projects that they are currently involved in such as: infrastructure, housing, public assets and
commercial buildings.
Section B of the questionnaire ask question to see the key risks according to iIndividual
project objectives. These objectives help project owners to complete project according to
their expectations in terms of time, cost, quality, and safety, as well as environment. The
following section contains the items that will be analyzed for each project objective from
different perspectives of project owner, contractors, and consultants.
7. SAMPLE SURVEY
In this research we are trying to understand the main risk contributors for projects in
Saudi Arabia from different perspectives of owner, contractor, and consultant. Therefore,
choosing a sample size was critical to be able to reach the right one and get better
representation. Zou et. al (2007) used a sample size of 177 construction practitioners in
China to understand key risks in construction projects in China. In this research a response
rate of 46% with total 83 responses that are used for analysis. In this research, we are trying
to understand different risk sources for diverse kinds of projects from various project roles
such as owner, consultant and contractor. Therefore, we decide to have sample size of 500
that contains different spectrum of research interest. 269 responses were received but 23 of
them were identified as invalid due to much incomplete answers. 246 responses represent a
8. DATA ANALYSIS AND SCORING
The survey feedback includes three groups of data: The likelihood of occurrences of
each risk, and its magnitude of consequences, as well as potential effects in terms of owners,
contractors, and consultants.
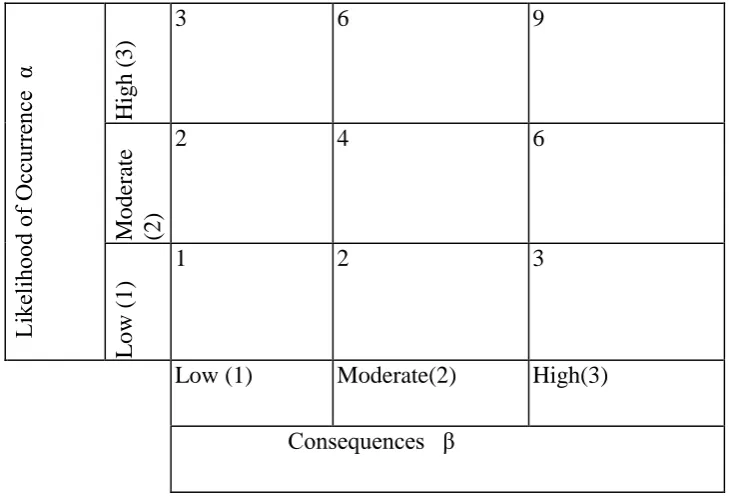
The three point scales for the likelihood α(highly, moderate, low) and the consequences
β (high magnitude, medium magnitude, low magnitude).
These point scales need to be converted into numerical scales. Zou et al.( 2007) used a
value of 1 for high, 0.5 for medium, and 0.1 for low. In our research we will use a value of 3
for high, 2 for medium, and 1 for low as shown in Table 1. The risk index for each hazard is
calculated through equation (1)
rij= αij βij /9 (1)
Where rij= Significance score assessed by respondent j for the impact of risk i, i= ordinal
number of risk, i Є (1, m); m= total number of risks; j= ordinal number of valid feedback to risk i, j Є (1, n); n= total number of valid feedbacks to risk i; αij= likelihood of occurrence of risk i, assessed by respondent j; βij= consequence of risk i assessed by respondent j.
The average score for each risk considering its significance from the perspective of
stakeholders can be calculated through equation (2). This average score is called the risk
significance index score which will be used to rank among all hazards.
Ri = (2)
Where Ri= significance index score for hazard i. Risks are ranked in accordance with
their significance index (Ri) for the project objectives that are based on different viewpoint
from stakeholders such as owner, consultants, contractors, , and others. It is important to
mention that the hazards which have been identified in this study have been taken from
stakeholders’ perspective and not from scientific findings. As shown in Table 1 the maximum
score for consequences will be 9 and when we divide it by 9 the maximum will be 1.
risk index from 0.333 to 0.666 will be moderate ones. Less than 0.333 low and greater than
0.666 is high.
Likelihood of O
cc
ur
re
nc
e α
H
ig
h
(
3)
3 6 9
Moder
ate
(2)
2 4 6
Low
(
1)
1 2 3
Low (1) Moderate(2) High(3)
[image:11.595.115.480.170.419.2]Consequences β
Table 1 Risk Screening Based on Impact and Likelihood
9. STUDY SAMPLE
Our sample contains 25 responses as owner, 87 responses as contractor, 59 responses as
consultant, 42 responses for other with 33 responses missing without identifying their role
within projects. Percentages for each category are shown in Table 2, below.
Frequency Percent
Valid Percent
Cumulative Percent
Valid Owner 25 10.2 11.7 11.7
Contractor 87 35.4 40.8 52.6
Consultant 59 24.0 27.7 80.3
Other 42 17.1 19.7 100.0
Total 213 86.6 100.0 Missing System 33 13.4
Total 246 100.0
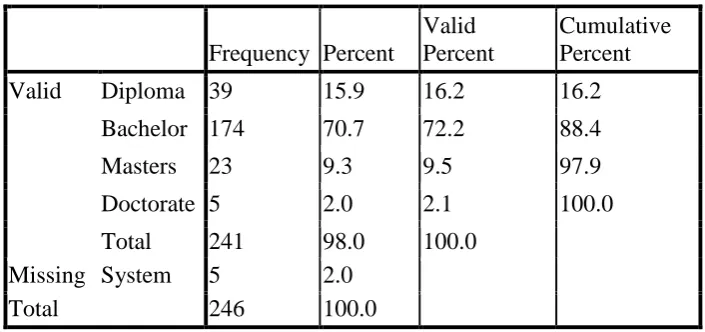
[image:11.595.88.511.564.754.2]In our sample 70.7% hold bachelor degree and 9.3% hold masters degree with
chances that had chances to study risk related issues and make them familiar with project
risks. Other percentages are shown in Table 3, below.
Frequency Percent
Valid Percent
Cumulative Percent
Valid Diploma 39 15.9 16.2 16.2
Bachelor 174 70.7 72.2 88.4
Masters 23 9.3 9.5 97.9
Doctorate 5 2.0 2.1 100.0
Total 241 98.0 100.0 Missing System 5 2.0
[image:12.595.121.474.165.331.2]Total 246 100.0
Table 3 Educational background of sample
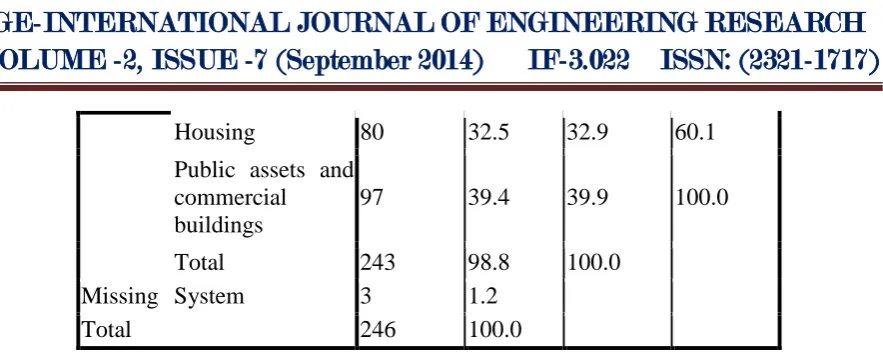
In the study sample 75.9% has an experience more than 5 years as shown in Table 4.
and 39.4% were involved in public assets and commercial building such as shown in Table 5.
Frequency Percent
Valid Percent
Cumulati ve Percent
Valid Less than 5 years 59 24.0 24.1 24.1
5-10 years 76 30.9 31.0 55.1
10-15 years 48 19.5 19.6 74.7
More than 15
years 62 25.2 25.3 100.0
Total 245 99.6 100.0 Missing System 1 .4
[image:12.595.123.473.442.631.2]Total 246 100.0
Table 4 Number of years of work experience for sample
Frequency Percent
Valid Percent
Cumulativ e Percent
Housing 80 32.5 32.9 60.1
Public assets and commercial buildings
97 39.4 39.9 100.0
Total 243 98.8 100.0 Missing System 3 1.2
[image:13.595.83.525.33.209.2]Total 246 100.0
Table 5 Types of projects they are currently involved
10.RESULTS OF RISK SOURCES
Previous researchers addressed project risk management from different perspectives. In
this research we will classify risk results in terms of the following risk sources:
Project cost overrun risks include: inaccurate cost budget; price escalation of material
and material-availability uncertainties; labour-market and labour cost increase; supplier or
subcontractors’ default; unpredictable weather; fluctuation in currency and interest rates;
excessive interface on project management; political instability, corruption and unfamiliarity
with local regulations.
Project time delay risks include: poor project scope definition; project complexity;
inadequate planning; impropriate project schedule; design variations; inaccurate engineering
estimate; inaccuracy of material estimate; material and equipment shortage; long lead-time
items; shortage of skilled labour; poor labour productivity; unpredictable weather conditions.
Project quality risks include: iterative cycles resulting from unanticipated errors and
changes; problems due to inappropriate design; lack of appropriate design check; time
availability problems; non-availability of experienced design personnel; reduced tender
times; reduction in design fees, poor workmanship, use of sub-standard materials, not
following specifications or standards, inappropriate construction processes.
Project safety risks include: lack of safety regulations and legislation; poor safety
lack of training; poor accident record keeping and reporting system; reckless operation;
disorganized labour; poor site conditions, layout and space; severe weather conditions.
Project environmental sustainability risks include: direct environment risks such as dust,
harmful gases, noises, solid and liquid wastes; and indirect environmental risks which are
influenced by a project but are not necessarily a direct result of the project, such as the
exposure of contaminated materials during the excavation of soil for footing.
10.1 Cost
The average score for cost risk was 0.50228 which could be classified with moderate
potential consequences. The following were the most significant risk sources in order: Price
inflation of construction materials, unavailability of sufficient amount of skilled labor,
unavailability of sufficient professionals and managers, bureaucracy of government,
contractors’ poor management ability, suppliers’ incompetency to delivery materials on time,
inadequate safety measures or unsafe operations.
10.2 Time
The average score for cost risk was 0.525209 which could be classified with moderate
potential consequences. It is clear that time related risk is larger than cost related ones. The
following are the risk with the largest significant index in order: Price inflation of
construction materials, unavailability of sufficient amount of skilled labor, bureaucracy of
government, suppliers’ incompetency to delivery materials on time, poor competency of
labor, project funding problems, contractors’ poor management ability.
10.3 Quality
Low management competency of subcontractors’ significance index score was
0.612466 which could be classified as high even though the total risk index for quality of
0.448641 was less than that for cost and time. Other sources of quality related risks are the
following: Poor competency of labor, contractors’ poor management ability, price inflation
of construction materials, unavailability of sufficient professionals and managers, tight
10.4 Environment
Significance index scores for cost related risks are shown in Table 4.9, below. The
average score for cost risk was 0.5476 which could be classified with moderate potential
consequences. The following were the most significant risk sources in order: Serious noise
pollution caused by construction, serious air pollution due to construction activities,
prosecution due unlawful disposal of construction waste, water pollution caused by
construction, contractors’ poor management ability
10.5 Safety
Inadequate safety measures or unsafe operations ranked number one in terms of
significance score index and it was 0.6576 that could be considered high significant risk
source. Significance index scores for safety were 0.5235. The most risk contributors were in
order: Low management competency of subcontractors, Poor competency of labor,
Unavailability of sufficient professionals and managers, Contractors’ poor management
ability.
11.Results of Risk Stakeholders
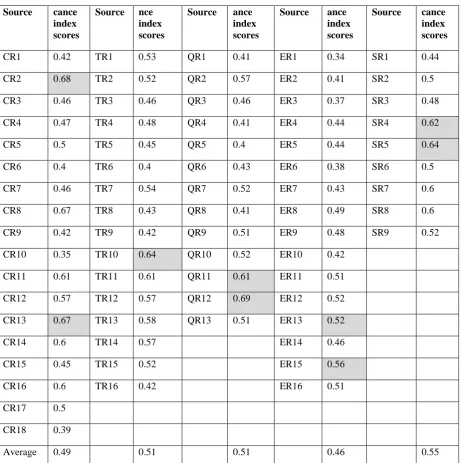
11.1 Owner
The owner thing that low management competency of subcontractors is the most
quality risk contributor which has a significance risk index of 0.6889 followed by price
inflation of construction materials with a significance risk index of 0.68. There were four risk
sources ranked high score of potential risk consequences with a significance risk index
greater than 0.666 and ten of them between 0.6 and 0.666. These risk sources along with their
impact on project objective are in order: Low management competency of subcontractors
(quality); price inflation of construction materials (cost); contractors’ poor management
ability (cost); unavailability of sufficient amount of skilled labor (cost); bureaucracy of
government (time). Table 6 shows the owner average significance index scores for all risk
sources from each category. In this table environmental issues were ranked the least
significant and the safety issues were the most significant ones.
Cost Time Quality Environment Safety
Source cance index scores
Source nce index scores
Source ance index scores
Source ance index scores
Source cance
index scores
CR1 0.42 TR1 0.53 QR1 0.41 ER1 0.34 SR1 0.44
CR2 0.68 TR2 0.52 QR2 0.57 ER2 0.41 SR2 0.5
CR3 0.46 TR3 0.46 QR3 0.46 ER3 0.37 SR3 0.48
CR4 0.47 TR4 0.48 QR4 0.41 ER4 0.44 SR4 0.62
CR5 0.5 TR5 0.45 QR5 0.4 ER5 0.44 SR5 0.64
CR6 0.4 TR6 0.4 QR6 0.43 ER6 0.38 SR6 0.5
CR7 0.46 TR7 0.54 QR7 0.52 ER7 0.43 SR7 0.6
CR8 0.67 TR8 0.43 QR8 0.41 ER8 0.49 SR8 0.6
CR9 0.42 TR9 0.42 QR9 0.51 ER9 0.48 SR9 0.52
CR10 0.35 TR10 0.64 QR10 0.52 ER10 0.42
CR11 0.61 TR11 0.61 QR11 0.61 ER11 0.51
CR12 0.57 TR12 0.57 QR12 0.69 ER12 0.52
CR13 0.67 TR13 0.58 QR13 0.51 ER13 0.52
CR14 0.6 TR14 0.57 ER14 0.46
CR15 0.45 TR15 0.52 ER15 0.56
CR16 0.6 TR16 0.42 ER16 0.51
CR17 0.5 CR18 0.39
[image:16.595.69.530.83.547.2]Average 0.49 0.51 0.51 0.46 0.55
Table 6 Owner average Significance index scores for all risk sources 11.2 Contractor
In Table 7 we tried to show different significant risk index in terms of project
objectives for contractors. It shown that only three risk sources get score higher than 0.60 for
their significance index that could be classified as moderate one. These are related to quality
(unavailability of sufficient amount of skilled labor), Safety (inadequate safety measures or
unsafe operations), and cost (price inflation of construction materials)
Table 7 shows the owner average significance index scores for all risk sources from each
issues were the most significant ones. Owner sees that risks related to safety are more
important than the contractors think.
Cost Time Quality Environment Safety
Risk Source Signifi cance index scores Risk Source Significa nce index scores Risk Source Signific ance index scores Risk Source Significa nce index scores Risk Source Signific ance index scores
CR1 0.42 TR1 0.44 QR1 0.38 ER1 0.33 SR1 0.48
CR2 0.68 TR2 0.53 QR2 0.53 ER2 0.38 SR2 0.46
CR3 0.46 TR3 0.52 QR3 0.39 ER3 0.41 SR3 0.45
CR4 0.47 TR4 0.43 QR4 0.49 ER4 0.45 SR4 0.5
CR5 0.5 TR5 0.58 QR5 0.45 ER5 0.49 SR5 0.63
CR6 0.4 TR6 0.53 QR6 0.44 ER6 0.37 SR6 0.51
CR7 0.46 TR7 0.5 QR7 0.52 ER7 0.41 SR7 0.51
CR8 0.67 TR8 0.4 QR8 0.5 ER8 0.4 SR8 0.5
CR9 0.42 TR9 0.41 QR9 0.65 ER9 0.42 SR9 0.44
CR10 0.35 TR10 0.55 QR10 0.55 ER10 0.42
CR11 0.61 TR11 0.55 QR11 0.58 ER11 0.42
CR12 0.57 TR12 0.54 QR12 0.57 ER12 0.41
CR13 0.67 TR13 0.49 QR13 0.41 ER13 0.56
CR14 0.6 TR14 0.5 ER14 0.53
CR15 0.45 TR15 0.47 ER15 0.59
CR16 0.6 TR16 0.39 ER16 0.5
CR17 0.5 CR18 0.39
[image:17.595.68.532.146.638.2]Average 0.478 0.488 0.497 0.443 0.498
Table 7 Contractor average Significance index scores for all risk sources
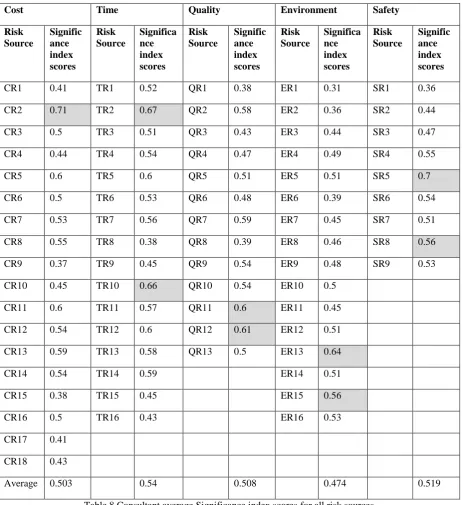
11.3 Consultant
As for consultant cost, safety, time, and environmental issues ranked the most risk
that could be considered large with greater than 0.66. They are price inflation of construction
materials (cost); inadequate safety measures or unsafe operations (safety); price inflation of
construction materials (time); bureaucracy of government (time). The rest of factors which
consultant think they are related to project risk are shown in Table 8.
Cost Time Quality Environment Safety
Risk Source Signific ance index scores Risk Source Significa nce index scores Risk Source Signific ance index scores Risk Source Significa nce index scores Risk Source Signific ance index scores
CR1 0.41 TR1 0.52 QR1 0.38 ER1 0.31 SR1 0.36
CR2 0.71 TR2 0.67 QR2 0.58 ER2 0.36 SR2 0.44
CR3 0.5 TR3 0.51 QR3 0.43 ER3 0.44 SR3 0.47
CR4 0.44 TR4 0.54 QR4 0.47 ER4 0.49 SR4 0.55
CR5 0.6 TR5 0.6 QR5 0.51 ER5 0.51 SR5 0.7
CR6 0.5 TR6 0.53 QR6 0.48 ER6 0.39 SR6 0.54
CR7 0.53 TR7 0.56 QR7 0.59 ER7 0.45 SR7 0.51
CR8 0.55 TR8 0.38 QR8 0.39 ER8 0.46 SR8 0.56
CR9 0.37 TR9 0.45 QR9 0.54 ER9 0.48 SR9 0.53
CR10 0.45 TR10 0.66 QR10 0.54 ER10 0.5
CR11 0.6 TR11 0.57 QR11 0.6 ER11 0.45
CR12 0.54 TR12 0.6 QR12 0.61 ER12 0.51
CR13 0.59 TR13 0.58 QR13 0.5 ER13 0.64
CR14 0.54 TR14 0.59 ER14 0.51
CR15 0.38 TR15 0.45 ER15 0.56
CR16 0.5 TR16 0.43 ER16 0.53
CR17 0.41 CR18 0.43
[image:18.595.68.531.178.684.2]Average 0.503 0.54 0.508 0.474 0.519
Table 8 Consultant average Significance index scores for all risk sources
In this section we categorized risk index for each risk contributes into three categories,
small, moderate, and large. For small category risk index will be between 1 and 3. In this
category, risk likelihood or consequences should have value of 1. Table 9, below show each
risk categories for significance index score.
Low category when the following likelihood α and consequences β combination: (1, 1), (1,
2), (1, 3), (2, 1). Scores between 1-3. Moderate category when the following likelihood α and
consequences β combination :( 2, 2). Large category when the following likelihood α and consequences β combination :( 3, 2), (2, 3), (3, 3)
Since the largest value of significance index is one. I.e, 9 divided by 9 categories, the
following significance risk categories will be considered. Low when significance index when
risk index less than 0.33. Moderate significance index when risk between (0.33-0.66).
Finally, High significance index when risk larger than 0.66
L
ik
elih
oo
d
of
Occ
ur
ren
ce
α
H
ig
h
(
3
)
3 Low 6 High 9 High
Mo
d
er
ate
(2
)
2 Low 4 Moderate 6 High
L
o
w
(1
)
1 Low 2 Low 3 Low
Low (1) Moderate(2) High(3)
[image:19.595.115.482.363.602.2]Consequences β
Table 9 Significance risk index category 12.1 SMALL RISK CONTRIBUTORS
In this research there was only one risk contributor which scale below 0.33 which is
variation by the client from consultant perspective.
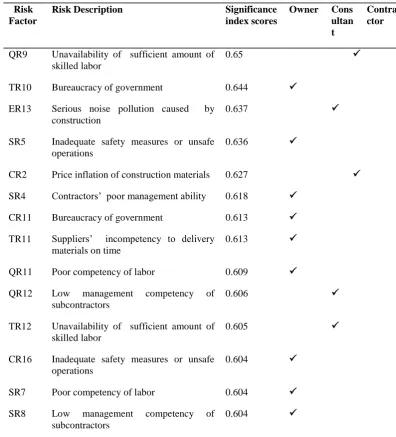
Most significance risk index were considered to me moderate one. Table 10 show the
highest scores for moderate risk contributors. This results shows that most risk factors are
considered by owner to be considered as risk contributor.
Risk Factor
Risk Description Significance
index scores
Owner Cons
ultan t
Contra ctor
QR9 Unavailability of sufficient amount of skilled labor
0.65
TR10 Bureaucracy of government 0.644 ER13 Serious noise pollution caused by
construction
0.637
SR5 Inadequate safety measures or unsafe operations
0.636
CR2 Price inflation of construction materials 0.627 SR4 Contractors’ poor management ability 0.618
CR11 Bureaucracy of government 0.613 TR11 Suppliers’ incompetency to delivery
materials on time
0.613
QR11 Poor competency of labor 0.609 QR12 Low management competency of
subcontractors
0.606
TR12 Unavailability of sufficient amount of skilled labor
0.605
CR16 Inadequate safety measures or unsafe operations
0.604
SR7 Poor competency of labor 0.604 SR8 Low management competency of
subcontractors
[image:20.595.93.490.158.596.2]0.604
Table 10 Moderate significance risk index for owner, contractor, consultant
12.3 LARGE RISK CONTRIBUTORS
Large risk contributors which score larger than 0.66 for average risk index were
mostly considered by owner and consultant and none of them were considered by contractor
Risk Factor
Risk Description Significance
index scores
Owner Cons
ultan t
Contra ctor
CR2
Price inflation of construction
materials 0.712
SR5
Inadequate safety measures or unsafe operations 0.702
QR12
Low management competency of subcontractors 0.689
CR2
Price inflation of construction
materials 0.68
TR2
Price inflation of construction
materials 0.672
CR8
Contractors’ poor management
ability 0.671
CR13
Unavailability of sufficient
amount of skilled labor 0.671
[image:21.595.102.484.88.386.2]TR10 Bureaucracy of government 0.659
Table 11 Large significance risk index for owner, contractor, consultant
13.CONCLUSION
This paper investigates potential risk sources for projects in Saudi Arabia through
different perspective of owners, and contractors, as well as consultants in order to understand
the risk contributors and be able to manage such risk. Therefore, we identify risk sources
through literature review, preparing survey questionnaire, collecting and analyzing data, and
finally draw a clear picture of risk priorities in projects for Saudi Arabia.
Responses from 269 participants were received, among which 23 discarded due to not
complete information and the rest of 246 participants were analyzed, summarized and
reported for each type of projects objectives in terms of cost, time, quality, and environment,
as well as safety. In order to understand different perspectives of projects owners, contractors,
and consultants we reanalyzed responses to measure the significance score index for each risk
sources. 25 participants were for owners, 87 for contractors, 29 for consultants, and 33 for
All participants' roles (owner, contractor, and consultant) ranked environmental risk
sources as the least important. As for owner, risk significance in order was: Safety, cost, time,
quality, and environment. On the other hand, contractors ranked risk sources as the following:
Safety, quality, time, cost, and environment. Finally, consultant ranked them: Time, safety,
quality, and cost, as well as environment.
It is clear that there are differences in risk significance index for each risk sources for
different project stakeholders. Such differences might shift available resources to mitigate
their consequences. Therefore, a consensus between stakeholders should be established early
in project planning process through having quick survey to realize the most important risk
contributors and be able to manage them accordingly with minimal impact on cost, time,
quality, and safety, as well as environment.
14.RECOMMENDATIONS
This paper identified risk management priorities for projects in Saudi Arabia. Therefore,
we investigated different risk sources and classified them after estimating risk index for each
risk sources from different perspectives or owners, consultants, and contractors. However, the
research has some limitations, such as:
We recommend to study different perspectives for different types of projects such as
infrastructure, housing, public assets and commercial buildings.
Also, this research did not analyze different perspective within the same role
classification. I.e., within contractors the study did not analyze the results based on company
size or classification. Therefore, we recommend analyzing different perspectives within the same role classification to see if there is consensus among project management team such as executives, project directors, program managers, and team leaders.
Since project ownership is critical aspect of project risk management. Therefore, public
owned projects might be relaxed with accepting risk taking while private owned projects
might be more conservative especially in cost part of projects.
We found a lack of interest in environmental issues and that is why significance risk
Therefore, we should emphasis environmental protection measures to prevent future
environmental degradation due to current or future projects.
REFERENCES
1. Alexopoulos, E.C., Kavadi, Z., Bakoyannis, G., Papantonopoulos, S.,2009. Subjective risk assessment and perception in the Greek and English Bakery industries. Journal of Environmental and Public Health, 1–8.
2. Arditi D, Akan GT, Gurdamar S.(1985) Cost overruns in public projects. Project Manage 3(4):218–24.
3. AS/NZS 4360. Australian/New Zealand standard on risk management. Standards Australia and Standards, New Zealand, 2004.
4. Chapman RJ. (2001)The controlling influences on effective risk identification and assessment for construction design management. Int J. Project Manage;19:147–60.
5. C.F.L. Mbakaya, H.A. Onyoyo, S.A. Lwaki, O.J. Omondi (1999) A survey on management perspectives of the state of workplace health and safety practices in Kenya, Accident Analysis and Prevention 31 305–312
6. Flanagan R, Norman G. (1993) Risk management and construction. Victoria, Australia: Blackwell Science Pty Ltd.
7. Kangary, R. (1995). Risk Management Perception and Trend of U.S. Construction. Journal of Construction Engineering and Management, ASCE, Vol. 121 No.4, pp.422-429
8. Moser CA, Kalton G. (1971) Survey methods in social investigation. UK: Heinemann Educational.
9. Patrick X.W. Zou a, Guomin Zhang, Jiayuan Wang. (2007) Understanding the key risks in construction projects in China International Journal of Project Management 25 601–614
10.Perry JH, Hayes RW. (1985) Risk and its management in construction projects. Proceeding of the institution of civil eng.; Part I, 78, 499–521.
11.Shen LY, Wu GWC, Ng CSK. (2001)Risk assessment for construction joint ventures in China. J Constr Eng Manage;127(1):76–81.
13.Flanagan R, Norman G. (1993)Risk management and construction. Victoria, Australia: Blackwell Science Pty Ltd.
14.Flyvbjerg, B., M.S. Holm, and S. Buhl. (2002) Underestimating Costs in Public Works Projects: Error or Lie?, journal of the American Planning Association 68(3): 279-295.
15.Li-Yin Shen, Andrew Platten, X.P. Deng (2006) Role of public private partnerships to manage risks in public sector projects in Hong Kong International Journal of Project Management 24 587–594
16.Lu, W.S., Shen, L.Y., Yam, M.C.H., (2008) Critical success factors for competitiveness of contractors: China study. Journal of Construction Engineering and Management 134 (12), 972–982.
17.March, James G., and Zur Shapira. (1987). Managerial Perspectives on Risk and Risk Taking. Management Science 31 (11): 140M418.
18.Shenhar, A.J. (2001). One Size Does Not Fit All Projects: Exploring Classical Contingency Domains." Management Science 47 (3): 394-414.
19.Santrock, J.W., (2007) A Topical Approach to Life-Span Development. McGraw-Hill, New York, NY.