TOMATO SOUP PREMIX BASE: DEVELOPMENT AND
OPTIMISATION USING RESPONSE SURFACE METHODOLOGY
Rupesh S. Chavana, Anit Kumarb and Shraddha Bhattc
a
Department of Food Science and Technology, Assistant Professor,
National Institute of Food Technology Entrepreneurship and Management (NIFTEM),
Kundli, Sonepat, Haryana, India
b
Department of Food Science and Technology, National Institute of Food Technology
Entrepreneurship and Management (NIFTEM), Kundli, Sonepat, Haryana, India
c
Anand Agricultural University, Anand-(Gujarat) India.
ABSTRACT
The optimum formulation for production of tomato soup premix base was determined
using Response Surface Methodology (RSM Design Expert DX 6). Effect of addition levels of
tomato powder, whey powder, sugar and salt along with fixed ingredients including citric
acid, skim milk powder, cream powder and yeast extract on sensory attributes were
investigated. Significant regression model was determined which explained the effect of
changes in the concentration of the variables on responses of the tomato soup premix base.
The coefficient of determination, R2 of all response variables were higher than 0.8. The
optimized formulation given by RSM, based on response surfaces and superimposed plots,
was further analysed for sensory analysis.
Key words: Tomato powder, Whey Powder, Soup, Functional Property.
Introduction
Whey based soup can be manufactured and formulated keeping in consideration the
nutritional values, biological and functional properties. Whey can be used in manufacturing
of soup in larger amounts due to the following reasons; a. whey has a broad range of
solubility i.e. from pH 3-8, b. whey does have a bland flavor and on many occasion they can
act as carrier for the aroma compounds, c. buffering capacity of whey can be explored for
‘mouthfeel’ of the drink by increasing the viscosity of the beverage, e. coagulation of whey
proteins during thermal treatments, f. higher viscosity of concentrates affect the effectiveness
of thermal treatments, g. high content of minerals in the whey are responsible for undesired
salty-sour flavour of whey.
One of the most appealing aspects of whey proteins is that they can serve as a
functional ingredient in a food system. Protein functionality is defined by Morr and Ha
(1993) as “physicochemical properties that influence the structure, appearance, texture,
viscosity, mouth feel, or flavor retention of the product”. Whey protein functionalities can be
influenced by many factors including the composition and processing of the whey protein as
well as the composition and processing of the food system (Morr and Ha, 1993).
In the present investigation efforts are made to standardize the process for preparation
of tomato soup premix and optimization of the process parameters for spray drying of the
tomato soup premix. The tomato soup powder base was developed by using whey powder,
tomato powder, salt, sugar, yeast extract, citric acid, skim milk powder, natural creamear and
flavour. The prepared tomato soup premix base was then reconstituted and was evaluated for
its sensory characteristics. The process of formulation of the tomato soup premix base was
standardized on the basis of monitorable optimized parameters in coordination with prepared
food grade additives with the help of response surface methodology.
2. Materials and methods
2.1 Materials:
For preparation of tomato soup premix base: whey powder, sugar, citric acid, skim
milk powder and salt were supplied by M/s Gulati, Delhi. Spray dried tomato powder was
supplied by M/s Aarkay Food Products Ltd., Ahmedabad. Cream Powder and yeast extract
were procured from M/s Duke Thompson, Delhi and M/s Symega, Kerala respectively.
2.2 Experimental design:
Response surface methodology (RSM) is adopted in the experimental design as it
emphasizes the modelling and analysis of the problem in which response of interest is
influenced by several variables, and the objective is to optimize this response (Montgomery,
2001). Experimental central composite (face-centered) design was done by using Design
rotatable design was employed. The independent variables selected for the set of experiments
were: tomato powder, X1, 30, 32 and 34 gm; whey powder, X2, 38,40,and 42 gm; salt, X3,
9,10 and 11 gm and sugar, X4, 10,11 and 12 gm and the other ingredients which were added
and kept in a constant ratio were citric acid (1 gm), skim milk powder (2 gm), cream powder
(2 gm) and yeast extract (2 gm). The variables and their levels were chosen based on the
limited literature available on dry soup mix (Black et al., 1969), shelf stable tomato soup
concentrates (Glasser et al., 1972); soup concentrates (Glaser and Sjonvall 1979), free radical
interactions between raw materials in dry soup powder (Raitio et al., 2011); sensory
characteristics and rheological properties of soups containing oat and barley β-glucan before
and after freezing (Lyly et al., 2004). The actual value of each level is detailed in Table 1.
The three levels of the process variables were coded as −1, 0, 1 (Montgomery, 2001) and
design in coded (x) form and at the actual levels (X) is given in Table 2.
Table 1: Extreme level of independent variables used for optimization of tomato powder, whey powder, salt and sugar for preparation of tomato soup premix base.
Independent Variables Code Unit Levels of addition
-1 0 +1
Tomato Powder X1 gm 30 32 34
Whey powder X2 gm 38 40 42
Salt X3 gm 9 10 11
Sugar X4 gm 10 11 12
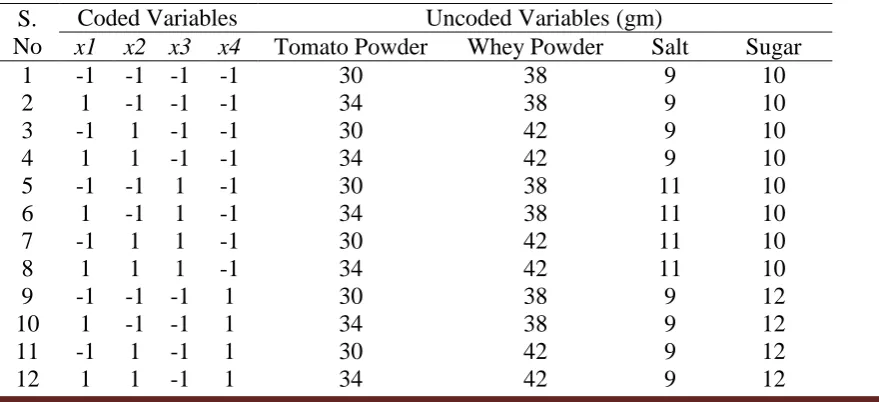
Table 2: Central composite rotatable experimental design employed for preparation of tomato soup premix base.
S. No
Coded Variables Uncoded Variables (gm)
x1 x2 x3 x4 Tomato Powder Whey Powder Salt Sugar
1 -1 -1 -1 -1 30 38 9 10
2 1 -1 -1 -1 34 38 9 10
3 -1 1 -1 -1 30 42 9 10
4 1 1 -1 -1 34 42 9 10
5 -1 -1 1 -1 30 38 11 10
6 1 -1 1 -1 34 38 11 10
7 -1 1 1 -1 30 42 11 10
8 1 1 1 -1 34 42 11 10
9 -1 -1 -1 1 30 38 9 12
10 1 -1 -1 1 34 38 9 12
11 -1 1 -1 1 30 42 9 12
[image:3.595.74.514.556.757.2]13 -1 -1 1 1 30 38 11 12
14 1 -1 1 1 34 38 11 12
15 -1 1 1 1 30 42 11 12
16 1 1 1 1 34 42 11 12
17 -2 0 0 0 28 40 10 11
18 2 0 0 0 36 40 10 11
19 0 -2 0 0 32 36 10 11
20 0 2 0 0 32 44 10 11
21 0 0 -2 0 32 40 8 11
22 0 0 2 0 32 40 12 11
23 0 0 0 -2 32 40 10 9
24 0 0 0 2 32 40 10 13
25 0 0 0 0 32 40 10 11
26 0 0 0 0 32 40 10 11
27 0 0 0 0 32 40 10 11
28 0 0 0 0 32 40 10 11
29 0 0 0 0 32 40 10 11
30 0 0 0 0 32 40 10 11
2.3. Preparation of Tomato soup sample:
Optimum levels of tomato powder, whey powder, salt and sugar were evaluated by
conducting the sensory analysis. The dry ingredients were weighed and then mixed in a
Planetary Mixer (Nutech Engg. Cooporation, New Delhi) for a period of 5 min followed by
shifting it through a 36 mesh size sieve to remove any unwanted lumps. The samples were
than packed in standup pouches of polyethylene bags at room temperature. Soup premix
powder (50 gm) was dissolved in 450 ml lukewarm water with continuous mixing which was
followed by increasing the temperature to boiling and holding for 3 min. Prepared soup was
served in hot condition at about 70 OC for 5 panelist who assessed the soup for appearance,
odour, texture, flavor and after flavor, and to mark on a Hedonic Rating Test (1 – Dislike
extremely, 5 – Neither like nor dislike and 9 – Like extremely) in accordance with their
opinion.
3. Results and Discussions
3.1. Effect of ingredients on appearance of tomato soup premix base:
Regression model fitted to experimental results of appearance (Table 3) had an F-value of
14.1122 and a significance of P < 0.0001. The fit of model was also expressed by the
the variability of the response was explained by the model. The quadratic model obtained
from regression analysis is as follows:
Appearance = 7 + 0.541667 * tomato powder + 0.125 * whey powder + 0.041667 * salt -
0.04167 * sugar - 0.65625 * tomato powder2 - 0.28125 * whey powder2 - 0.28125 * salt2 -
0.28125 * sugar2 - 0.0625 * tomato powder * whey powder + 0.0625 * tomato powder * salt -
0.0625 * tomato powder * sugar - 0.1875 * whey powder * salt + 0.1875 * whey powder *
sugar + 0.0625 * salt * sugar.
Sum of squares of the tomato powder proves that appearance is significantly affected
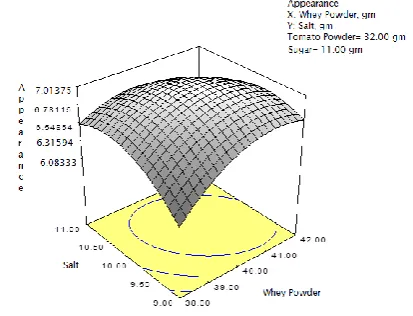
by the increasing level of tomato powder (Table 3, Fig 1). The interaction between whey
powder-salt (Fig 2) and whey powder-sugar (Fig 3) had a significant effect on appearance.
Other interactions were not significant (P > 0.05). Appearance of the tomato soup premix
base increased with increase in concentration of tomato powder, whey powder and salt. The
colour of the tomato soup premix base may be due to the presence of whey protein that
completely binds lycopene during processing and also retains during the storage as reported
[image:5.595.69.531.437.692.2]by Ahmed et al. (2012) in cheese whey permeates fortified with fresh cut tomato.
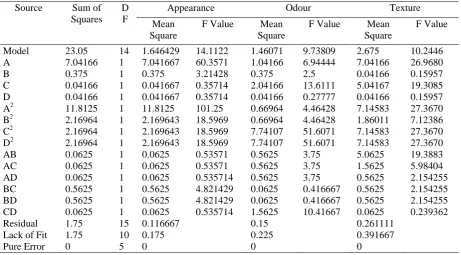
Table 3: ANOVA for appearance, odour and texture of tomato soup premix base
Source Sum of
Squares D
F
Appearance Odour Texture
Mean Square
F Value Mean
Square
F Value Mean
Square
F Value
Model 23.05 14 1.646429 14.1122 1.46071 9.73809 2.675 10.2446
A 7.04166 1 7.041667 60.3571 1.04166 6.94444 7.04166 26.9680
B 0.375 1 0.375 3.21428 0.375 2.5 0.04166 0.15957
C 0.04166 1 0.041667 0.35714 2.04166 13.6111 5.04167 19.3085
D 0.04166 1 0.041667 0.35714 0.04166 0.27777 0.04166 0.15957
A2 11.8125 1 11.8125 101.25 0.66964 4.46428 7.14583 27.3670
B2 2.16964 1 2.169643 18.5969 0.66964 4.46428 1.86011 7.12386
C2 2.16964 1 2.169643 18.5969 7.74107 51.6071 7.14583 27.3670
D2 2.16964 1 2.169643 18.5969 7.74107 51.6071 7.14583 27.3670
AB 0.0625 1 0.0625 0.53571 0.5625 3.75 5.0625 19.3883
AC 0.0625 1 0.0625 0.53571 0.5625 3.75 1.5625 5.98404
AD 0.0625 1 0.0625 0.535714 0.5625 3.75 0.5625 2.154255
BC 0.5625 1 0.5625 4.821429 0.0625 0.416667 0.5625 2.154255
BD 0.5625 1 0.5625 4.821429 0.0625 0.416667 0.5625 2.154255
CD 0.0625 1 0.0625 0.535714 1.5625 10.41667 0.0625 0.239362
Residual 1.75 15 0.116667 0.15 0.261111
Lack of Fit 1.75 10 0.175 0.225 0.391667
Figure 1: Effect of tomato powder and whey powder on the appearance of tomato soup premix
Figure 2: Effect of whey powder and salt on the appearance of tomato soup premix
3.2. Effect of base ingredients on odour of tomato soup premix base:
The regression model fitted to experimental results of odour (Table 3) has a F-value
of 9.738095). The quadratic model obtained from regression analysis for odour in terms of
coded levels of the variables is as follows:
Odour = 6 + 0.208333* tomato powder - 0.125 * whey powder + 0.291667 * salt + 0.041667
* sugar - 0.15625* tomato powder2 -0.15625* whey powder2 - 0.53125 * salt2 - 0.53125 *
sugar2 - 0.1875 * tomato powder * whey powder - 0.1875 * tomato powder * salt + 0.1875 *
tomato powder * sugar + 0.0625 * whey powder * salt - 0.0625* whey powder * sugar -
0.3125* salt * sugar
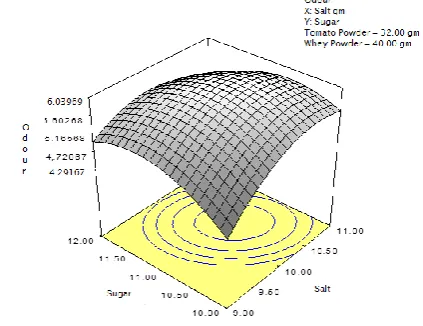
Sum of squares of the tomato powder and salt reveals that (Fig 3) it is significantly
affecting the odour at a much significant level. Similarly, interaction between salt-sugar (Fig
4) had a significant effect on odour. Other interactions were not significant (P > 0.05) to
affect the odour of the tomato soup powder base. Odour increased with increase in
concentration of tomato powder, salt and sugar. On the other hand odour of the sample was
affected negatively with increased in the concentration of whey powder and the reason may
be attributed to the presence of whey proteins which when used as a functional ingredient in a
food system like soup are often responsible for affecting the flavor retention property (Morr
et al., 1993).
[image:6.595.70.252.100.242.2]Figure 3: Effect of tomato powder and salt on the odour of tomato soup premix
Figure 4: Effect of salt and sugar on the odour of the tomato soup premix
3.3. Effect of base ingredients on texture of tomato soup premix base:
Texture acceptability mainly depends on hydrocolloid concentration that is present in premix
base and also on ration of tomato powder in the tomato soup premix base.Regression model
fitted to experimental results of texture (Table 4.3) had an F-value of 10.24468. The quadratic
model obtained from regression analysis for texture in terms of coded levels of the variables
is as follows:
Texture = 8 + 0.541667 * tomato powder - 0.04167 * whey powder + 0.458333 * salt -
0.04167 * sugar - 0.51042 * tomato powder2 - 0.26042 * whey powder2 - 0.51042 * salt2 -
0.51042* sugar2 + 0.5625 * tomato powder * whey powder + 0.3125* tomato powder * salt -
0.1875 * tomato powder * sugar + 0.1875 * whey powder * salt + 0.1875 * whey powder *
sugar - 0.0625 * salt * sugar
Concentration of tomato powder and salt had a significant effect on the texture of the
soup premix base. The magnitude of p-value in the Table 3, indicated that linear terms of
process variable tomato powder and salt, quadratic terms tomato powder2, whey powder2,
sugar2 and salt2 were significant to affect the texture of the soup. The interaction between whey tomato powder-whey powder and tomato powder-salt (Fig 5 and 6) had a significant
effect on texture of the reconstituted tomato soup and was in total agreement with the results
reported for tomato concentrate by Harper et al. (2006). Texture is also affected by the
concentration of hydrocolloids/ whey powder in premix base, as reported by Unal et. al.
Figure 5: Effect of tomato powder and whey powder on the texture of tomato soup premix
Figure 6: Effect of tomato powder and salt on the texture of tomato soup premix
3.4. Effect of base ingredients on taste of tomato soup premix base:
TheANOVA results are presented in Table 4 and the quadratic model obtained from
regression analysis for taste can be determined as follows:
Taste = 7.666667 + 0.333333* tomato powder - 0.08333 * whey powder - 0.08333 * salt -
0.08333 * sugar - 0.5625 * tomato powder2 - 0.5625 * whey powder2 - 0.9375 * salt2 - 0.5625
* sugar2 - 0.125 * tomato powder * whey powder + 0.25 * tomato powder * salt + 0.125 *
tomato powder * sugar + 0.625 * whey powder * salt - 0.25 * whey powder * sugar + 0.125 *
salt * sugar
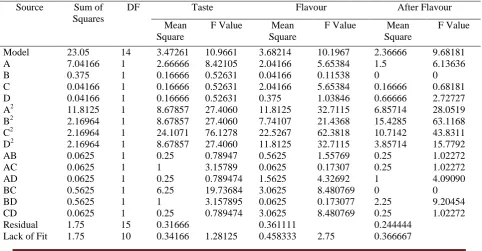
Table 4: ANOVA for taste, flavour and after flavour of tomato soup premix base
Source Sum of
Squares
DF Taste Flavour After Flavour
Mean Square
F Value Mean
Square
F Value Mean
Square
F Value
Model 23.05 14 3.47261 10.9661 3.68214 10.1967 2.36666 9.68181
A 7.04166 1 2.66666 8.42105 2.04166 5.65384 1.5 6.13636
B 0.375 1 0.16666 0.52631 0.04166 0.11538 0 0
C 0.04166 1 0.16666 0.52631 2.04166 5.65384 0.16666 0.68181
D 0.04166 1 0.16666 0.52631 0.375 1.03846 0.66666 2.72727
A2 11.8125 1 8.67857 27.4060 11.8125 32.7115 6.85714 28.0519
B2 2.16964 1 8.67857 27.4060 7.74107 21.4368 15.4285 63.1168
C2 2.16964 1 24.1071 76.1278 22.5267 62.3818 10.7142 43.8311
D2 2.16964 1 8.67857 27.4060 11.8125 32.7115 3.85714 15.7792
AB 0.0625 1 0.25 0.78947 0.5625 1.55769 0.25 1.02272
AC 0.0625 1 1 3.15789 0.0625 0.17307 0.25 1.02272
AD 0.0625 1 0.25 0.789474 1.5625 4.32692 1 4.09090
BC 0.5625 1 6.25 19.73684 3.0625 8.480769 0 0
BD 0.5625 1 1 3.157895 0.0625 0.173077 2.25 9.20454
CD 0.0625 1 0.25 0.789474 3.0625 8.480769 0.25 1.02272
Residual 1.75 15 0.31666 0.361111 0.244444
[image:8.595.58.541.505.756.2]Pure Error 0 5 0.26666 0.166667 0
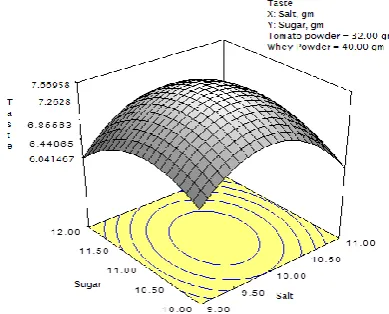
The coefficient value of linear term tomato powder is positive signifying that it increases the
taste of tomato soup premix base. While, the coefficient values of linear term whey powder,
salt and sugar are negative (Fig 7 and 8), which shows that any increase in the value of this
will decrease the taste. Whey proteins is used as a functional ingredient in a food system like
soup and are often responsible for affecting the structure, appearance, texture, viscosity,
mouth feel, or flavor retention property (Morr et al., 1993). Functionality of whey proteins is
generally affected by factors like: temperature, pH, protein concentration, salt, sugars,
calcium, and free sulfhydryl groups in the system (Jayaprakasha et al., 1999; Rich et al.,
[image:9.595.302.497.313.470.2]2000; Foegeding et al., 2002).
Figure 7: Effect of tomato powder and whey powder on the taste of tomato soup premix
Figure 8: Effect of salt and sugar on the taste of the tomato soup premix
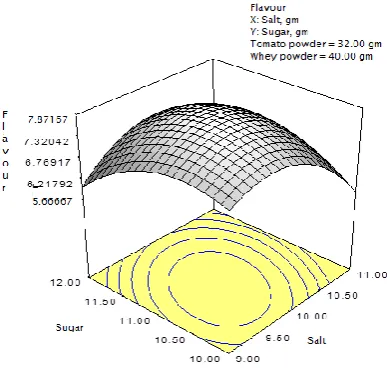
3.5. Effect of base ingredients on flavour of tomato soup premix base:
Flavour is another main attribute of the food product which increases the consumer
acceptance. Regression model fitted to experimental results of flavour (Table 4) showed
F-value of 10.1967 and was significant (P < 0.0001). The quadratic model obtained from
regression analysis is as follows:
Flavour = 7.833333 + 0.291667 * tomato powder - 0.04167 * whey powder - 0.29167 *
salt - 0.125 * sugar - 0.65625 * tomato powder2 - 0.53125* whey powder2 - 0.90625* salt2 -
0.65625* sugar2 - 0.1875* tomato powder * whey powder + 0.0625* tomato powder * salt +
0.3125* tomato powder * sugar + 0.4375* whey powder * salt - 0.0625* whey powder *
[image:9.595.84.261.327.471.2]Flavour profile of tomato soup premix base was found to increase with increase in
concentration of tomato powder and vice versa. While, the coefficient value of linear term
whey powder, salt and sugar (Fig 9 and 10) are negative, signifying that any further increase
in the value of these factors will decrease the flavour of the tomato soup premix base. All
quadratic terms are negative which denotes that the model is quadratic. Premix base consists
of sugar and increase in the sugar concentration enhances the consumer acceptance regarding
flavour but whey proteins tend to decrease the same as reported by Gan (2007), Bugaud
(2013) and by Igual (2014).
[image:10.595.307.501.271.455.2]
Figure 9: Effect of tomato powder and whey powder on the flavour of tomato soup premix
Figure 10: Effect of salt and sugar on the flavour of the tomato soup premix
3.6. Effect of base ingredients on after flavour of tomato soup premix base
Regression model fitted to experimental results of after flavour (Table 4) had an
F-value of 9.681818. The quadratic model obtained from regression analysis for after flavour is
as follows:
After flavour = 7 + 0.25 * tomato powder + 0 * whey powder - 0.08333 * salt - 0.16667 *
sugar - 0.5 * tomato powder2 - 0.75 * whey powder2 - 0.625 * salt2 - 0.375 * sugar2 + 0.125 *
tomato powder * whey powder + 0.125 * tomato powder * salt - 0.25 * tomato powder *
sugar + 0 * whey powder * salt + 0.375 * whey powder * sugar - 0.125 * salt * sugar
After flavour was found to increases with increase in concentration of tomato powder
and whey powder. While, the coefficient value of linear term salt and sugar was negative,
[image:10.595.81.265.282.446.2](Fig 11 and 12). Also all quadratic terms are negative denoting that the model is quadratic.
Increasing sugar concentration increases the consumer acceptance regarding after flavour but
whey proteins tend to decrease the same as reported by Gan (2007), Bugaud (2013) and by
Igual (2014).
[image:11.595.307.497.214.374.2][image:11.595.75.269.224.375.2]
Figure 11: Effect of tomato powder and whey powder on the after flavour of tomato soup premix
Figure 12: Effect of salt and sugar on the after flavour of the tomato soup premix
3.7. Compromised optimum condition for ingredients to develop tomato soup premix base:
The compromised optimum condition for the development of tomato soup premix powder as
determined using Design expert Software (DX 6) for maximum: appearance, odour, texture,
taste, flavour and after flavour is depicted in Table 5.
Table 5: Compromised optimum conditions for development of tomato soup premix base No. Tomato
powder
Whey
powder Salt Sugar Appearance Odour Texture Taste
Flavour After flavour
1 34.00 42.00 9.87 11.13 6.67779 5.57058 8.14312 6.50599 6.6625 6.09855
2 34.00 42.00 10.02 11.30 6.66466 5.58629 8.25106 6.56835 6.69251 6.07775
3 34.00 42.00 10.11 11.09 6.66026 5.60269 8.3803 6.71941 6.7303 6.11467
4 34.00 41.97 9.94 11.18 6.68181 5.59503 8.20374 6.57204 6.70415 6.11796
5 34.00 42.00 10.13 11.29 6.65422 5.58776 8.34771 6.64863 6.71732 6.07153
6 34.00 42.00 10.09 10.82 6.63131 5.55083 8.36483 6.74725 6.66776 6.12088
7 34.00 42.00 10.58 10.83 6.49694 5.48979 8.67409 6.81811 6.44512 5.94862
8 33.92 42.00 9.97 10.28 6.49601 5.19092 8.01396 6.54287 6.33826 5.97302
9 34.00 42.00 10.07 11.95 6.49027 5.25325 7.85039 6.01958 6.27428 5.74095
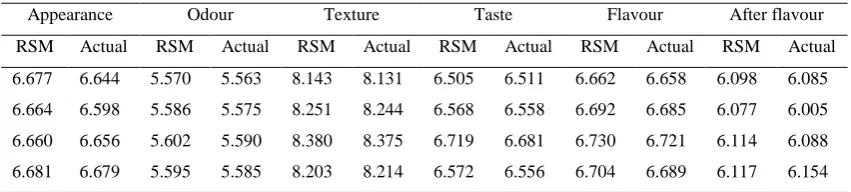
[image:11.595.71.533.561.723.2]The calculated values of responses and the predicted values for compromised optimum
solutions given by RSM, are tabulated in Table 6. After analysis of the tomato soup premix
base according to the formulation given by the RSM it was observed that, there was very less
deviation in calculated values of responses and the predicted values for compromised
[image:12.595.66.492.230.326.2]optimum solution no 1. Thus, finalised optimum solution was solution no. 1 in Table no 5
Table 6: Comparison of response values given by RSM and actually calculated values
Appearance Odour Texture Taste Flavour After flavour
RSM Actual RSM Actual RSM Actual RSM Actual RSM Actual RSM Actual
6.677 6.644 5.570 5.563 8.143 8.131 6.505 6.511 6.662 6.658 6.098 6.085
6.664 6.598 5.586 5.575 8.251 8.244 6.568 6.558 6.692 6.685 6.077 6.005
6.660 6.656 5.602 5.590 8.380 8.375 6.719 6.681 6.730 6.721 6.114 6.088
6.681 6.679 5.595 5.585 8.203 8.214 6.572 6.556 6.704 6.689 6.117 6.154
4. Conclusion
RSM is a useful tool in formulation and optimisation of the basic formulation of
tomato soup premix base by partial differentiating the empirical model with respect to each
parameter, equating to zero and simultaneously solving the resulting functions. The final
optimised solution obtained for preparation of tomato soup premix base was consisting of 34
gm (Tomato Powder, 42 gm (Whey Powder), 9.87gm (Salt), 11.13 gm (Sugar) along with
citric acid (1 gm), skim milk powder (2 gm), cream powder (2 gm) and yeast extract (2 gm).
The optimised tomato soup premix base can be used for manufacturing of whey fortified
tomato soup premix.
References
Ahmed, A., Patras, A., Martin-Diana, A. B., Rico, D. and Barry-Ryan, C. (2012). “The effect
of delactosed whey permeate on phytochemical content of canned tomatoes”. Food
ChemistryVol. 134 pp. 2249–2256.
Black, K. (2010). “Analysis of Variance and Design of Experiments” In K. Black, Business
Bugaud, C., Cazevieille, P., Daribo M., Telle, N., Julianus, P., Fils-Lycaon, B. and
Mbéguié-A-Mbéguié, D. (2013), “Rheological and chemical predictors of texture and taste in
dessert banana (Musa spp.). Postharvest Biology and Technology. Vol. 84 pp. 1-8.
Fernndez, P. P., Martino, M. N., Zaritzky, N. E., Guignon, B. and Sanz, P.D. (2007),
“Effects of locust bean, xanthan and guar gums on the ice crystals of a sucrose
solution frozen at high pressure”. Food Hydrocolloids. Vol. 21 pp. 507-515.
Foegeding, E.A., Davis, J. P., Doucet, D. and McGuffey. M. K. (2002). “Advances in
modifying and understanding whey protein functionality”. Trends in Food Sci. &
Technol.Vol. 13 pp.151-159.
Gan, H.E., Karim, R., Muhammad, S. K. S., Bakar, J. A., Hashim, D. M. Rahman, R. A.
(2007), “Optimization of the basic formulation of a traditional baked cassava cake
using response surface methodology”. LWT- Food Science and Technology. Vol. 40
pp. 611-618.
Glasser, G. and Sjonvall, R. E. (1979). “Soup concentrates” US PATENT US4140809 A.
Glasser, G., Sjonvall, R. E., Chester, E. and Kaplow, M. (1972). “Shelf stable tomato soup
concentrate” US PATENT 3,676,154, Patented July 11, 1972.
Igual, M., Contreras, C. and Martínez-Navarretea, N. (2014), “Colour and rheological
properties of non-conventional grapefruit jams: Instrumental and sensory
measurement”. LWT - Food Science and Technology. Vol. 56 pp. 200-206.
Jayaprakasha, H.M. and Brueckner, H. (1999). “Whey protein concentrate: a potential
functional ingredient for food industry”. Journal of Food Science and Technology
Vol. 36 pp.189-204.
Lyly, M., Roininen, K., Honkapää, K., Poutanen, K. and Lähteenmäki, L. (2007). “Factors
influencing consumers’ willingness to use beverages and ready-to-eat frozen soups
containing oat β-glucan in Finland, France and Sweden”. Food Quality and
PreferenceVol. 18 pp. 242–255.
Montgomery, D.C. (2001). “Design and Analysis of Experiments” (fifth ed.) Wiley, New
Morr, C. V. and Ha, E. Y. W. (1993). “Whey protein concentrates and isolates: processing
and functional properties”. Critical Rev. Food Sci. & Nutrit.Vol. 33 pp.431-476.
Morr, C.V., Ha, E. Y. W. (1993). “Whey protein concentrates and isolates: processing and
functional properties”. Food Science & Nutrition, Vol. 33 pp. 431-476.
Pichler, A. Pozderović, A. and Pavlović, J. (2012), “Influence of Sugars, Modified Starches,
and Hydrocolloids Additions on the Rheological Properties of Raspberry Cream
Filling”. J. Food Sci. Vol. 30 pp. 227-235.
Raitio, R., Orlien, V. and Skibsted, L. H. (2011). “Free radical interactions between raw
materials in dry soup powder”. Food ChemistryVol. 129 pp.951–956.
Rich, L. M., Foegeding, E. A. (2000). “Effects of sugars on whey protein isolate gelation”.
Journal of Agricultural Food Chemistry, Vol. 48 pp. 5046-5052.
Rich, L.M. and E.A. Foegeding. (2000). “Effects of sugars on whey protein isolate gelation”.
J. Agric. Food Chem. Vol. 48 pp.5046-5052.
Ünal, B., Metin, S. and Işıkl, N. D (2003). “Use of response surface methodology to describe
the combined effect of storage time, locust bean gum and dry matter of milk on the
physical properties of low-fat set yoghurt”. International Dairy Journal. Vol. 13 pp.