Citation:
Hanley, B and Bissas, A (2012) Differences between body segment parameter models in analysing elite race walkers in competition. Gazzetta Medica Italiana: Archivio per le Scienze Mediche, 171 (5). pp. 541-550. ISSN 0393-3660
Link to Leeds Beckett Repository record: http://eprints.leedsbeckett.ac.uk/5672/
Document Version: Article
The aim of the Leeds Beckett Repository is to provide open access to our research, as required by funder policies and permitted by publishers and copyright law.
The Leeds Beckett repository holds a wide range of publications, each of which has been checked for copyright and the relevant embargo period has been applied by the Research Services team.
We operate on a standard take-down policy. If you are the author or publisher of an output and you would like it removed from the repository, please contact us and we will investigate on a case-by-case basis.
DIFFERENCES BETWEEN BODY SEGMENT PARAMETER MODELS IN ANALYSING ELITE RACE WALKERS IN COMPETITION
B. Hanley, 1 A. Bissas 1
1 Biomechanics Department, Carnegie Faculty, Leeds Metropolitan University, Leeds, United
Kingdom
B. Hanley,
Headingley Campus,
Carnegie Faculty of Sport and Education,
Leeds Metropolitan University, Leeds, LS6 3QS.
ABSTRACT
Aim. The aim of this study was to measure differences in segment centre of mass position, velocity and acceleration in elite race walkers using two different body segment parameter
models. Knowledge of how results differ between models can inform researchers as to the appropriate choice with regard to their own participants.
Methods. Video data of thirty men and thirty women race walkers were recorded during
competition using two camcorders operating at 50 Hz. Two popular body segment parameter models (Dempster and de Leva) were applied individually to the digitised data. Positional,
velocity and acceleration values were obtained for each participant at four relevant points during the gait cycle.
Results. The whole body centre of mass vertical position was significantly lower when using
the de Leva model compared to Dempster. The vertical position of the centre of the mass of the thigh was also significantly lower in women when using the de Leva model. The upper
arm provided significantly different velocity and acceleration data at particular points between the models. The actual difference between positions of the centre of mass of the foot tended to be quite small.
Conclusion. The analysis showed that the position of centres of mass (in the vertical direction) was most affected by choice of body segment parameter model. Differences in linear velocity and acceleration were largely non-significant, but extra care is advised when
analysing the upper arm segment. Usage of de Leva’s model is recommended, particularly when analysing women participants.
TEXT
Introduction
Body segment parameter (BSP) models are used in biomechanical analyses in order to
provide positional and inertia data.1 Typical BSP models that are used provide average data for segment centre of mass positions, segment length and mass proportions, and moments of inertia.2-4 These data can then be used in descriptive kinematics (e.g. foot velocity) as well as
both forward and inverse dynamics analyses.5 However, the models used are usually estimated from cadavers of elderly subjects 6 or geometric shapes modelled from these
original data 1 and these may provide inaccurate data in specific populations such as young adults.7 Previous research has chiefly looked at the accuracy of BSP models in normal walking 5, 6, 8 and running,9 but there remains a need to identify the importance of BSP model
variations in other forms of locomotion.8 This is particularly the case as Rao et al. 10 found significant differences between joint moments calculated using six different BSP models at
three gait speeds.
Studies on the accuracy of BSP models have typically used laboratory-based methods;
researchers using data from less-controlled environments such as outdoor competitions often apply BSP models to kinematic data and need to know what effect, if any, different models have on the measures obtained. It is seldom practical to place markers on athletes in
competition, which prevents the usage of BSP models based on rarely-used landmarks (such as Zatsiorsky et al.’s 11) as opposed to more familiar joint centres. Also, the reliance of
One form of locomotion that has not been previously studied in the usage of BSP models is race walking. Race walking is an abnormal form of gait which arises as a function of the rules
that govern it.12 As a competitive event that is part of the Olympic Games and other major athletics championships, studies of both internal and external parameters are essential to understanding how to improve performance and reduce the risk of injury. With regard to the
analysis of race walking gait, there are two levels of analysis available: primary and advanced. Primary analysis includes the most fundamental variables such as step length and
walking velocity. Primary analysis variables, apart from horizontal CM velocity, are not affected by choice of BSP models. This is because temporal factors such as cadence are not affected at all by BSP selection, while stride length is the same whichever model is chosen.
Because joint angles can also be calculated without reference to BSP models, it is clear that this primary kinematic analysis of race walking (and other competitive gait) can be achieved
with any of the popular models available.
However, more complex analyses rely on other basic kinematic parameters which can be
affected by the choice of BSP model (e.g. segment linear acceleration is required in calculations of muscle moments). Previous research has measured the muscle moments, joint powers, and energy transfer between segments during race walking.12, 13, 14, 15 The accuracy of
these results may be affected by the choice of BSP model chosen, particularly if the model is being applied to a sample quite different from the original sample. This may occur, for
difficult for researchers to employ or develop bespoke models for their own specific group of
participants.
It is important for researchers of all forms of gait, including competitive gait such as race walking, to know if using a selected BSP model will lead to significant differences from using others. This is especially important if the researcher is restricted to using a certain model, for
example where it includes or excludes data on specific body segments of interest. Also, researchers may only have the opportunity (for convenience / time constraints / competitive
settings) to use just one or a limited number of BSP models and it would be practical to know the range of values that may be expected to result from using different models. The BSP models defined by Dempster and de Leva are commonly used in sports biomechanics due to
the availability of the data and ease of use. The purpose of this study was to measure differences in kinematic data in elite men and women race walkers when using these two
popular BSP models.
Materials and methods
Participants
The study was approved by the Faculty’s Research Ethics Committee. Video data were
collected at the 23rd IAAF World Race Walking Cup held in Cheboksary, Russia in 2008.
Thirty competitors from the 50 km men’s race were analysed as they passed the 28.2 km point, and thirty women competing in the 20 km race were analysed as they passed 14.2 km. Participants’ heights were self-reported and along with their dates of birth were obtained from
represented European nations, seven represented Central / South American nations, two
represented Asian nations, and there was one athlete each from the USA and Australia. In the women’s race, twenty-one athletes represented European nations, four represented Central /
South American nations, three athletes represented Australia and two represented the USA.
Procedures
Two stationary 3CCD DM-XL1 cameras (Canon, Tokyo) were placed on one side of the course where it was completely straight and there were no obstructions such as water stations.
The cameras were mounted on rigid tripods and placed at approximately 45º and 135º respectively to the plane of motion. The sampling rate was 50 Hz and the shutter speed 1/500 s. The resolution of each camera was 720 x 576 pixels. The reference volume was 5.20 m
long, 2.00 m wide, and 2.01 m high. This volume was used later for calibration for 3D Direct Linear Transformation.18 Calibration rods of known length were digitised within the
calibration volume and compared to their known lengths. The root mean square (RMS) of the difference between the known and calculated values was 0.2% of the rod’s length in the
x-direction (length), 0.5% in the y-x-direction (height) and 0.6% in the z-x-direction (width).
Data analyses
The video data were downloaded and digitised to obtain kinematic data using motion analysis
software (SIMI, Munich). The recordings of the two cameras were synchronised using event synchronisation (typically both toe-off and initial contact). All trials were digitised by a single
experienced operator. Marker dropout occurred on the left hand side of the body on some occasions and estimations were made by the operator. All body segment data presented in this study are from the right hand side of the body where no dropout occurred. The seventeen
wrist joints, third finger, hip joints, knee joints, ankle joints, and distal tips of the feet. The
digitised data were smoothed using a cross-validated quintic spline. The digitised data were filtered as follows: a cross-validated quintic spline was used to smooth the data prior to
displacement calculations whereas a recursive second-order, low-pass Butterworth digital filter (zero phase-lag) was employed to filter the displacement-time data of each marker prior to the calculations of the 1st and 2nd derivatives.19, 20 The cut-off frequencies were selected
based on residual analysis and values for the variables included in this study ranged from 4.0 – 9.1 Hz.21
In order to ensure reliability of the digitising process, repeated digitising (two trials) of one race walking sequence at the same sampling frequency was performed with an intervening
period of 48 hours. Three statistical methods for assessing reliability were used: 95% Limits of Agreement (LOA), Coefficient of Variation (CV) and Intraclass Correlation Coefficient
(ICC). The data for each tested variable were assessed for heteroscedasticity by plotting the standard deviations against the individual means of the two trials. If the data exhibited heteroscedasticity a logarithmic transformation of the data (loge) was performed prior to the
calculation of absolute reliability measures.22 Therefore, depending on the presence of heteroscedasticity the LOA and CV values were expressed in either original or ratio scale. The results which relate to the most important biomechanical variables considered in this
paper showed minimal systematic and random errors and therefore confirmed the high reliability of the digitising process with regard to the overall group of athletes.
Each of the sixty video sequences was digitised, after which the seventeen digitised segment endpoints were used to create models of the human body using two BSP models. With regard
needed to be digitised once, and so any differences were due to choice of BSP model, rather
than a result of digitising differences. These models were based on the data provided by Dempster 2 and de Leva.3 Dempster’s data were based on cadavers of elderly men aged
between 52 and 83. De Leva’s data are re-estimations of segment parameters based on Zatsiorsky et al.’s 11 original data of one hundred male and fifteen female Caucasian physical education undergraduates (their mean ages were 24 and 19 respectively) as adjusted to
familiar body landmarks. The locations of the centres of mass for the whole body (CM), upper arm, forearm, thigh, lower leg and foot were calculated using both of these BSP
models. Dempster’s one BSP model was used to analyse both men and women; however, there are separate models for men and women provided by de Leva and in this study the male model has been applied to the 50 km men, and the female model to the 20 km women.
The position of the centre of mass of the upper arm, forearm, thigh, lower leg and foot
segments were defined as a proportion of their length from the proximal joint position, as presented in Table I. The proportion used by the SIMI program for the foot when using Dempster’s model appears to be based on Plagenhoef’s 23 presentation of these data. This
figure has been reported elsewhere 21; however, this figure of 0.5 for the foot did not appear in Dempster’s 2 original paper.
Variables considered important in analysing race walking were measured in this study. These included stride velocity, which was calculated as the average horizontal velocity over the
course of one stride, and is the most important variable in predicting race success. A stride was defined as the distance from toe-off of one foot to the next successive toe-off of the same foot. The important variables also included the horizontal and vertical coordinates, velocities
calculations of muscle moments, energy transfer and joint power. These were calculated at
four separate times during the race walking stride cycle. These times are particularly relevant to race walking analysis with regard to the rules regulating the event. They were defined as
follows:
Initial contact: the first visible time during stance where the athlete’s right foot clearly
contacts the ground.
Toe-off: the last visible time during stance where the athlete’s right foot clearly contacts the
ground.
Midstance: the point where the centre of mass of the athlete’s right foot was directly below their body’s CM, used to determine the ‘vertical upright position’ (IAAF rule 230.1).24
Midswing: the point during right leg swing where the athlete’s right knee was adjacent to
their left (stance) leg.
Although both midstance and midswing are often used to describe longer periods of these gait phases (e.g. Whittle),25 they are used here to describe single postural instances.
Statistical analyses
The data are presented as means and standard deviations. Only those variables which showed significant differences between models have been displayed. Independent t-tests were
conducted on each set of data to establish differences between models, with adjustments made if Levene’s test for equality of variances was less than 0.05. Alpha was set at 0.05 for these
Results
Certain differences between BSP models were found for height, velocity and acceleration for the whole body CM, upper arm, thigh, and foot. The differences for the thigh were only found in the women’s data. No differences were found for the forearm or lower leg. The horizontal
velocity of the CM was not found to be different between models in either men or women at any time of analysis, or as an average over the entire stride.
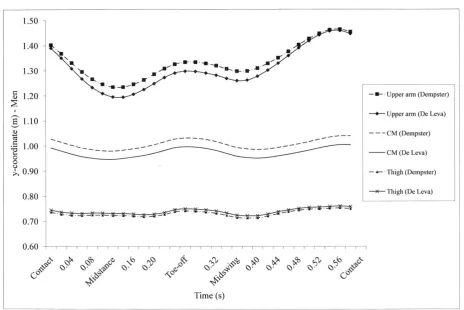
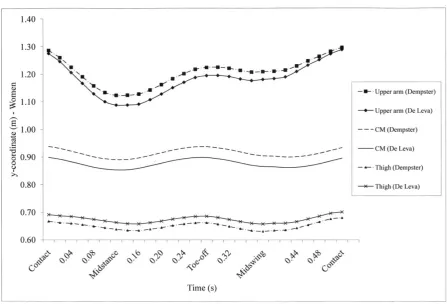
The average paths of the height of the whole body CM, upper arm and thigh during one full
stride are shown in Figure 1 (men) and Figure 2 (women). The whole body CM height was found to be lower by about 3 cm using the de Leva model compared with Dempster for both men and women at all four measurement times (P<0.001), but no other whole body centre of
mass variables were found to differ.
The de Leva model estimated the centre of mass of the thigh to be between 2 and 3 cm higher in women than the Dempster model at each measurement time (P<0.002), and horizontal acceleration of the thigh at toe-off in women was also found to differ between models
(Dempster: 12.13 ± 2.46 m·s-2; de Leva: 10.78 ± 2.37 m·s-2) (P=0.035). However, no differences between mean values for velocity and acceleration of the thigh were found between models for men.
With regard to the upper arm, there was no difference in the height of the centre of mass at
found to differ between models are summarised in Table II. The fact that velocity and
acceleration were not different between models at all four analysis times was due to alterations in upper arm orientation as the shoulder flexed and extended.
The vertical coordinate data for the foot are shown in Table III. There was no difference in the height of the centre of mass of the foot at contact between models for either men or women.
However, the height of the centre of mass of the foot was different between models for women at midstance (P<0.001), toe-off (men and women: P<0.001), and midswing (men:
P=0.032; women P=0.001).
Discussion
The aim of this study was to measure the differences in segment centre of mass position, velocity and acceleration in elite men and women race walkers using two different BSP
models. These models were Dempster’s (based on cadaveric data of elderly men) 2 and de Leva’s (adjustments to original data from gamma ray scanning on young, living men and
women).3 The whole body centre of mass variables as well as those of five body segments
were compared between the models and two of these (lower leg and forearm) showed no significant differences. The thigh also showed no significant differences in the male group. Overall, the de Leva model tended to locate the whole body CM, the upper arm CM and the foot CM higher than Dempster’s, but the de Leva model located the thigh CM lower than
Dempster’s.
The de Leva model for both men and women consistently located the whole body centre of mass 3 cm below the Dempster model throughout the gait cycle. This is not particularly
where vertical displacement is a key variable. The differences in location of the CM between
models did not affect any horizontal direction variables nor velocity and acceleration in the vertical direction.
De Leva’s model was the only one that provided different BSP data for men and women, as
Dempster’s is based only on male cadavers. As a result, applying the Dempster model to the women’s group led very noticeably to a discrepancy in the location of the thigh centre of
mass, with the de Leva model placing it between 2 and 3 cm higher. This is possibly a result
of the differing distribution of body fat and shape of the pelvic girdle in males and females and obviously needs to be taken into account when analysing women participants. Although this difference was expected due to the data on the location of centres of mass (from Table I),
the only difference found for CM velocity or acceleration in either horizontal or vertical directions was for horizontal acceleration at toe-off. The presence of only one significant
difference for velocity and acceleration means that the choice of BSP model may not affect applied research of sporting gait adversely. However, for more clinical studies or those measuring local moment of inertia values, the difference in thigh centre of mass location
between models may have a significant effect.
The upper arm was the source of most differences between BSP models. The location of the
centre of mass was considerably further from the proximal joint in both male and female de Leva models compared with the Dempster model. Apart from significant differences in upper
arm height, the models also gave significantly different values for the key variables of velocity and acceleration at various times of the gait cycle. For each of these variables, the de Leva model always provided higher magnitudes due to the effect of the longer radius of
horizontal acceleration, 0.14 m·s-1 for vertical velocity, and 2.07 m·s-2 for vertical
acceleration. Although movement of the upper limbs is not analysed in gait as often as the lower limbs, it may be important in gait analysis with regard to energy transfer between the
upper and lower body. These differences are also particularly noteworthy for any other sporting analysis involving the arms (e.g. throwing).
The location of the centre of mass of the foot is less easy to locate than in other segments. This is due largely to sagittal plane movements at the metatarsophalangeal joints during gait,
where the actual distance between the ankle and heel and the toes shortens compared to the anatomical standing position. As noted earlier, the proportional position of the centre of mass of the foot as being 0.5 of total length in the Dempster model was not published in
Dempster’s 2 original paper but has been given elsewhere 21, 23 and was used by the computer software utilised in this study. The 0.5 figure led to the y-position of the foot’s centre of mass
to be significantly lower in the Dempster model compared to de Leva’s at three different gait instances. However, the actual difference was often very small (less than a centimetre) and neither velocity nor acceleration in either horizontal or vertical directions was significantly
different. A researcher using the foot as a single segment can therefore be confident using either BSP model when conducting kinematic analyses.
Because this study aimed to compare kinematic parameters between BSP models using participants in competition, it was not possible to establish or mark estimated joint positions
and this could have affected the accuracy of digitising. Nonetheless, the models were applied to the same digitised data (by one single experienced operator) and hence any differences found between models are due entirely to differences within them and not to differences in
models per se, but rather to ascertain whether using one over another resulted in differences
so significant that they would affect descriptive kinematic analyses and further inverse dynamics studies.
The two models compared in this study were based on samples of Caucasian participants. Most of the participants in this study were Caucasian (primarily from Europe) but a small
number came from East Asian countries. This may have slightly affected the results of these particular individuals. In general, it is important to apply the most appropriate model as possible; for example, Dempster’s model may be more suitable for use with elderly Caucasian men than de Leva’s.
The most important variable in an applied analysis of race walk competitors, average velocity, did not differ significantly between models. The overall effects of the differences between
models, such as those of velocity and acceleration, are relatively small and researchers can be confident that the model chosen will not significantly affect their results and conclusions. Where the small number of differences did occur, researchers in all activities should note their
extent and choose a BSP model carefully, and particularly if analysing the upper arm in all participants and the thigh segment in women. This is particularly important if the location of the centre of mass of a particular segment affects other calculations in secondary analysis, e.g.
local moment of inertia, which is used in calculations of muscle moments or angular momentum. Men and women have different body shapes and this difference can affect the
validity of using a model based on male participants on women, and vice versa. Future research should therefore take care when analysing women to ensure a female-specific model such as de Leva’s is used, with the same logic applied if studying particular groups, e.g.
Conclusions
This analysis of elite male and female race walkers has shown that for a primary kinematic analysis the differences were so small that the choice of model would not affect results or
conclusions significantly. Commonly researched variables in race walking such as stride velocity and stride length are not affected by choice of model. The positions of the centres of mass in the vertical direction were most affected. These differences are not very noteworthy
in an event that occurs mostly in the horizontal direction, but may be more important in vertical activities such as high jumping. Differences in linear velocity and acceleration were
largely non-significant, but studies on throwing events such as javelin and shot putt need to take note that the upper arm demonstrated most differences and extra care is advised when analysing this segment. Research on the effects of using different BSP models in other
REFERENCES
1. Pearsall DJ, Reid JG. The study of human body segment parameters in biomechanics: an historical review and current status report. Sports Med 1994; 18:126-40.
2. Dempster WT. Space requirements for the seated operator. Technical Report (TR-55-159). Ohio: Wright-Patterson Air Force Base; 1955.
3. de Leva P. Adjustments to Zatsiorsky-Seluyanov’s segment inertia parameters. J Biomech
1996; 29:1223-30.
4. Hanavan EP. A mathematical model of the human body. Technical Report
(AMRL-63-102). Ohio: Wright-Patterson Air Force Base; 1964.
5. Fregly BJ, Reinbolt JA. Estimation of body segment parameters from three-dimensional gait using optimization. Proceedings of the Eighth International Symposium on the 3D
Analysis of Human Movement; 2004 March 31-April 2, Tampa, FL.
6. Ganley KJ, Powers CM. Determination of lower extremity anthropometric parameters
using dual energy x-ray absorptiometry: the influence on net joint moments during gait. Clin Biomech 2004; 19:50-6.
7. Zatsiorsky VM, Seluyanov VN. The mass and inertia characteristics of the main segments
of the human body. In: Matsui H, Kobayashi K, editors. Biomechanics VIII-B. Champagne: Human Kinetics; 1983:1152-9.
8. Pearsall DJ, Costigan PA. The effect of segment parameter error on gait analysis results.
Gait Posture 1999; 9:173-83.
9. Metzler V, Arampatzis A, Brüggemann G-P. Influence of 2D and 3D body segment models
on energy calculations during kinematic analysis of running. Eur J Appl Physiol 2002; 86:337-41.
10. Rao G, Amarantini D, Berton E, Favier D. Influence of body segments’ parameters
11. Zatsiorsky VM, Seluyanov VN, Chugunova LG. Methods of determining mass-inertial
characteristics of human body segments. In: Chernyi GG, Regirer SA, editors. Contemporary Problems of Biomechanics. Massachusetts: CRC Press; 1990:272-91.
12. Cairns MA, Burdette RG, Pisciotta JC, Simon SR. A biomechanical analysis of racewalking gait. Med Sci Sports Exerc 1986; 18:446-53.
13. Hoga K, Ae M, Enomoto Y, Fujii N. Mechanical energy flow in the recovery leg of elite
race walkers. Sports Biomech 2003; 2:1-13.
14. Hoga K, Ae M, Enomoto Y, Yokozawa T, Fujii N. Joint torque and mechanical energy
flow in the support legs of elite race walkers. Sports Biomech 2006; 5:167-182.
15. Donà G, Preatoni E, Cobelli C, Rodano R, Harrison AJ. Application of functional principal component analysis in race walking: an emerging methodology. Sports Biomech
2009; 8:284-301.
16. Ae M, Tang HP, Yokoi T. Estimation of inertia properties of the body segment in
Japanese athletes. In: The Society of Biomechanisms, editors. Biomechanisms 11: form, motion, and function in humans. Tokyo: University of Tokyo Press; 1992:33.
17. IAAF: Biographies - IAAF World Athletics Series athletes: 1999 onwards [Internet].
Monte Carlo: International Association of Athletics Federations; ©1996-2009 [cited 2010 Jan 20]. Available from: http://.www.iaaf.org/.
18. Abdel-Aziz YI, Karara HM. Direct linear transformation from comparator coordinates
into space coordinates in close range photogrammetry. In: American Society of Photogrammetry, editors. Proceedings of the Symposium on Close Range Photogrammetry.
Falls Church: American Society of Photogrammetry; 1971:1-18.
20. Giakas G, Baltzopoulos V. Optimal digital filtering requires a different cut-off frequency strategy for the determination of the higher derivatives. J Biomech 1997; 30:851-5.
21. Winter DA. Biomechanics and motor control of human movement. 3rd edition Chichester: Wiley; 2005.
22. Bland JM, Altman DG. Statistical methods for assessing agreement between two methods
of clinical measurement. Lancet 1986; i(8476):307-310.
23. Plagenhoef S. Patterns of human motion. Englewood Cliffs: Prentice Hall; 1971.
24. IAAF: Competition Rules: 2010 – 2011 [Internet]. Monte Carlo: International Association of Athletics Federations; ©2009 [cited 2010 Jan 20]. Available from: http://.www.iaaf.org/. 25. Whittle MW. Gait analysis: an introduction. 2nd edition. Oxford:
TABLE I. –Position of the centre of mass of selected segments as a proportion of the overall
segment length from the proximal joint.
Dempster (1955) de Leva: male (1996) de Leva: female (1996)
Upper arm 0.436 0.5772 0.5754
Forearm 0.430 0.4574 0.4559
Thigh 0.433 0.4095 0.3612
Lower leg 0.433 0.4459 0.4416
TABLE II. –Selected values of velocity and acceleration (mean ± SD) of the upper arm.
Dempster de Leva
Horizontal velocity (m·s-1)
Midstance Men
Women
4.99 ± 0.31
4.88 ± 0.37
5.27 ± 0.32**
5.12 ± 0.38*
Horizontal acceleration (m·s-2)
Contact Men
Women
8.32 ± 1.71
9.45 ± 1.71
10.01 ± 1.96**
11.22 ± 1.84***
Toe-off Men
Women
-14.29 ± 2.37
-15.19 ± 3.10
-16.80 ± 2.53***
-17.77 ± 3.59**
Vertical velocity (m·s-1)
Contact Men -1.07 ± 0.23 -1.20 ± 0.26*
Women -0.99 ± 0.24 1.13 ± 0.27*
Vertical acceleration (m·s-2)
Contact Men -15.17 ± 3.07 -16.92 ± 3.48*
Midstance Men
Women
19.68 ± 2.90
18.21 ± 2.87
21.75 ± 3.38*
19.95 ± 3.25*
Midswing Women 10.21 ± 2.56 11.23 ± 2.99*
TABLE III. –Y-coordinates (mean ± SD) of the foot.
Dempster (cm) de Leva (cm)
Contact Men
Women
13 ± 1
13 ± 1
13 ± 1
12 ± 1
Midstance Men
Women
6 ± 1
5 ± 1
6 ± 1
6 ± 1***
Toe-off Men
Women
11 ± 1
9 ± 1
12 ± 1***
11 ± 1***
Midswing Men
Women
13 ± 1
13 ± 1
14 ± 1*
15 ± 1**
Fig. 1. –The path of the y-coordinate of the CM of the whole body, upper arm and thigh in the
Fig. 2. –The path of the y-coordinate of the CM of the whole body, upper arm and thigh in the