Citation:
Johnston, DK and Palmer, J and Terry, N and Miles-Shenton, D and Gorse, C and Pope, P (2019)
Cavity Party Walls: Measuring U-values. Project Report. BEIS.
Link to Leeds Beckett Repository record:
http://eprints.leedsbeckett.ac.uk/5810/
Document Version:
Monograph
The aim of the Leeds Beckett Repository is to provide open access to our research, as required by
funder policies and permitted by publishers and copyright law.
The Leeds Beckett repository holds a wide range of publications, each of which has been
checked for copyright and the relevant embargo period has been applied by the Research Services
team.
We operate on a standard take-down policy.
If you are the author or publisher of an output
and you would like it removed from the repository, please
contact us
and we will investigate on a
case-by-case basis.
P a g e | 0
Cavity Party Walls:
Measuring U-values
For the Department for Business, Energy and Industrial Strategy
FINAL
REPORT
21 December 2018
Cavity Party Walls:
Measuring U-values
P a g e | 1
Contents
Executive Summary ... 1
1.Introduction ... 4
Context: History of Party Wall Construction in the UK ... 4
Types of Party Wall ... 5
2.Previous Work on Heat Loss through Party Walls ... 7
Past work by Leeds Beckett University ... 7
3.Methods ... 12
Standard measurements ... 15
Intensive and invasive measurements ... 15
Analysis ... 17
Analysing Planning Drawings ... 19
4.Findings ... 21
How many homes have cavity party walls? ... 21
Estimating spot in-situ U-values ... 25
Trends in-situ U-values ... 28
5.Estimating average in-situ U-values ... 32
Finding confidence ranges in the in-situ U-value estimates ... 34
6.Air velocities in the cavity and wind speed ... 36
7.Validating methods ... 40
Consistency over time ... 40
Back-to-back measurements ... 42
Steady temperatures, using regression ... 43
Summary ... 45
Conclusions and Recommendations for Further Research ... 46
Appendices ... 50
Appendix A: Optimising the model and acceptance criteria... 50
Appendix B: Bias introduced from uneven temperature in the dwelling ... 52
Appendix C: Plots of non-significant relationships between construction and in-situ U-value ... 53
Appendix D: Finding confidence ranges in the in-situ U-value estimates ... 54
Appendix E: Analysis of cavity temperatures and air speed ... 55
Appendix F: Validating methods ... 57
Appendix G: Analysis of in-situ U-value and location on the party wall ... 59
Authors: Jason Palmer, Nicola Terry, David Johnston, Dominic Miles-Shenton, Christopher Gorse, Peter Pope Quality Assurance: Ian Cooper
P a g e | 1
Executive Summary
CAR, Leeds Beckett University and Bridgewater Surveyors worked jointly together to carry out detailed measurements of heat loss through party walls in English homes for BEIS. The work started in November 2016 and ran until July 2018.
Over the course of two winters, we collected and analysed data from 284 sets of
equipment, installed in 54 homes with uninsulated cavity party walls. The equipment in each case comprised as a minimum of a heat flux plate, wall and air temperature sensors, an external
temperature sensor and a temperature sensor in the dwelling next door (the other side of the party wall). We trialled and used different methods of installing and arranging equipment in homes – ranging from three to 30 sensors installed on party walls of different homes.
For a subset of five homes, we carried out ‘invasive’ measurements that included drilling holes into the party walls and measuring air velocities in the cavities. We also depressurised these homes using a blower door, and used thermographic imaging and a smoke generator to examine air paths exiting the party wall. Where possible, in these homes we also raised floorboards or removed skirting boards to examine the junction of the party-wall with the floor.
For a separate subset of five homes, we also instrumented both sides of the party wall, providing heat-flux measurements from both the main house and the neighbouring dwelling. This provided an opportunity to validate our methods.
Separately, in addition to these scientific measurements, we also carried out statistical work using drawings submitted in planning applications to identify whether homes built since 1980 had solid or cavity party walls.
This report describes our experience of recruiting households into a scientific study, how we carried out measurements, and the new and innovative methods we used for analysing these measurements. It also summarises findings from all of the homes we instrumented, as well as the statistical work we carried out using planning applications.
Findings
Given that temperatures vary over time in real homes, and because heat moves between
neighbouring dwellings as well as from inside to outside, U-values in real homes cannot be measured directly1. The in-situ U-values cited in this report have been estimated through modelling based on detailed measurements taken in occupied homes.
Spot measurements of in-situ party wall U-values varied significantly from location to location even in the same dwelling. This indicates there are considerable local factors (including proximity to external walls, the floor, the roof, as well as construction anomalies such as mortar ‘snots’ and wall ties bridging the party cavity) that affect measured in-situ U-values. There was up to a four-fold difference between measured U-values in a single dwelling (from 0.3 to 1.3 W/m2K). There were even larger differences between measured spot U-values in different homes (more than 100-fold).
For homes with un-insulated cavity party walls the mean was 0.21 W/m2K. The highest average value for a property, from 284 measurements in total, was 0.81 W/m2K, and this was a bungalow with an uncapped full-height cavity in the party wall, cavity-wall insulation in the external walls, a suspended timber floor, and blockwork cavity wall construction. There were six properties with un-insulated
1 This is implicit in Building Regulations, where U-values are taken to be under steady-state conditions with building components in equilibrium.
Key Message
P a g e | 2
party walls with an in-situ U-value less than 0.05 W/m2K. These were a mixture of mid-terrace and semi-detached homes, with three different types of party cavity wall construction, with blockwork or brick party walls, and five out of six of them had solid concrete ground floors. This emphasises the finding, unknown previously, that the construction of the party wall is not a good indicator of its thermal performance.
The range of in-situ U-values is significant, indicating that heat loss from seemingly similar homes with cavity party walls may be four times greater in one than another – or even more if the home with a higher in-situ U-value has a larger party wall area. This means that the benefit of installing insulation in the party cavity can be four times or more beneficial from one home to another.
We could find no statistically significant correlations between heat loss through the party wall and dwellings being located in the North or South of England, or different construction in terms of block or brick, floor construction, external cavity-wall insulation or other characteristics that are discernible without carrying out detailed measurements. This suggests that other factors, including missing bricks or holes in the party wall, poor seals at the floor-wall, party wall-external wall and party wall-roof junctions, are more important than the construction type.
Using the mean in-situ party-wall U-values and taking the English Housing Survey average wall area for a semi-detached house (33m2) allows an approximate estimate of typical savings from insulating party walls. This suggests that insulating an average cavity party wall would bring savings in the region of 0.8% of gas use for a typical semi-detached property: from around 72 to 152 kWh a year,
depending on the house, heating and controls. This compares with typical savings from cavity wall insulation of 6.5%, or from around 580 to 1240 kWh a year (based on actual reductions in gas bills analysed in the National Energy Efficiency Data Framework). 2,3
We examined in detail the effect of wind speed on heat loss through the party wall in a subset of five dwellings. This did not support our hypothesis that higher wind speeds correlate to greater heat loss, which does not support carrying out interventions in dwellings in windy areas – based on the evidence we collected.
Segmenting homes
We identified four types of party wall:
Type 1: Solid wall (not of interest to this research, and specifically excluded from our sample) Type 2: Full-height cavity – with the cavity in the party wall extending all the way up to the
ridge of the roof
Type 3: Capped cavity – with a cavity wall built up to the floor joists in the loft, then a single-skin or block (or more commonly brick) extending up to the ridge in the roof
Type 4: Capped full-height cavity – with the top of the cavity capped with damp-proofing membrane, insulation, blocks laid sideways or other material where the party wall meets the roof.
However, we could find no statistically significant relationship between heat loss through the party wall and construction Types 2 to 4.
It is very difficult to say how many homes overall may be classified into these four categories. We examined planning applications for more than 2000 new homes built since 1980, in the North and the South of England. This suggested that a majority, 85%, of homes with party walls built since 1980 have cavity party walls (Types 2-4), but it was not possible to disaggregate further because the detailed party wall construction was not described in planning drawings.
2 BEIS (2018) NEED Framework Report: Summary of analysis 2018. London: BEIS.
https://www.gov.uk/government/statistics/national-energy-efficiency-data-framework-need-report-summary-of-analysis-2018
P a g e | 3
Our physical inspections from inside the roofs of a smaller sample of homes in the North and the South – 110 homes in total, all built from 1940 to 2010 – suggested that half had solid party walls (Type 1), with the remainder divided into 63% full-height cavity (Type 2), 17% capped at the roof joists (Type 3), and 20% capped at the ridge (Type 4). If this modest sample is representative of the whole English housing stock, then there are around 7.3 million dwellings with potential for insulating party walls. This estimate should be treated with some caution, and the likely range is 6.6 to 8.0 million homes.4 The theoretical ‘technical potential’ from insulating all cavity party walls in England would be 0.5-1.2 TWh.5
Recruitment
Despite paying incentives from £50 to £400 to participant households, it was extremely difficult to recruit homeowners and people renting social housing to participate in the study. We used multiple approaches to recruitment – approaching social landlords, posters, social network recruitment drives, website advertisements, cold-call knocking on doors in targeted areas, distributing leaflets, in-house company staff bulletin boards, and university and school mailing lists. The most successful method of recruitment was by face-to-face meetings with existing social, family or professional connections.
This could be evidence of a low level of interest in energy efficiency among householders. There was limited awareness among households of energy efficiency more broadly: either opportunities for improving energy efficiency, or how to set heating controls for optimum efficiency. It appeared that energy efficiency upgrades of homes to save energy or improve comfort seldom take priority over other pressures on people’s time.
4 The range is estimated based on a sampling error of up to 10% for homes identified as having cavity party walls. The 10% figure is based on the sampling error from the much larger English Housing Survey, which has annual inspections of 6,200 dwellings, with two years of inspections data
combined, and where the sampling error for house type ranges from 2% to 24%. (Table 7.3B, 2016-17 English Housing Survey Technical Report – Standard error tables).
P a g e | 4
1.
Introduction
BEIS commissioned this research in 2016 to collect robust evidence about heat loss through cavity party walls. The Department needed sound scientific measurements and as large a sample as possible, accepting that it can be difficult to recruit households into such studies. This was to build on more limited studies of small numbers of homes carried out previously.
The objectives of the work were:
1. to estimate in-situ U-values of cavity party walls in real homes when they are occupied. 2. to estimate how many homes, nationally, have cavity party walls.
The aims were not to carry out lab-based measurements in very strictly controlled conditions (as happens with conventional U-value measurements, undertaken using a hot box), with no air
movement and heat transfer in only one direction. This project undertook real-world measurements, which are subject to the complexities of real homes, heat moving in different directions and changing in direction and magnitude over time, and the realities of neighbouring homes, which can have very different heating regimes.
Previous work carrying out in-situ U-value measurements had indicated that the U-value near the edges of a cavity party wall can be as much as 0.9 W/m2K – significantly higher than the U-value of an insulated external cavity wall. 6 The prospect of a new opportunity for the Government to intervene to encourage a different method of insulating homes is all the more significant now that most homes with easy-to-treat external cavity walls have already insulated them, and most homes with
inadequate loft insulation (say less than 100mm) and accessible lofts have also already been treated. The Government needed more evidence to decide whether adding insulation to cavity party walls is a worthwhile intervention to support.
Heat loss through cavity party walls is important not so much because of heat passing from one house to its neighbour (because this is a very small proportion of heat loss through party walls, likely to be less than 5%), but more because of heat loss to the outside – see Figure 3.3, page 13. If there is evidence of significant heat loss through the cavity party wall to the outside, there may be a case for Government incentives or subsidies to encourage homeowners, registered social housing providers and private landlords to insulate cavity party walls.
Context: History of Party Wall Construction in the UK
The construction of party walls in the UK has evolved over time, and quite likely geographically, as a result of local by-laws introduced as a result of the Local Government Act of 1858, which gave local authorities the power to regulate buildings, and also local builder preferences. Nearly all party walls constructed before 1945 are solid, so do not bring the risk of thermal bypass through walls like cavity party walls, or offer potential for insulating a cavity. From 1945 to 1965, some homes have solid and others cavity party walls, but when the party wall is constructed from blockwork, cavities appear to dominate.
From 1965 onwards, to reduce noise from one home to the next, party walls were typically of cavity construction. Typically, the cavities were built 50 to 80 mm wide. The first UK-wide Building
6 Farmer, D., Miles-Shenton, D., Glew, D., & Fletcher, F. 2016. Quantifying the Effect of Approved Document L1a Party Wall Thermal Bypass Mitigation Methods in Retrofit. Research Report to BEIS. Leeds: Leeds Sustainability Institute.
Key Message
P a g e | 5
Regulations7, published in 1965, and the revised set in 1972, allowed three forms of construction for party walls:
solid brick or blockwork party walls, with mass of at least 415 kg/m2
a cavity of at least 50mm, with two leaves of brick or block with mass of at least 415 kg/m2 a cavity of at least 75mm, with two leaves of lightweight concrete with mass of at least
250 kg/m2.
There is nothing in the 1972 Building Regulations about capping party walls or different party wall construction above the joists in the loft. However, a cavity wall to the level of these joists, capped with a single-skin brick wall above, is likely to have been more economical to build than either a full-height cavity or a heavyweight solid wall.
For homes built from 1945 to 1965, there is some evidence from the chimney location and
construction about the nature of the party wall. If the chimney is located on the line of the party wall (often apparent from outside), and the chimney is narrow (five ‘stretcher’ bricks wide or less), the party wall cannot have a full-height cavity. If the chimney is set back from the party wall line, it is much more likely there is a cavity wall. A wide chimney is also evidence of a cavity party wall, and a chimney width of more than five bricks indicates that the dwelling may have a cavity party wall.
Types of Party Wall
This research has identified four construction types of party wall, see Figure 1.1 overleaf:
Type 1: Solid wall (not of interest to this research, and specifically excluded from our sample) Type 2: Full-height cavity – with the cavity in the party wall extending all the way up to the
ridge of the roof
Type 3: Capped cavity – with a cavity wall built up to the floor joists in the loft, then a single-skin or block (or more commonly brick) extending up to the ridge in the roof
Type 4: Capped full-height cavity – with the top of the cavity capped with damp-proofing membrane, insulation, blocks laid sideways or other material where the party wall meets the roof.
P a g e | 6
P a g e | 7
2.
Previous Work on Heat Loss through
Party Walls
Past research work 6,8 indicated that filling party walls can reduce the whole house heat-loss coefficient (measuring overall heat loss, in Watts per Kelvin) by around 24%, on average, see below. Some studies also showed that heat flux
measurements vary at different locations along the party wall, for example higher towards the edges. 5 However, these studies were usually restricted to one house and control over conditions on the other side of the wall was not always perfect.
In this project we developed a method to estimate heat loss to outside under varying conditions on both sides of the wall. As well as clarifying how much heat is lost to outside, this enabled us to perform monitoring in a much larger sample of homes: a total of 54 homes. We also performed much higher-resolution intensive monitoring in four cases to further our understanding of the pattern of heat loss to outside through the party wall.
Past work by Leeds Beckett University
Leeds Beckett University (LBU) has carried out research of heat loss from cavity party walls since 2003 (both insulated and uninsulated), including the Stamford Brook field trial. 8 The Stamford Brook study identified significant heat losses via party wall cavities (thermal bypasses) in new-build terraced and semi-detached masonry houses, and proposed various techniques to measure, eliminate or minimise the effect.
In 2008, EURISOL (now MIMA) commissioned LBU to quantify the thermal bypass effect in more detail and to evaluate whether insulating the party wall cavity with mineral wool would eliminate or significantly reduce this. LBU and MIMA continued this work, investigating different layouts and construction types, and expanding from new build dwellings to existing dwellings with cavity party walls. Other projects undertaken by LBU also provided evidence about the proportion of dwelling heat loss attributable to party walls, although full-scale party wall testing (with precise control of environments on both sides of the party wall) usually proved cost-prohibitive.
The Stamford Brook field trial measured the energy performance of dwellings, comparing designed energy efficiency and as-built building fabric efficiency. Whole house aggregate heat loss
measurements of dwellings were conducted from 2005 to 2007, and initial results showed the greatest disparities between designed and realised fabric efficiencies in mid-terraced dwellings. The gaps were narrower (but still significant) for end-terraced/semi-detached dwellings.
A second phase of whole house fabric tests was conducted on two pairs of properties with horizontal cavity socks built into the party wall cavities at loft insulation level. These cavity socks were then removed midway through an electric ‘co-heating test’ (based on maintaining constant even and elevated temperatures in empty homes, for up to three weeks, using fan heaters and fans). In both cases, a pseudo internal-to-external steady-state one-sided U-value (effective U-value) was derived for the party walls to allow comparisons to be made with standard steady-state heat loss models.
The effective U-values with the socks in place were 0.18 and 0.26 W/m2K, and with the sock removed these rose to 0.63 and 0.50-0.64 W/m2K, respectively. These values were broadly similar to those reported on by Siviour (1994) of between 0.44 and 0.85 W/m2K for masonry cavity party walls, in a paper largely forgotten by the house-building industry. 9
8 Wingfield, J., Bell, M., Miles-Shenton, D., South, T. & Lowe, R. 2011. Evaluating the impact of an enhanced energy performance standard on load-bearing masonry domestic construction - Understanding the gap between designed and real performance: lessons from Stamford Brook. HMSO, London. ISBN: 978 1 4098 2891 4
9 Siviour, J.B. 1994.Experimental U-values of Some House Walls. BSERT, 15, 1. Pp 35-36
Key Message
P a g e | 8
The initial MIMA study measured the whole-house heat loss of a masonry, end-terrace property from January to April 2009, where the party wall was filled with blown mineral wool insulation midway through the period. 10 Extensive measurement and monitoring equipment was installed in the test house and the adjacent mid-terrace property to ensure accuracy and prevent misinterpretation of observations and findings. LBU also monitored:
external atmospheric conditions (air temperature, wind speed, relative humidity, solar insolation)
electrical energy input using in-line kWh meters (more accurate than current clamps) external temperature and relative humidity
party wall surface and cavity temperatures external wall surface and cavity temperatures
differential pressures between inside/outside and inside/cavities
CO2 concentrations (using a pulsed-release system) to monitor ventilation, and air movement in the party wall cavity, using hot-wire anemometers.
LBU also used heat flux sensors fixed internally on party and external walls, carried out thermal imaging, used a borescope to view inside the cavity, and ran blower door tests at strategic stages. The results showed that with the only intervention being filling the 57 m2 party wall cavity with blown fibre insulation, the heat loss coefficient of the end-terrace reduced from 229.1 W/K to 191.4 W/K, resulting in a reduction in the effective U-value of the party wall of 0.66 W/m2K. Heat flux
measurements confirmed that post-fill, the heat flow measured into the party wall had been reduced to that attributable to conduction (due to temperature differences across the party wall) and thermal bridging alone, with the party wall bypass mechanism effectively eliminated.
Subsequent MIMA studies investigated cavity party wall heat losses of different new-build
construction types and build forms. 11 These studies included timber-framed dwellings and a variety of masonry cavity dwelling forms, with samples of both fully-filled and partially-filled external walls. Results from the Eurisol/MIMA test dwellings are shown in the table below. It was not possible to measure or estimate U-values before or after the interventions directly. Consequently, the reductions in effective U-value wereobtained byestablishingsteady-state conditions on either side of the party wall and measuring the whole house heat loss (with a co-heating test), then measuring the same heat loss after the party wall was insulated, with no other changes to either building envelope or adjacent zones.
10 Wingfield, J., Miles-Shenton, D., Bell, M. & South, T. 2009. Investigations of the Party Wall Thermal Bypass in Masonry Dwellings. Final Report. Report to Eurisol. Leeds Beckett University.
P a g e | 9
Table 2.1: Predicted, measured and improved fabric heat loss from insulating party walls
Test House Predicted Fabric Heat Loss† (W/K) Measured Fabric Heat Loss† (W/K) Reduction due to PW Filling (W/K) Party Wall Area (m2)
Reduction in PW effective U-value (W/m2K)
BD1 (PW
empty) 88.9 186.2 45.1 64 0.70
BD1 (PW filled) 88.9 141.1
BD2 (PW
empty) 63.2 186 35.6 64 0.56
BD2 (PW filled) 63.2 150.4
DA1 (PW
empty) 96.8 107.7 13.1 25.76 0.51
DA1 (PW filled) 96.8 94.6
DA2 (PW
empty) 110 122 13.6 25.76 0.53
DA2 (PW filled) 110 108.4
LA1 (PW filled) 99.4 125.2 No intervention
LB1 (PW empty) 79.6 168.7
57.5 44 1.31
LB1 (PW filled) 79.6 111.2
LB1 (PW + external wall filled)
77.2 86.8
LB2 (PW empty) 63.3 186.8
92.6 88 1.05
LB2 (PW filled) 63.3 94.2
LB2 (PW + external wall filled)
62.3 70.2
DE1 (PW
empty) 104.2 148.5 24 47.7 0.50
DE1 (PW filled) 104.2 124.5
†Excluding ventilation heat losses
Both the Stamford Brook and Eurisol/MIMA projects used electric co-heating tests12 to specifically measure changes in whole house performance due to an intervention to the cavity party wall, thus obtaining a reliable thermal characteristic of the entire party wall. These studies resulted in academic papers, with Lowe et al. (2007)13 possibly the most cited and influential. The results also stimulated changes to UK energy policy, with the 2010 Building Regulations introducing heat loss from cavity party walls into subsequent dwelling heat loss and emissions evaluations. Other projects by LBU since have allowed some measurement of heat loss via the entire party wall, and most have relied on point measurements based on heat flux sensor readings accrued to provide indicative in situ “whole-wall” values.
Studies undertaken in Manchester between 2011 and 20159, in conjunction with Knauf Insulation, measured the party wall as part of a whole-house analysis, but were not tests designed specifically to determine the effective U-values of party walls. The results produced a range of values (see Table 2.2
12 Johnston, D., Miles-Shenton, D., Farmer, D and Wingfeld, J., 2013. Whole House Heat Loss Test Method (Coheating). Leeds Beckett University, Leeds.
P a g e | 10
and Figure 2.1 below) due to heterogeneous internal conditions in neighbouring dwellings, caused by radiator placement, stratification, solar impingement and heat sources (electrical appliances) next to the party walls. These used point heat flux density measurements to confirm that similar in-situ effective U-values were exhibited in existing masonry dwellings with full height (ground floor to ridge) cavity party walls. In a number of cases electric co-heating tests were performed on one side of the party wall, with room temperatures on the opposite side of the party wall used in combination with measured heat flux density to calculate effective party wall U-values.
Table 2.2: Effective U-values of unfilled and filled party walls in Manchester (Source: Farmer et al, 2017)
Dwelling Detail Measured Effective
Party Wall U-value - Unfilled
Measured Effective Party Wall U-value - Capped
Measured Effective Party Wall U-value - Filled
1. 1960s Existing terrace house, 60mm cavity, concrete brick, wet plastered, 2 storey
0.62 ~ 0.73 W/m2K 0.0 ~ 0.05 W/m2K
2. 1950s Existing terrace house, 65mm cavity brick, wet plastered, 2 storey
0.7 ~ 1.2 W/m2K 0.0 ~ 0.2 W/m2K
3. 1965 Existing terrace bungalow, 70mm cavity, concrete block, wet plastered
0.6 ~ 1.0 W/m2K 0.0 ~ 0.1 W/m2K
4. 1970s Existing terrace house, 60-65mm cavity, concrete brick, wet plastered, 2 storey
0.24 ~ 0.40 W/m2K 0.02 ~ 0.03 W/m2K
5. 1957 Existing terrace house, 50-55mm cavity, concrete brick, wet plastered, 2 storey†
0.18 ~ 1.27 W/m2K 0.05 ~ 1.05 W/m2K 0.0 ~ 0.75 W/m2K
P a g e | 11
[image:14.595.93.543.73.332.2](Source: Farmer et al. (2017) Quantifying the Effect of Approved Document L1a Party Wall Thermal Bypass Mitigation Methods in Retrofit)14
Figure 2.1: Distribution of in-situ U-values along a section through the party wall. From the front of the house to the back
A similar investigation of a warm-roof, closed-panel timber frame property in York identified lower effective U-values for the cavity party wall – between 0.25 and 0.44 W/m2K (depending on location, away from junctions and bridges) – but this identified air exchange between the party wall cavity and sub-floor void as the bypass mechanism, rather than interaction with the party wall cavity in the loft space as reported elsewhere. 15
The residual problem, taking into account all of this past work, is threefold:
1. To assess how representative these small samples are of the larger population of all English homes with party walls – do these results reflect in-situ U-values of all English homes?
2. To develop ways of estimating U-values in-situ, with real-world fluctuating temperatures – do such measurements represent true heat losses through party walls more effectively than standard hot box measurements?
3. To estimate the energy savings that might be possible from insulating cavity-party walls with these in-situ U-values – what difference does party-wall insulation make to overall energy efficiency?
14 Farmer, D., Miles-Shenton, D., Glew, D., & Fletcher, F. 2016. Quantifying the Effect of Approved Document L1a Party Wall Thermal Bypass Mitigation Methods in Retrofit. Research Report to BEIS. Leeds: Leeds Sustainability Institute.
P a g e | 12
3.
Methods
4.
This part of the report is divided into three sections. First, we describe our approaches to recruiting households to participate in the study, including insights we acquired about how best to recruit for scientific research, and whether this applies to householder motivations and barriers to energy efficiency work. Second, we describe the standard approach to instrumenting homes, used for the majority of party walls where we took
measurements. Third, we explain the ‘intensive’ and
‘invasive’ methods of instrumenting we used where we obtained special consent to take more detailed measurements.
Recruitment
We used a variety of different methods to recruit households into the study:
• Contacts with five housing associations (estimated reach: 10 people, responsible for 10,000 homes).
• Advertising through sustainability oriented groups, such as Transition Cambridge (nearly 2000 recipients) and Cambridge Carbon Footprint (estimated reach: 2500 people).
• Advertising through large local employers, like the European Bioinformatics Institute, the British Antarctic Survey, the University of Cambridge and Leeds Beckett University, using electronic noticeboards and emails (estimated reach: 2600 people).
• Leaflets and door-to-door visits in Ely, Cambridge and Hatfield (200 each, targeted in areas with housing of the requisite age). (Estimated reach: 600 people)
• Social network advertisements, using Facebook: both personal accounts and a local forum account called ‘We are Hatfield’.(Estimated reach: 400 people)
• Word-of-mouth, through personal networks and by asking early recruits if they knew anyone else who would be interested. (Estimated reach: 200 people)
We offered a cash incentive of £100 per home for participants, paid in two stages: £50 on installing the monitoring equipment, and £50 on removal. We paid a smaller incentive of £50 to neighbouring dwellings for accommodating temperature loggers, which are small and less obtrusive than the other measuring equipment. (Larger incentives, but to £400, were paid to participants in invasive tests, see below.) We carried out some pre-filtering of dwellings, by asking only households living in homes built from 1945 to 2010 to volunteer. In most cases, there was some dialogue by telephone or email before participants were recruited. This dialogue included a discussion of the party wall construction, but in most cases households did not know whether their homes had cavity party walls.
We also had access to Bridgewater Surveyors’ work for one of the big six energy companies, who had a project underway to insulate the party wall cavities of 300 properties. (This was a pilot project, designed to explore practical aspects of insulating party walls at scale, and how much this really costs.)
By far the most successful method of recruiting households was through existing personal contacts – leading to roughly half of the participants in the study. We believe (based on asking participants about this) that this was because of trust in the contact, and a desire by recruits to be helpful to the friend or family member that suggest they participate. This seemed to be as important a factor in participating as the financial incentives.
The second most effective method of recruiting people was by asking participants in the study to suggest other people they knew who might also be willing to take part. This led to around a quarter of the overall recruitment, and often included family members of the first participant.
Key Message
We invested considerable effort into recruiting households into the study, and even with a cash incentive it proved difficult to attract
P a g e | 13
Depending on financial and social pressures on a household, we found that sometimes cash incentives were effective as prompts to participate, but on other occasions they were unimportant (people chose to take part simply to contribute to a scientific enquiry, and the cash was a bonus).
Inspecting properties
Before we could install measuring equipment in any of the dwellings, we had to ensure they had cavity party walls. Our prior work suggested that approximately half of homes built from 1945 to 2010 had cavity party walls (either capped or full-height cavities). This meant we had to over-sample the recruitment to be sure of getting enough cases to instrument.
In most but not all cases, it was possible to identify the party wall construction from the loft: the brick pattern in the loft often showed whether the wall was solid or cavity construction. The chimney construction also offered some clues, and in some cases there were gaps in the brickwork (either the pointing or whole bricks missing) that allowed a definitive identification. In other cases, a capped cavity could be definitively identified by examining the junction between the loft party wall and the party wall in the occupied part of the dwelling (below the joists). In these cases there was a clear step from the single-skin wall in the loft to a wider cavity wall below the joists.
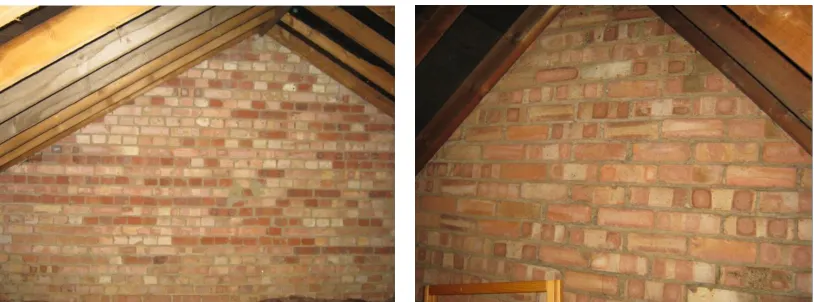
[image:16.595.93.500.312.463.2]
Figure 3.1: The brick pattern in the loft often provides clues about construction. Here, photo on the left shows a solid wall construction two bricks thick (notice the short ‘header’ bricks alternating in each course with longer ‘stretchers’). The photo on the right is a full-height cavity-party wall (with all ‘stretcher’ bricks laid with the long side visible).
However, in some cases it was not possible to identify the wall construction definitively by inspection alone. Thick loft insulation sometimes meant it was not possible to access the wall. Some walls were also impossible to identify definitively even when access was possible – especially block walls that extended all the way to the roof lining, with good pointing. Two lofts also had plasterboard on the party walls, which also made definitive identification impossible.
In three cases we obtained consent to drill the walls to make a definitive diagnosis of the wall construction. Two of these led to exclusions, while the third was a positive identification.
When we obtained a positive identification of a cavity party wall, we tried to recruit the neighbouring household, so we could install measuring equipment on their side of the party wall. There were six instances when the neighbour was not prepared to participate, so both dwellings had to be omitted from the study. (This meant repeating the recruit-inspect cycle again for other households.) There were also two instances of the main householder pulling out even after the inspection and agreement was secured with the neighbour.
P a g e | 14
Figure 3.2: Recruitment involved five stages of contact, inspection and instrumentation.
Although we cannot be certain how many householders saw our various methods of advertising, we estimate that more than 6,000 people saw them (see breakdown above). Some of these would have self-selected out of the study because their homes were not built from 1945 to 2010, or because they did not have cavity party walls (in the relatively rare instances when they knew about their party-wall construction). From advertising onwards, we know that there was attrition at each stage of the recruitment, with around a quarter deciding not to participate when we spoke to them and they learned what was involved. Half (56 out of 110) of those we inspected proved not to have cavity party walls (or at least, we were not able to make a definitive identification as a cavity party wall). A minority of homes – around 5% of those positively identified as cavity party walls then dropped out because “they were too busy”, or they had family or work commitments that meant they were unable to participate. Two positively identified homes also withdrew because the neighbour was unable or unwilling to participate (both of these were linked to longstanding neighbour disputes). On one occasion a landlord was unwilling for the dwelling he owned to be instrumented, even though the occupant and neighbour were willing to participate.
What does this tell us about householder motivation for energy efficiency?
It would be a mistake to infer from this low level of participation and relatively high levels of attrition – even with a clear financial incentive – that people are disinterested in energy efficiency. However, there is limited evidence from people who expressed interest and then did not participate in the study and the reasons they gave for not following through, and this is revealing about the weight they put onto scientific research and energy efficiency in their own homes relative to other demands on their time. Where possible, we gently probed the reasons why householders decided not to go through with the research.
The clearest barrier to participation was simply that people have busy lives, and consequently they are unable or unwilling to suffer intrusions into family life. They commonly cited inflexible work or family arrangements that made it difficult for people to commit to being at home at specific times as reasons they could not participate. We also picked up on (from both households who dropped out and those who went through with the research) embarrassment about their homes and wariness about allowing strangers in. Some people also made clear there were only indirect and weak links in their minds between insulation measures and energy bills and/or comfort.
For these reasons the sample of households (distinct from dwellings) was biased towards those who were either scientifically orientated – accounting for at least half of recruits in Cambridge – or concerned about energy and climate change – accounting for around half of participants overall. (There was an overlap, with some households both science-orientated and interested in energy and climate change.) There is no evidence that this bias affected the selection of dwellings, or
construction types, or party-wall characteristics of the dwellings we instrumented.
The very limited conclusions to be drawn from this relating to energy efficiency interventions generally are a) that energy efficiency currently tends to be low priority for most households compared to other concerns, and b) households that do give attention to energy efficiency and upgrading their homes may tend to be more science-orientated and/or more concerned about energy and climate change than the population at large. The first conclusion is not new. For households that are not strongly motivated by science or energy and climate change, the benefits of learning about potential energy efficiency opportunities are uncertain and apparently insufficient to offset the costs, including the hassle connected with making appointments for equipment installation, and a general dislike of letting strangers into the home.
Advertise
Speak to candidate households
Inspect homes to check PW construction
Speak to neighbour
P a g e | 15
Instrumenting homes: standard measurements
In all cases, before installing measuring equipment, we inspected each home and obtained the owner’s consent to carry out research. The inspection included entering the loft and definitively identifying which type of party wall was involved, then, in each case, we carried out:
A thermographic survey of each side of the party wall (including the loft) to provide qualitative evidence for any existing thermal bypass. The survey was also used to identify areas suitable for U-value measurement.
A survey of the neighbouring dwelling to identify the locations of heat emitters (e.g. radiators, cookers) which could compromise U-value measurements in the test house.
Subsequently, we installed the following monitoring devices:
Three to five Hukseflux HFP01 heat flux plates (HFPs) installed on each party wall in areas considered to be unaffected by thermal bridging at junctions, away from notable thermal anomalies, and away from heat sources. Based on previous research, we installed the HFPs in the middle third of the party wall vertically, and 300mm away from external walls, to avoid extreme measurements from thermal bridging. We recorded heat flux density at 10-minute intervals using Leiderdorp LI19 battery powered data loggers.
We also installed surface thermocouples (TinyTag TGU-4510s, with integrated thermistor probes) adjacent to each heat flux plate, providing a record of air and wall surface temperatures immediately next to each heat flux plate.
We also recorded the external air temperature close to each property measured, using a TinyTag weather station encased in a Stevenson screen, mounted 1.5m off the ground, where possible at least the height of the nearest building horizontally away from that building.
From one to four air temperature sensors in the neighbouring home, installed in locations selected to be representative of the average air temperature of the dwelling.
We left all measurement equipment in place for a minimum of three weeks. (Extended from the fourth set of installations of the first winter because feedback from the first sets of installs suggested a longer monitoring period would be beneficial. We also switched to using two or more additional neighbour temperature sensors, so all three sensors were installed as close as possible to the wall opposite the heat-flux plates in the main house. Again, analysis of the first two sets of installs suggested this would help to improve the reliability of measurements.)
Intensive and invasive measurements
We carried out ‘intensive’ measurements in four homes that were unoccupied, where it was feasible to install many more heat flux plates and temperature probes than in occupied homes – up to 30 across a party wall (see Figure 3.3 below). ‘Invasive’ measurements could be carried out in five homes where we had consent to drill holes into the party wall and, in some cases, to remove skirting boards and carpets to inspect the party wall-floor junctions.
P a g e | 16
Figure 3.3: Unoccupied homes allowed intensive measurements and a far higher resolution of measurements across the party wall.
In five of the ‘Invasive’ houses, in addition to inspecting the party wall-floor junctions, we were able to carry out pressurisation and smoke tests and identify the main areas of air leakage. On five occasions, we were also able to install flux plates on the other side of the party wall also, which gave the opportunity to log heat loss from both sides of the party wall.
We also installed two weather stations, 800mm above the eaves at the front and back of the house, see Figure 3.4 below.
Figure 3.4: The weather stations paired wirelessly to a terminal recording temperature, wind speed and direction, atmospheric pressure and rainfall.
We also drilled two 16mm holes into the party wall at different locations (ground floor, first floor, and front and back) and inserted hot wire anemometers into the holes. The anemometers were
P a g e | 17
In addition, we installed a blower door to depressurise invasive test-houses temporarily and look for evidence of heat loss for half a day. We also carried out smoke tests, injecting smoke into the party wall, to identify obvious air pathways out of the party wall.
Analysis
Measurements alone tell very little, because they need to be interpreted in combination – heat flux with surface, neighbour and external temperature – and because there is considerable noise in the data (due to temperature variations, lag effects, and heat moving in different directions). It is only with appropriate analysis that they become meaningful. Normally a U-value describes the rate of heat transfer across a wall from inside to outside. This is normally a steady-state of thermal equilibrium for the whole structure, with heat passing in only one direction (in reality this only ever happens in the lab). However, in the case of party walls heat transfer occurs both along (up and out, towards the roof and external walls) and through the wall (to the dwelling next door, see Figure 3.5). We are interested mainly in the heat transfer along the wall from inside to outside, because this is the main opportunity for saving energy and reducing carbon emissions.
Figure 3.5: In a party wall heat travels both along (upwards and sideways) the party wall, and through it (to the neighbouring property). This makes analysis more complicated and calls for a model in analysis.
The in-situ U-value that we want to measure, which we refer to as Ue, is the heat flux from one side of the party wall to outside (ultimately through the roof and the external walls), divided by the
temperature difference between the internal Troom and outside Text. Any difference in air temperature measured between the test dwelling (Troom) and the adjacent dwelling (Tadj) is also taken into
consideration.
To determine the in-situ U-value for the cavity party wall we have developed a new mathematical model, based upon the measured heat flux density and the corresponding temperature conditions. The model has parameters including thermal resistance and capacitance, and we vary these until the model closely matches the measured heat flux16. Three thermal resistances are important: from the room to the wall, from one leaf of the party wall to the other leaf, and from the party wall to outside (see Figure 3.6 below). Each of these has corresponding heat flux (again, from room to wall, leaf to leaf, and from the wall to outside). The party wall also has thermal capacitance, and we consider the thermal capacitance of both leaves of the wall together. We use the model to calculate what the heat flux would be if the two homes were always at the same temperature, so there is no transverse heat flux through the party wall, driven by differences in room temperature.
P a g e | 18
Key
Rr resistance from room to wall Rc resistance across cavity from one leaf to the other Re resistance from wall leaf to outside Fl heat flux from the room the wall (across Rr on the left) Fc heat flux across the cavity (across Rc) Fe heat flux from the wall leaf to outside (across Re) C thermal capacitance of wall
TrL, TrR, room temperatures left and right TwL, TwR, wall temperatures left and right Text External temperature
[image:21.595.83.510.171.394.2]Measured values: TrL, TrR, Text Modelled and compared with measurement: Fl
Figure 3.6: A mathematical model is used to calculate heat flux when dwellings on either side of the party wall are the same temperature
We assume that the two sides of the cavity wall are symmetrical in terms of same thermal resistance and capacitance, though not temperatures, as each house has a different heating regime. We ignore the capacitance of the air gap as this is very small. We know the room temperatures and external temperature Text. We use the model to estimate resistances (Rr, Re and Rc) and thermal capacitance (C). Then we calculate the in-situ U-value.
U = 1/(Rr + Re).
To test each set of parameters, we run the model to see what the heat flux density would be and compare this with the measured value. To run the model, we work in short time steps (our
measurement interval is 10 minutes). We use the temperatures to estimate the heat flux density and then the heat flux to estimate the new temperatures. For example, considering the left hand (TwL) wall from Figure 3.4:
Calculate heat flux density:
Fl = (Trl
–
TwL)/Rr Fe = (TwL–
Text)/Re Fc = (TwL–
TwR)/RcCalculate next value for TwL (t being the time interval):
P a g e | 19
In practice, we use the wall surface temperature rather than room temperature where it is known, because it is more reliable. We then apply an adjustment to allow for the surface resistance: 0.13 m2K/W.17
Fl = (Tsl
–
TwL) /(Rr -0.13)Running the model gives a sequence of values for the wall surface temperatures and, importantly, the heat flux density. We optimise the model to get the best fit for flux using the least squares error method. Put technically, this minimises the ‘sum of squares residuals’ where:
S = Σ (F1-F1actual)2
There were 15 cases where optimisation did not converge on a clear best fit set of parameter values. These have been excluded from the analysis.
An alternative approach is to maximise the likelihood function, which tells us how plausible estimated heat flux is, where likelihood is calculated using a probability distribution for the error in the heat flux measurement. However, in this case we found the results are almost identical to the least squares method and take considerably more time to compute. There is more detailed description of the model optimisation and acceptance criteria used in Appendix A.
Analysing Planning Drawings
Alongside our physical measurements, we examined planning applications submitted since 1980 for homes in Cambridge, Welwyn-Hatfield, Leeds and Manchester in considerable detail to establish what proportion of homes built in different decades had cavity party walls. This required us to interrogate large numbers of planning applications in electronic databases and as hard copies in the planning departments of the respective planning authorities, and inspect many different drawings of each site or dwelling.
In many cases, the party walls were not drawn clearly enough to show the wall construction in planning drawings, so although we examined planning applications for more than 2000 new homes in total (all of the available drawings still held in the planning authorities’ archive), the party-wall construction was only visible in 1076 cases, see Table 3.1 below. There are regional variations between the planning applications we viewed (for example, many times more common to have cavity party walls in Welwyn-Hatfield and Cambridge, but roughly even split between cavity and solid party walls in Manchester), so we would not suggest that these proportions are nationally representative. The higher prevalence of cavity party walls in the South may suggest that there are proportionately more such dwellings in the South than in the North (indicating greater potential for insulating cavity party walls in the South), but we cannot be confident about this based on just four planning authorities.
Our sample is also skewed towards homes build more recently – since 2010 – because the drawings for these more modern homes are more commonly accessible than older homes. We were unable to obtain planning drawings submitted for any home built prior to 1980, and it is possible that the proportion with cavity party walls is different among homes built from 1940 to 1980.
P a g e | 20
P a g e | 21
5.
Findings
6.
Broadly, the findings from this research are of two types. First, evidence about the number of homes with cavity-party walls that could potentially be insulated economically. This helps to understand the number of homes where there is potential for retrofit measures, which could subsequently save energy and reduce carbon emissions. Second, evidence about the actual heat loss through party walls of different types – which helps to quantify what savings could be realised if large numbers of homes have their party walls upgraded.
We begin this section by reporting findings about the number of homes with different types of party wall.
How many homes have cavity party walls?
Viewed logically, most house types apart from detached homes could have one or more party walls. 18 The latest English Housing Survey tells us there were 12.3 million terraced dwellings in 2016-17, 11.3 million semi-detached dwellings, and almost 8 million flats. This compares to 7.9 million detached dwellings.19 This suggests that close to two-thirds of all homes in England have party walls.
However, only a proportion of these properties have cavity party walls. The English Housing Survey does not record whether dwellings have solid or cavity party walls. However, the recent planning drawings referred to in the previous section suggested that the majority (perhaps as much as 85%) of homes built since 1980 have cavity party walls. Our inspections of planning drawings also indicated regional disparities in the proportion of recent homes built with cavity party walls – 92% in Welwyn and Hatfield, compared to just 52% in Manchester.
It is entirely possible that local preferences, largely driven by volume house-builders and standardised housing designs, dictate whether party walls are solid or have cavities (both are permitted under current Building Regulations20, although solid party walls are required to use heavy-weight blocks or bricks to achieve acoustic separation between neighbouring dwellings).
It is not possible to determine from planning drawings whether the party wall cavity extends beyond the joists in the roof, or whether it is capped (either at the level of the top-floor ceiling joists, or at roof level). This means that planning drawings alone do not allow us to estimate what proportion of party walls are of the four construction types shown in Figure 1.1.
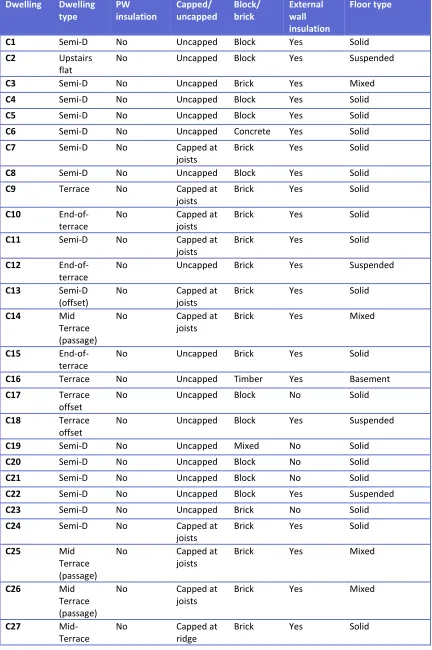
The only data we have to draw on comes directly from the house and loft inspections undertaken for this project. Table 4.1 below categorises each of the dwellings inspected and monitored in this project. (Two of the properties were measured twice – before and after the party walls were insulated – and one was measured in two different ways, in order to validate our main method.)
18 Flats that occupy the whole floor of a building are a special case without party walls, and single-aspect flats with a corridor on one side and no direct neighbour do not have party walls, but most flats do share one or more walls with a neighbouring property.
19 Ministry of Housing, Communities and Local Government (2018) English Housing Survey headline report 2016 to 2017: Section 2 housing stock tables. London: MHCLG.
https://www.gov.uk/government/statistics/english-housing-survey-2016-to-2017-headline-report
(Accessed 20 June 2018)
20 DCLG (2016) Approved Document E: Resistance to the passage of sound. London: DCLG. Page 20.
Key Message
We found that approximately one third of all English homes have cavity party walls that could be insulated. The mean in-situ U-value across our sample of 54 homes was
0.21 W/m2K, and three homes had ‘high’
U-values from 0.6 to 0.8 W/m2K. Generally, spot
P a g e | 22
Table 4.1: All study dwellings and construction parameters
Dwelling Dwelling type PW insulation Capped/ uncapped Block/ brick External wall insulation Floor type
C1 Semi-D No Uncapped Block Yes Solid
C2 Upstairs
flat
No Uncapped Block Yes Suspended
C3 Semi-D No Uncapped Brick Yes Mixed
C4 Semi-D No Uncapped Block Yes Solid
C5 Semi-D No Uncapped Block Yes Solid
C6 Semi-D No Uncapped Concrete Yes Solid
C7 Semi-D No Capped at
joists
Brick Yes Solid
C8 Semi-D No Uncapped Block Yes Solid
C9 Terrace No Capped at
joists
Brick Yes Solid
C10
End-of-terrace
No Capped at
joists
Brick Yes Solid
C11 Semi-D No Capped at
joists
Brick Yes Solid
C12
End-of-terrace
No Uncapped Brick Yes Suspended
C13 Semi-D
(offset)
No Capped at
joists
Brick Yes Solid
C14 Mid
Terrace (passage)
No Capped at
joists
Brick Yes Mixed
C15
End-of-terrace
No Uncapped Brick Yes Solid
C16 Terrace No Uncapped Timber Yes Basement
C17 Terrace
offset
No Uncapped Block No Solid
C18 Terrace
offset
No Uncapped Block Yes Suspended
C19 Semi-D No Uncapped Mixed No Solid
C20 Semi-D No Uncapped Block No Solid
C21 Semi-D No Uncapped Block No Solid
C22 Semi-D No Uncapped Block Yes Suspended
C23 Semi-D No Uncapped Brick No Solid
C24 Semi-D No Capped at
joists
Brick Yes Solid
C25 Mid
Terrace (passage)
No Capped at
joists
Brick Yes Mixed
C26 Mid
Terrace (passage)
No Capped at
joists
Brick Yes Mixed
C27
Mid-Terrace
No Capped at
ridge
P a g e | 23 Dwelling (cont.) Dwelling type PW insulation Capped/ uncapped Block/ brick External wall insulation Floor type
H28 Terrace No Not
discernible
Block No Solid
H29 Terrace No Capped at
ridge
Block No Solid
M30 Terrace No Capped at
ridge
Block No Solid
M31 Terrace No Capped at
ridge
Block No Solid
M32 Terrace No Capped at
ridge
Block No Solid
M33 Terrace No Capped at
ridge
Block No Solid
M34 Terrace No Capped at
ridge
Block No Solid
M35 Terrace No Capped at
ridge
Block Yes Solid
M35-ins Terrace Yes Capped at ridge
Block Yes Solid
M36 Terrace No Capped at
ridge
Block Yes Solid
M36-ins Terrace Yes Capped at ridge
Block Yes Solid
M37 Terrace No Capped at
ridge
Block Yes Solid
M37-ins Terrace Yes Capped at ridge
Block Yes Solid
M38 Terrace No Capped at
ridge
Block Yes Solid
M38-ins Terrace Yes Capped at ridge
Block Yes Solid
M43 Terrace No Uncapped Block Yes Solid
M44
End-Terrace Bungalow
No Uncapped Block Yes Suspended
M44-floor End-Terrace Bungalow
No Uncapped Block Yes Suspended
M46a Terrace No Uncapped Block Partial Solid
M46b Terrace No Uncapped Block Partial Solid
M48a Terrace No Uncapped Block Partial Solid
M48b Terrace No Uncapped Block Partial Solid
M50a Terrace No Uncapped Block Partial Solid
M50b Terrace No Uncapped Block Partial Solid
M52
Mid-terrace
No No Block Yes Suspended timber
M53 Mid
Terrace (passage)
No No Concrete Yes Solid concrete
slab on ground
M54 Mid
Terrace
No No Concrete Yes Solid concrete
P a g e | 24 Dwelling (cont.) Dwelling type PW insulation Capped/ uncapped Block/ brick External wall insulation Floor type M55-normal Mid Terrace
No Uncapped Concrete Yes Solid
M55-steady
Mid Terrace
No Uncapped Concrete Yes Solid
M57 Mid
Terrace
No Uncapped Block Yes Solid
W58
Mid-terrace
No Full-height Block No Solid
W59 End
Terrace
No Full-height Block No Solid
NB. M44 and M44-floor are the same dwelling with floor insulation added – this affected the party wall too, by improving the seal between the floor and party wall cavity. M46, M48 and M50 a and b give measurements from different sides of the same wall. We have removed duplicated cases to ensure that each wall only counts once in aggregate analyses.
Overall our sample included more terrace homes than other house types (see table below). We recruited as widely as possible, with no bias towards any specific dwelling type, age, or construction type, and we instrumented all homes with cavity party walls whose occupants and neighbours agreed to participate. However, the final sample over-represents terraces and under-represents semi-detached houses and flats, compared to national totals (see Table 4.2). Just over half (29 out of 54) had a blockwork party-wall construction, with a quarter (14) having brick construction and the rest concrete or mixed construction. A majority of them (29) were Type 2 full-height cavity party walls. Next most common were Type 4, full-height cavities capped where the wall meets the roof (15), and finally Type 3, with cavities capped at the roof joists (9).
Table 4.2: Dwelling types for instrumented homes
Dwelling type
Number Comparison with National Totals - Percentage of the stock*
Semi-D 15 25%
Mid-terrace
33 20%
End terrace
4 10%
Bungalow 1 9%
Flat 1 21%
Detached - 17%
Total 54 100%
*Source: MHCLG (2018) English Housing Survey 2016-17, Table 2.1. London: MHCLG.
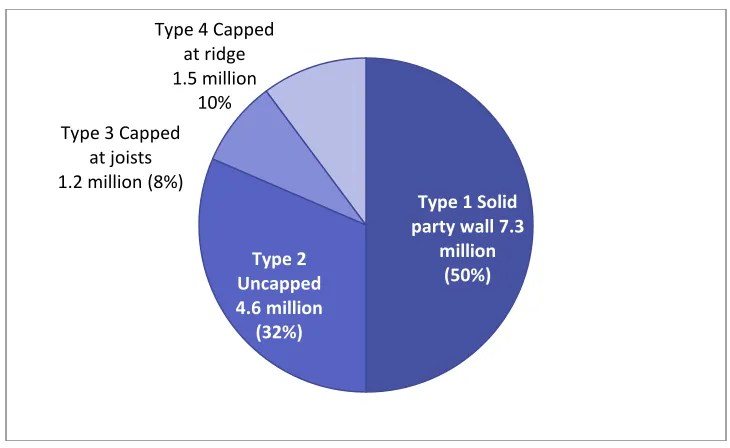
It is open to question whether our modest sample of 110 dwellings in the North and South of England where the loft was inspected to identify the party-wall type is representative of all homes in England. However, in the absence of any stronger evidence, and factoring up to all homes in England with party walls (i.e. excluding detached homes, using data from the English Housing Survey21), this suggests that 6.8 to 8.0 million dwellings have the potential for insulating the party wall cavity, see Figure 4.1 below.
P a g e | 25
Figure 4.1: Central estimate of number of homes with different party-wall types
Estimating spot in-situ U-values
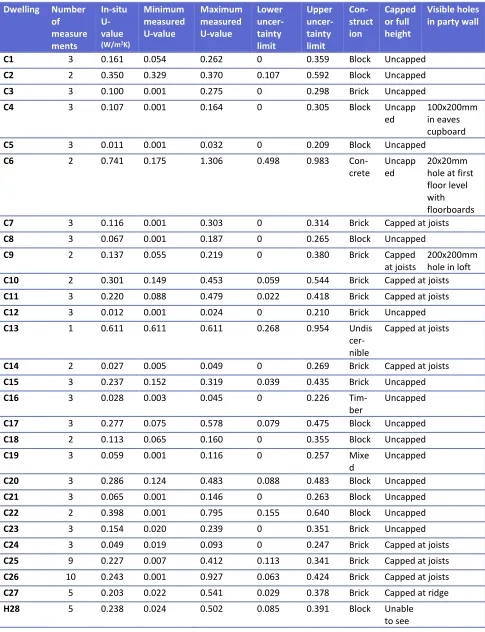
Overall U-values were estimated based on 284 measurements (comprising heat-flux density, surface temperature and neighbour temperature data) taken across 54 homes. (One of the homes was measured in two different ways to validate our methods, see ‘Validation’ section below, two had sensors attached to the party walls on either side, and a third had measurements taken before and after the ground floor was insulated.) Our results are shown in Table 4.3 below.
Our method for combining spot measurements of in-situ U-values to give an average for the property is described in Section 5 of the report, below. The simple mean across all instrumented homes came out at 0.20 W/m2K (95% confidence interval between 0.153 and 0.25). For homes with uninsulated cavity party walls the mean was 0.21 W/m2K (0.16 to 0.26). The highest average value for a property was 0.81 W/m2K (0.72 to 0.90), for a bungalow with an uncapped full-height cavity in the party wall, cavity-wall insulation in the external walls, a suspended timber floor, and block cavity wall
construction (M44a). There were three properties with in-situ U-value less than 0.01 W/m2K (M33, M36-ins, and M38-ins). All three properties were terraces, all with full-height cavities capped at the ridge, all with blockwork party walls and solid concrete ground floors. Two of these (M36-ins and M38-ins) also had retrofit party-wall insulation. (Two of only four homes in the study that had insulated party walls.)
Initially there appeared to be some correlation between the in-situ U-value and whether the party cavity was full-height (Type 2) or capped (Types 3 and 4). Of the 10 dwellings with the highest in-situ U-values, seven are full-height cavities, while of the 10 dwellings with the lowest in-situ U-values, seven were capped – either at the ridge or at the loft joists. However, statistical analyses showed that this was a non-significant relationship, see Appendix C.
Type 1 Solid party wall 7.3
million (50%) Type 2
Uncapped 4.6 million
(32%)
Type 3 Capped at joists 1.2 million (8%)
Type 4 Capped at ridge 1.5 million
P a g e | 26
Table 4.3: All instrumented homes and in-situ U-values (all simple means)
Dwelling Number of measure ments In-situ U-value
(W/m2K)
Minimum measured U-value Maximum measured U-value Lower uncer-tainty limit Upper uncer-tainty limit Con-struct ion Capped or full height Visible holes in party wall
C1 3 0.161 0.054 0.262 0 0.359 Block Uncapped
C2 2 0.350 0.329 0.370 0.107 0.592 Block Uncapped
C3 3 0.100 0.001 0.275 0 0.298 Brick Uncapped
C4 3 0.107 0.001 0.164 0 0.305 Block Uncapp
ed
100x200mm in eaves cupboard
C5 3 0.011 0.001 0.032 0 0.209 Block Uncapped
C6 2 0.741 0.175 1.306 0.498 0.983
Con-crete
Uncapp ed
20x20mm hole at first floor level with floorboards
C7 3 0.116 0.001 0.303 0 0.314 Brick Capped at joists
C8 3 0.067 0.001 0.187 0 0.265 Block Uncapped
C9 2 0.137 0.055 0.219 0 0.380 Brick Capped
at joists
200x200mm hole in loft
C10 2 0.301 0.149 0.453 0.059 0.544 Brick Capped at joists
C11 3 0.220 0.088 0.479 0.022 0.418 Brick Capped at joists
C12 3 0.012 0.001 0.024 0 0.210 Brick Uncapped
C13 1 0.611 0.611 0.611 0.268 0.954 Undis
cer-nible
Capped at joists
C14 2 0.027 0.005 0.049 0 0.269 Brick Capped at joists
C15 3 0.237 0.152 0.319 0.039 0.435 Brick Uncapped
C16 3 0.028 0.003 0.045 0 0.226
Tim-ber
Uncapped
C17 3 0.277 0.075 0.578 0.079 0.475 Block Uncapped
C18 2 0.113 0.065 0.160 0 0.355 Block Uncapped
C19 3 0.059 0.001 0.116 0 0.257 Mixe
d
Uncapped
C20 3 0.286 0.124 0.483 0.088 0.483 Block Uncapped
C21 3 0.065 0.001 0.146 0 0.263 Block Uncapped
C22 2 0.398 0.001 0.795 0.155 0.640 Block Uncapped
C23 3 0.154 0.020 0.239 0 0.351 Brick Uncapped
C24 3 0.049 0.019 0.093 0 0.247 Brick Capped at joists
C25 9 0.227 0.007 0.412 0.113 0.341 Brick Capped at joists
C26 10 0.243 0.001 0.927 0.063 0.424 Brick Capped at joists
C27 5 0.203 0.022 0.541 0.029 0.378 Brick Capped at ridge
H28 5 0.238 0.024 0.502 0.085 0.391 Block Unable