Citation:
Hanley, B and Bissas, A and Drake, A (2015) The contribution of the flight phase in elite race walking. Proceedings of the 33rd International Conference on Biomechanics in Sport, 33.
Link to Leeds Beckett Repository record: http://eprints.leedsbeckett.ac.uk/1534/
Document Version: Article
The aim of the Leeds Beckett Repository is to provide open access to our research, as required by funder policies and permitted by publishers and copyright law.
The Leeds Beckett repository holds a wide range of publications, each of which has been checked for copyright and the relevant embargo period has been applied by the Research Services team.
We operate on a standard take-down policy. If you are the author or publisher of an output and you would like it removed from the repository, please contact us and we will investigate on a case-by-case basis.
THE CONTRIBUTION OF THE FLIGHT PHASE IN ELITE RACE WALKING
Brian Hanley
1, Athanassios Bissas
1and Andrew Drake
2Carnegie Research Institute, Leeds Beckett University, Leeds, UK
1National Centre for Race Walking, Leeds Beckett University, Leeds, UK
2Although race walkers are not permitted a visible flight phase, previous research has found that most competitors do experience very brief losses of contact. The purpose of this study was to assess the role of the flight phase in elite race walking. Seventeen international athletes race walked over two force plates recording at 1000 Hz. Video data were simultaneously recorded at 100 Hz and used to calculate kinematic variables such as step length. The mean flight time was 0.030 s (± .011) while the mean distance travelled during this phase was 0.12 m (± .05). It was calculated that without flight times, athletes would have slower mean velocities, particularly if mean cadence remained the same. However, the contribution of flight phases in race walking does not just allow for greater step lengths and faster speeds, but also more time for lower limb repositioning. KEY WORDS: athletics, elite sportspeople, gait, kinematics.
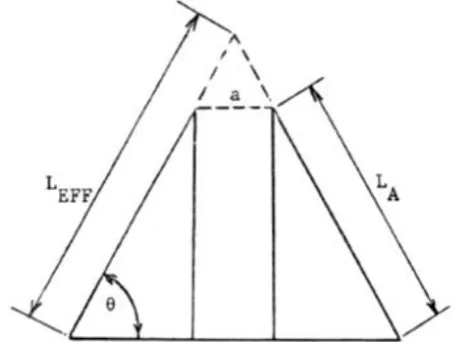
INTRODUCTION: According to IAAF Rule 230.1, “Race walking is a progression of steps so taken that the walker makes contact with the ground, so that no visible (to the human eye) loss of contact occurs. The advancing leg must be straightened (i.e. not bent at the knee) from the moment of first contact with the ground until the vertical upright position”. A flight phase is one feature that distinguishes running from normal walking, and IAAF Rule 230.1 is an attempt to maintain this conceptual difference. However, previous research on race walking in competition and during laboratory testing has found that brief flight phases are common to practically all elite race walkers (Hanley & Bissas, 2013; Hanley, Bissas & Drake, 2011, 2013). Previous mathematical models have been used to predict maximum race walking speed in the absence of a flight phase. For example, in Figure 1, LA represents the
actual length of a race walker’s leg; while LEFF is the increased, ‘effective’ leg length
achieved with pelvic rotation (‘a’ represents the resulting distance between the hip joints caused by this pelvic rotation). Step length can thus be calculated as [2 x (LA x cosθ) + a]
(Trowbridge, 1981). In the diagram, θ represents the angle between the leg and the ground and is assumed to be the same for both legs at double support (and LA is assumed to be the
[image:2.595.182.412.570.741.2]same for both the front and rear legs). While Trowbridge’s model has been used as evidence that race walkers cannot possibly achieve their competitive speeds without loss of contact, its weaknesses include an assumption that the push-off leg is straight (which is what allows θ to be equal for both legs), even though race walkers need to maintain a straightened knee until midstance only, and that it was not based on actual race walking measurements.
While there is no prescribed limit of what constitutes loss of contact except as a subjective ‘visible’ occurrence, reporting typical flight times of elite athletes and those tested in laboratory studies is invaluable to the coach (and judge) who is interested in appreciating what actual flight durations occur, and to the researcher of race walking who is keen to ensure external validity. The aim of this study was to measure and evaluate the role of the flight phase in male and female elite race walkers.
METHODS: The study was approved by the Faculty Research Ethics Committee and 17 race walkers gave written informed consent. The athletes comprised 10 men (26 ± 3 yrs, 1.79 ± .05 m, 67.1 ± 7.9 kg) and seven women (26 ± 5 yrs, 1.66 ± .05 m, 55.8 ± 4.8 kg). All athletes had competed at the Olympic Games or World Championships. All 10 men had previously competed over 20 km (personal best time: 1:23:29 ± 1:59) with eight also competing over 50 km (3:52:59 ± 6:23). The mean personal best time for the women over their competitive distance of 20 km was 1:30:55 (± 1:47). Each athlete race walked along a 45 m indoor running track at a speed equivalent to their season’s best time (20 km or 50 km for men dependent on specialism). Timing gates were placed 4 m apart around two force plates (Kistler, Winterthur) that recorded both left and right foot contact phases and flight time. Athletes completed at least ten trials and the three closest to the target time were analysed (provided they were within 3% of the target time). The force plates recorded at 1000 Hz and were placed in a customised housing in the centre of the track. Contact time was considered to begin when the vertical force trace exceeded 5 N and to end when it decreased below 5 N again; flight time was calculated as the time between steps.
Video data were collected at 100 Hz using a high-speed camera (Fastec, San Diego, CA). The shutter speed was 1/500 s, the f-stop was 2.0, and there was no gain. The camera was placed approximately 12 m from and perpendicular to the line of walking. The resolution of the camera was 1280 x 1024 pixels. The force plate software and the camera system were synchronised using a Kistler connection box (Kistler, Winterthur). The GRF data were smoothed using a recursive second-order, low-pass Butterworth filter at 50 Hz.
The video files were manually digitised by a single experienced operator to obtain kinematic data (SIMI Motion, Munich). Digitising was started at least 10 frames before the beginning of the stride and completed at least 10 frames after to provide padding during filtering. The magnification tool in SIMI Motion was set at 400% to aid identification of body landmarks. De Leva’s (1996) body segment parameter models were used to obtain data for the whole body centre of mass and all body segments. Noise was removed using a Butterworth low-pass filter, with the cut-off frequencies calculated using residual analysis (Winter, 2005).
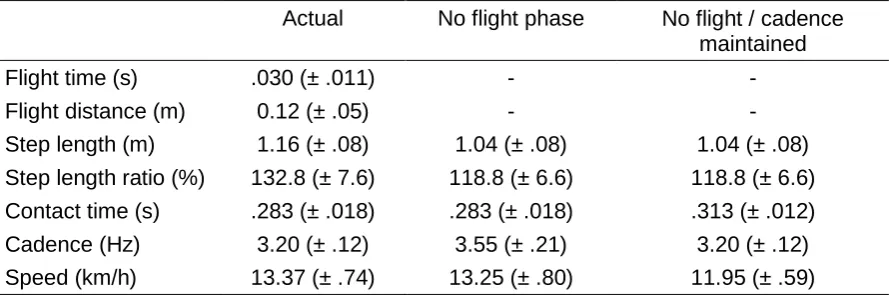
RESULTS: The main spatiotemporal results are shown in Table 1 (‘Actual’) along with hypothetical values based first on the absence of flight time (but with no change in contact time: ‘No flight phase’), and second with an absence of flight time (but with a contact time that absorbs the original duration of flight: ‘No flight / cadence maintained’).
Table 1 Actual and hypothetical spatiotemporal variables of race walking (mean ± SD)
Actual No flight phase No flight / cadence maintained
Flight time (s) .030 (± .011) - -
Flight distance (m) 0.12 (± .05) - -
Step length (m) 1.16 (± .08) 1.04 (± .08) 1.04 (± .08)
Step length ratio (%) 132.8 (± 7.6) 118.8 (± 6.6) 118.8 (± 6.6)
Contact time (s) .283 (± .018) .283 (± .018) .313 (± .012)
Cadence (Hz) 3.20 (± .12) 3.55 (± .21) 3.20 (± .12)
Speed (km/h) 13.37 (± .74) 13.25 (± .80) 11.95 (± .59)
In actual terms, flight distance contributed approximately 10% of total step length. Speed was correlated with step length ratio (r = .73, p = .001), flight time (r = .52, p = .031) and flight distance (r = .66, p = .004). Step length ratio was correlated with flight distance (r = .52,
p = .034). Cadence was negatively correlated with contact time (r = –.81, p < .001), while flight distance was positively correlated with flight time (r = .85, p < .001).The mean hip angle at initial contact was 170° (± 2) while at toe-off it was 185° (± 3). The mean knee angle at initial contact was 180° (± 2) while it was 149° (± 5) at toe-off. The mean ankle angles at initial contact and toe-off were 90° (± 4) and 127° (± 6) respectively.
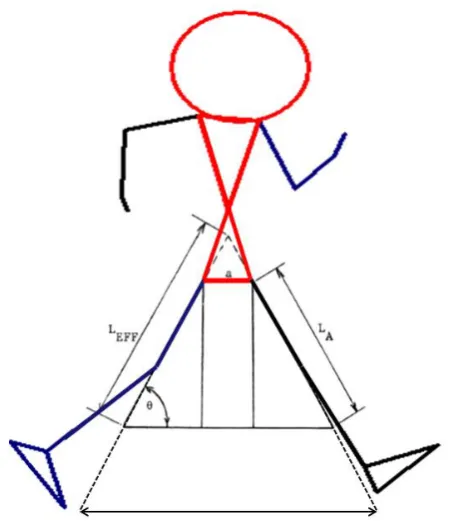
Figure 2: Trowbridge’s model of step length with a digitised figure of an elite race walker superimposed. The dashed lines are extrapolations of the original LEFF and LA lines because the diagram has been rescaled to match the distance between the digitised hip joints (‘a’).
From a coaching viewpoint, flight time was an important contributor to step length by way of flight distance, and there might be a temptation for athletes to deliberately increase it. However, the risk of having too long a flight phase is clear and it is not sensible to explicitly advise race walkers to increase its length in an attempt to improve performance. On the contrary, it is preferable for them to develop their techniques in such a way that high speeds are maintained with as little flight as possible. One way in which this might be achieved is through increasing step length via the knee flexion movement that occurs in late stance.
CONCLUSION: The aim of this study was to measure and evaluate the role of the flight phase in elite race walkers. Overall, it was clear that these elite race walkers relied on relatively long flight times for a large component of step length, and without these flight periods the athletes would have been considerably slower. In effect it is not possible for elite race walkers to obtain the speeds required for world-class competition without some duration of flight. It is possible that these flight phases, which if long enough to be visible can lead to disqualification, would be even longer without the knee flexion that occurs during late stance.
REFERENCES:
de Leva, P. (1996). Adjustments to Zatsiorsky-Seluyanov’s segment inertia parameters.
Journal of Biomechanics, 29, 1223-1230.
Hanley, B., Bissas, A. & Drake, A. (2011). Kinematic characteristics of elite men’s and women’s 20 km race walking and their variation during the race. Sports Biomechanics, 10, 110-124.
Hanley, B., Bissas, A. & Drake, A. (2013). Kinematic characteristics of elite men’s 50 km race walking. European Journal of Sport Science, 13, 272-279.
Hanley, B. & Bissas, A. (2013). Analysis of lower limb internal kinetics and electromyography in elite race walking. Journal of Sports Sciences, 31, 1222-1232.
[image:5.595.184.409.70.331.2]