PERFORMANCE MANAGEMENT SYSTEM IN OPTCL: AN
IMPERICAL STUDY
Sonam Subhadarshini
Asst. Prof. Department of Business Administration, Trident Academy of Creative Technology, Bhubaneswar, India.
ABSTRACT
Organization today is continuously facing external and internal forces that drive them to change
to be competitive in the world market. Rapid changes in technology, information system and stiff
competition due to new arrivals are the challenges for organization to be fought for survival and
growth. Employee performance significant for the development and increase in organisation’s
productivity, employee performance is determined by the goals employee set to achieve and it
can also be attributed to internal factors in the organization that can improve performance. This
paper shows the roadmap for effective implementation of Performance Management System by
the help of other HR activities. In other words the paper will aim to develop and implement the
PMS within the Public sector Organization like OPTCL, based on private sector experience.
Key Words: Performance Management System, Performance Appraisal, Top level managers,
objectives of PMS, Implementation of PMS.
1.1 Introduction
Challenges of knowledge economy have catalyzed the search for relatively sustainable
sources of competitive advantage. As a result, organizational leaders and strategist are ascribing
greater importance to the role of human capital in driving business success.
In order to be competent and to cope with changes organizations have started being organized
and merged in to chain, clusters, network and strategic alliances. Human Resources with International Research Journal of Human Resources and Social Sciences
Vol. 3, Issue 12, December 2016 Impact Factor- 5.414
ISSN(O): (2349-4085) ISSN(P): (2394-4218)
knowledge and competencies are the key assets in assisting organization to sustain their
competitive advantage. Moreover, organization‟s increasing concern for HR function
contribution and accountability has been significant over the recent years. In that situation,
Performance Management System (PMS) is one of the key issues that could help the
organization to prepare its HR to cope up with the current business strategies. There is an urgent
need to have new management approach to manage the performance of HR more systematically
in the organization as the traditional ways have lost their applicability.
The word PM can be split up as performance and management. It is fairly in precise term
and PM manifests itself in many different terms. “Performance is a method or a trend in which
the entity under consideration perform a certain activity on the basis of similarity with the
reference method of the normal execution of activity” (Wagner 2009) . Performance can be
defined as the past, present, future accomplishment of a given original task or dimension
measured against pre-set known standard of accuracy, completeness, value or time. Employee
performance is significant for the development and increase in organizational productivity,
employee performance is determined by the goals employees set to achieve and it can also be
attributed to internal factors in the organization that can improve performance. Armstrong and
Baron define PM as a process which contributes to the effective management of individuals and
teams in order to achieve high level of organizational performance. As such, it establishes shared
understanding about what is to be achieved and an approach towards leading and developing
people which will ensure that it is achieved. In such context, PM is being considered as a critical
HR sub-system which may substantially contribute to organizational growth and effectiveness
(Nan Kervis and Compton, 2006). The PMS must be able to produce specific, timely and
relevant control purpose. Performance Management reminds us that being busy is not the same
as producing results. It reminds us that training, strong commitment and lots of hard work alone
is not the result. The major contribution of performance management is its focus on achieving
results-useful product and services for customer inside and outside the organization. Performance
Management redirects our efforts away from business towards effectiveness.
Performance Management from utility point of view is the umbrella term for all of the
organizational activities involved in managing people on the job. It has been seen as a complex
human resource management system in which manager work with their employees to set
Performance Management has two fold approach where organization needs to evaluate the
performance of managers in achieving strategic goals and then goes for evaluating how
employee through guidance from management that ultimately help in achieving both
organizational and individual needs. Effective performance management is widely recognized as
a management tool to specially evaluate and improve individual performance. Either at the
individual or team level performance management is a process of maximize employee skill and
ability in order to improve on employee performances and increase in organizational
productivity, achieve better results by understanding and managing performances within an
agreed frameworks of planned goals and the organization‟s objectives.
1.2 Background
ORISSA POWER TRANSMISSION CORPORATION LIMITED (OPTCL), one of the largest
Transmission Utility in the country was incorporated in March 2004 under the Companies Act,
1956 as a company wholly owned by the Government of Orissa to undertake the business of
transmission and wheeling of electricity in the State. The registered office of the Company is
situated at Bhubaneswar, the capital of the State of Orissa. Its projects and field units are spread
all over the State. OPTCL became fully operational with effect from 9th June 2005 consequent
upon issue of Orissa Electricity Reform (Transfer of Transmission and Related Activities)
Scheme, 2005 under the provisions of Electricity Act, 2003 and the Orissa Reforms Act, 1995 by
the State Government for transfer and vesting of transmission related activities of GRIDCO with
OPTCL. The Company has been designated as the State Transmission Utility in terms of Section
39 of the Electricity Act, 2003.
Presently the Company is carrying on intra state transmission and wheeling of electricity under a
license issued by the Orissa Electricity Regulatory Commission. The Company is also
discharging the functions of State Load Dispatch Centre. The Company owns Extra High
Voltage Transmission system and operates about 9550.93 ckt kms of transmission lines at 400
kV, 220 kV, 132 kV levels and 81 nos. of substations with transformation capacity of MVA.
The day-to-day affairs of the Company are managed by the Managing Director assisted by
whole-time Functional Directors as per the advice of the Board of Directors constituted. They are
1.3Objectives of the study:
To have an idea about the awareness of employees towards the objectives of PMS.
To measure the opinion of top level managers towards implementation of PMS in
OPTCL
Suggest the modification and implementation of PMS in the organization.
1.4 Methodology:
A research questionnaire consisting of demographic profile of the respondents and different
subject related statements are given to the employee having more of five-point scale along with
ranking statements and yes/no options. For analyzing the data, the descriptive statistics, such as
mean, standard deviation, and frequency study has been used. For testing the hypothesis and
drawing inferences, the statistical tool like ANOVA. The above analysis has been done using
20.0 version of SPSS package.
1.5 Literature Review
Lebas (1995), choose to say that performance especially in the case of management is not
so much about past achievement, as generally accepted, but about the future, about the capability
of the unit being evaluated. He further highlighted that performance can be anything from
efficiency to robustness or resistance or return on investment, or plenty of other definitions never
fully specified.Manuel Mendonca and R.N. Kanungo (1990), Performance Management refers to
the process of setting and communicating performance targets defining evaluative criteria to be
employed at different levels of performance, monitoring performance, reviewing performance,
providing feedback and taking corrective measures to remove performance snags.
Daniels and Rosen (1984)have defined Performance Management as a data guided approach
to managing work behaviour. But most of the organisations do not have a proper performance
management system; instead, they have an age-old performance appraisal system, and that too is
in Shambles.Beer and Ruh (1976), in his article highlighted that the concept of Performance
Management gradually evolved and gained increased attention of both practitioners and
researchers, with both performance appraisal and consequently training and development
emphasized a two way communication during the process, thereby alleviating many of the
problems inherent in the traditional performance appraisal arrangements.A more detail definition
of Performance Management should contribute was defined by Jones et al (1995). They argue
that it should: i) communicate a shared vision throughout the organisation to help to establish
and support appropriate leadership and management styles. ii) Define individual requirements
and expectations of all employees in terms of the inputs and outputs expected from them, thus
reducing confusion and ambiguity. iii) Provide a framework and environment for teams to
develop and succeed. iv) Provide the climate and systems that support reward and communicate
how people and the organisation can achieve improved performance. v) Achieve improved
performance.vi) Help people manage ambiguity. Marchington and Wilkinson (1996) state,
Performance Management requires ongoing and unsolicited support in order to be effective; that
is, the telephone call or the “chance” conversation just to check that all is going well, which
many busy managers tend to overlook in their efforts to satisfy formal organisational
requirements.Striteska (2012) cited in his article that performance management is an instrument
for achieving better result in the organization, teams as well as individuals thereby the
performance is understood and managed within the agreed and planned goals, standard and
competencies.American Compensation Association (1996): To reduce the subjectivity of
performance management systems and increase the focus on continuous improvement,
organisations have tended to move away from rating categories or levels toward summary
statements that are behaviour oriented and more focused on future improvements.Bitici et al
(1997), identified performance management could be characterized as a process by which they
organize integrates its performance with its corporate and functional strategies and objectives.
Armstrong and Murlis (1994) comment that: Some organisation separate entirely
performance pays ratings from the performance management review. But there will, of course,
inevitably be a read-across from the performance management review to the
pay-for-performance review. The issue is that if you want to pay for pay-for-performance or competence you
have to measure performance or competence. And if you want, as you should do, the process of
measurement to be fair, equitable, consistent and transparent, then you cannot make pay
decisions, on whatever evidence, behind closed doors. You must convey to individuals or team
1.6 Analysis:
In OPTCL, PMS is not a predefined function as implementation. Therefore maximum employees
are not aware about what PMS is? Basically PM is a collected and combined activities of
different HR functions like performance planning, performance appraisal, training & duet reward
system, promotion, career planning etc. If we focus to the HR activities of OPTCL, all the above
HR activities are properly implemented and worked in their own objectives which may help in
implementing the PM in the organization. Though in OPTCL, they don‟t have any formal
PMS, but the support activities are properly working in the entire organization. The respondents
are from the different power units of Odisha by keeping majority from head office
(Bhubaneswar).
1.6.1 Age & Experience of the Employees
Table no-1.1: Cross tabulation of age & experience of the employees
Experiences of the Respondent
Below 5 years
5-10 years
10 years and
above Total
Age
of the
R
espond
ent
25-35 yrs Frequency 24 0 4 28
% within Age of
the Respondent 85.7% .0% 14.3% 100.0%
36-45 yrs Frequency 4 4 18 26
% within Age of
the Respondent 15.4% 15.4% 69.2% 100.0%
Above 46 yrs Frequency 0 0 66 66
% within Age of
the Respondent .0% .0% 100.0% 100.0%
Total Frequency 28 4 88 120
% within Age of
the Respondent 23.3% 3.3% 73.3% 100.0%
Source: Primary Survey
Experience of an employee in an organization is a factor to be reckoned with. The level of
commitment to the organization is linked with experience. This factor counts much so far
promotion ,pay, remuneration & training, participation in decision making, recognition at work
has been seen that 73.3percent of the respondents are showing an experience more than 10
years.23.3percent of the respondent are showing an experience of below 5 years where as 3.3
percent are showing an experience of 5-10 years. The cross tabulation result shows that all the
above 46yrs of employees have more than 10yrs of experience which can be a positive sign for
implementation of PMS as the decision making process lies with seniors level of management.
[image:7.612.76.496.181.303.2]1.6.2 Chi-Square Tests
Table-1.2:Chi-Square Tests across age and experience
Value df Asymp. Sig.
(2-sided)
Pearson Chi-Square 97.034a 4 .000
Likelihood Ratio 97.139 4 .000
Linear-by-Linear Association 75.781 1 .000
No. of Valid Cases 120
Source - Primary survey
For the sake of establishing a relationship between experience and age the researcher has tested
the data set through chi-square test. It has been observed from the above table that there exists a
high degree of association between age and experience showing the Pearson Chi-Square value as
97.03.
1.6.3 Employees’ Awareness towards objectives of Performance Management
System
This part of the analysis lies with the respondent awareness about the theoretical perspective of
Performance Management System. In this section the respondents were asked questions about the
objective aspect of PMS which will make the path for implementing the function in the organization.
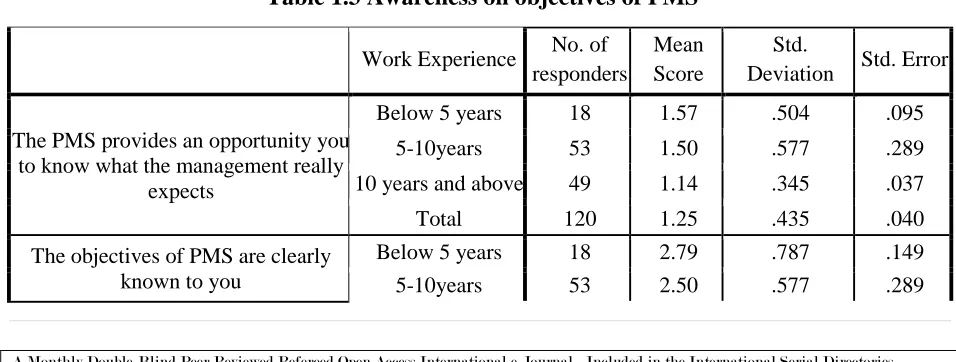
Table 1.3 Awareness on objectives of PMS
Work Experience No. of responders
Mean Score
Std.
Deviation Std. Error
The PMS provides an opportunity you to know what the management really
expects
Below 5 years 18 1.57 .504 .095
5-10years 53 1.50 .577 .289
10 years and above 49 1.14 .345 .037
Total 120 1.25 .435 .040
The objectives of PMS are clearly known to you
Below 5 years 18 2.79 .787 .149
[image:7.612.66.544.541.722.2]10 years and above 49 2.11 1.159 .124
Total 120 2.28 1.101 .101
Appraisal is done based on KPA
Below 5 years 18 3.29 1.049 .198
5-10years 53 3.50 .577 .289
10 years and above 49 2.14 1.584 .169
Total 120 2.45 1.539 .140
KAP can better preparation the PMS
Below 5 years 18 1.64 .488 .092
5-10years 53 1.50 .577 .289
10 years and above 49 1.11 .319 .034
Total 120 1.25 .435 .040
KAP can identify the gap between expectations and quantum which may help PMS for better analysis
Below 5 years 18 1.86 .756 .143
5-10years 53 1.50 .577 .289
10 years and above 49 1.14 .345 .037
Total 120 1.32 .565 .052
PMS is providing information needed to program a job
Below 5 years 18 2.43 .634 .120
5-10years 53 2.00 .000 .000
10 years and above 49 1.16 .368 .039
Total 120 1.48 .698 .064
PMS is involved in focusing an development and fostering
communication
Below 5 years 28 2.21 .787 .149
5-10years 4 1.50 .577 .289
10 years and above 88 1.27 .541 .058
Total 120 1.50 .722 .066
Do you think PMS help each employee understand more and
become clear about their job function?
Below 5 years 18 1.21 .418 .079
5-10years 53 1.50 .577 .289
10 years and above 49 1.02 .262 .028
Total 120 1.08 .333 .030
Source: Primary survey
1.6.4 Lorenz Curve
Table1.4:Lorenz Curve Experience in years Mid value (experience) Cumulative mid value % (experience) No. of Respondents Cumulative value % of Respondents Below 5
years 4 4 16.67 18 28 15
5-10 years 8 12 50 53 32 59.17
10 years &
Above 12 24 100 49 120 100
Fig 1.1 Lorenz Curve
Source: Primary data
The Table 1.3 contains some of the variables those are considered vital as the objectives
of Performance Management System (PMS). The researcher aims at knowing the perception of
employees on objectives of Performance Management System (PMS) at OPTCL. Before
administrating the questionnaire the researcher divided the entire group of employees into three
categories basing on their experience. Through the process the researcher collected the responds
and analyzed it to verify whether there exists any difference among the employees or they all
agree to the questions there in. The collected data has been described with the help of some
statistical tools like Mean, Standard deviation and Standard error. For each variable, the
researcher has calculated three set of values of Mean score, Standard deviation and standard
error. From the table, it has been observed that the mean score of “Appraisal is done based on KPA” is more and “The PMS provides an opportunity to you to know what the management really expects” stands lowest. However, to know the difference of perception from the line of best
fit, Lorenz curve has been applied and the deviation is shown as the gap in the figure 1.1 in the
above context.
For further clarification of above table, ANOVA test was applied to test statistical significance of
different objectives considered so far as experience is concerned for Performance Management
1.6.5 Employees’ Awareness towards objectives of Performance
Management System
Table 1.5 ANOVA Test
Items Work Experience Degrees of Freedom Sum of Squares Mean Square F-Value
The PMS provides an opportunity you to know what the management really expects.
Between Groups 2 .9285 .464 2.967
Within Groups 117 18.221 .156
Total 119 19.1495
The objectives of PMS are clearly known to you
Between Groups Within Groups Total 2 117 119 2.886 134.578 137.464 1.443 1.150 1.255
Appraisal is done based on KPA Between Groups Within Groups Total 2 117 119 7.076 249.078 256.154 3.538 2.129 1.662
KAP can better preparation the PMS Between Groups Within Groups Total 2 117 119 .159 16.292 16.451 .318 .139 2.290
KAP can identify the gap between expectations and quantum which may help PMS for better analysis
Between Groups Within Groups Total 2 117 119 1.098 26.792 27.890 .549 .229 2.399
PMS is providing information needed to program a job
Between Groups Within Groups Total 2 117 119 .520 22.630 23.150 .260 .193 1.384
PMS is involved in focusing an development and fostering communication Between Groups Within Groups Total 2 117 119 1.859 43.169 44.928 .929 .369 2.519
Do you think PMS help each employee understand more and become clear about their job function?
Between Groups Within Groups Total 2 117 119 .3018 11.669 11.9708 .1509 .100 1.509
Source: Primary data
The above ANOVA table 1.5 describes the variability in perceptions of employees regarding
different objectives of Performance management services. The table speaks the F value for all the
items are less than the tabulated value 3.07 at df (2,120) suggesting that there is no significant
relationship between the employee‟s opinion towards different objectives of PMS at different
difference in opinion for the above statement exists so far as experience of employees are
concerned.
1.6.6 View of Managers towards Application of Performance Management System in OPTCL.
[image:11.612.73.540.229.655.2]This section represents the decision makers of the organization. They are the top level managers who are directly or indirectly associated in the decision making process. In this segment, size of the sample is 40. The objectives of this section is to identify the view of managers towards application of performance related issues which may shows the direction for implementing it to the organization.
Table 1.6: Top Level Managers and Implementation of PMS in OPTCL
Items Work Experience of
Top level Managers N Mean
Std. Deviation
Std. Error What are the stages of
PM during which you communicate with your employee
2-5 years 14 4.00 .000 .000
5-10 years 4 3.50 .577 .289
10 years and above 22 3.43 .498 .053
Total 40 3.57 .498 .045
What do you do when you identify poor performance in your review session
2-5 years 14 2.00 1.018 .192
5-10 years 4 1.50 .577 .289
10 years and above 22 2.14 .996 .106
Total 40 2.08 .992 .091
Give your opinion an employee self appraisal
2-5 years 14 2.14 .356 .067
5-10 years 4 1.50 .577 .289
10 years and above 22 1.82 .838 .089
Total 40 1.88 .758 .069
In which of the
following situation you find yourself
uncomfortable
2-5 years 14 3.36 .621 .117
5-10 years 4 3.50 1.732 .866
10 years and above 22 2.84 .676 .072
Total 40 2.98 .745 .068
What according to you would calculate psychological barriers to effective PA
2-5 years 14 2.29 .460 .087
5-10 years 4 2.00 1.155 .577
10 years and above 22 2.32 .704 .075
Total 40 2.30 .669 .061
What strategies of your organization have been linked to the PMS to make it more efficient
2-5 years 14 2.18 1.307 .247
5-10 years 4 3.25 .500 .250
10 years and above 22 2.09 .990 .106
Total 40 2.15 1.074 .098
1.6.7 ANOVA test for difference in Work Experience of Top level managers and opinion toward PMS
Table 1.6 ANOVA test
Items Work Experience of Top level managers
Sum of Squares df
Mean Square F
What are the stages of PM during which you communicate with your employee
Between Groups 1.089 2 .545 2.379
Within Groups 26.589 37 .229
Total 27.678 39
What do you do when you identify poor performance in your review session
Between Groups 1.803 2 .902 .914
Within Groups 115.364 37 .986
Total 117.167 39
Give your opinion an employee self appraisal
Between Groups 2.847 2 1.424 2.542
Within Groups 65.519 37 .560
Total 68.367 39
In which of the following situation you find yourself uncomfortable
Between Groups 2.717 2 1.358 2.685
Within Groups 59.201 37 .506
Total 61.919 39
What according to you would calculate psychological barriers to effective PA
Between Groups .395 2 .197 .437
Within Groups 52.805 37 .451
Total 53.200 39
What strategies of your organization have been linked to the PMS to make it more efficient
Between Groups 5.170 2 2.585 2.289
Within Groups 132.130 37 1.129
Total 137.300 39
ANOVA table describe the variability in perception of managers regarding different aspects of
Performance Management System. To evaluate “What are the stages of PM during which you
communicate with your employee” the researcher estimated the F value which comes to 2.379
which is less than the tabulated value 3.07 at df (2, 39) showing a non-significant relationship
among the managers having different years of experience .Hence there does not exist a difference
of opinion regarding “What are the stages of PM during which you communicate with your employee.
To know the perception of managers whenever they find the situation like “What do you
do when you identify poor performance in your review session ” the researcher estimated the F value
which comes to .914 which is less than the tabulated value 3.07 at df (2,39) showing a
non-significant relationship among the managers having different years of experience .Hence there
does not exist a difference of opinion regarding “What do you do when you identify poor
performance in your review session,”
Regarding self appraisal system the managers are also showing a reasonable degree of
unanimity among themselves which has been validated by the fact that the estimated the F value
which comes to 2.542 which is less than the tabulated value 3.07 at df (2,39) showing a
non-significant relationship among the managers having different years of experience.
To understand the perception of managers regarding the situation like “In which of the
following situation you find yourself uncomfortable” the researcher estimated the F value which
comes to 2.685 which is less than the tabulated value 3.07 at df (2, 39) showing a non-significant
relationship among the managers having different years of experience .Hence there does not exist
a difference of opinion regarding “In which of the following situation you find yourself
uncomfortable”
When it has been asked to know the views of managers regarding “What according to you
would calculate psychological barriers to effective PA” all of them were of the same view which can
be best evaluated through quantitative way where the researcher estimated the F value which
comes to .437 which is less than the tabulated value 3.07 at df (2,39) showing a non-significant
relationship among the managers having different years of experience .Hence there does not
exist a difference of opinion regarding “What according to you would calculate psychological barriers
to effective PA ”
When it has been asked to evaluate the views of managers regarding “What strategies of
following conclusion where the estimated F value comes to 2.289 which is less than the
tabulated value 3.07 at df (2,39) showing a non-significant relationship among the managers
having different years of experience .Hence there does not exist a difference of opinion
regarding “What strategies of your organization have been linked to the PMS to make it more efficient ”
1.7 Findings
Drawing together the findings and discussion it could be found that in OPTCL there is no such
formal PMS implemented but the senior and the middle manager‟s knowledge regarding the
implementation of PMS and the characteristics that PMS should meet according to their opinion
in future. According to the most executives of HRD department of OPTCL, a formal performance
management is very much necessary for the organizational effectiveness.
The researcher tries to find out the awareness of the employee regarding PMS as it is not
their regular activities. And it found that all the executives have similar opinion relating to the
objectives of PMS. There are no such differences in their opinion.
Coming to the second objective it is found that deals with the top manager‟s view towards
the implementation of the PMS. It shows from the above table that the F value of the above item
comes less than the tabulated value i.e. 3.07 at df (2, 39) showing a non-significant relationship
among the managers having different year of experience. As there is less difference in the
opinion so the PMS can be implemented without any obstacles.
Coming to the third objective, it envisage that through OPTCL doesn‟t have any formal
PMS but the related activities of performance management is a regular function over there with a
different objectives. The company is well acquainted with the HR functions like Performance
Planning, Performance appraisal, Training and Development, Performance Appraisal Review,
Performance based promotion etc. It indicates that the company OPTCL is lacking by only the
name of PMS as a HR function only. It needs some modification to the existing system which
makes the function more accurate for its implementation.
1.8 Conclusion
Improvement and increase in employee performance is determined with the goals employees set
to achieve, employees that set difficult goals will achieve higher performances compared to
employees with easy or without goals. In goal setting and its achievement for increase in
the organization, helps employees to identify motivational drives. Employee performance will
improve when organization provides necessary motivation that will influence employees to work
towards the motivational drive. For improvement of employee performance we require a proper
Performance Planning, Appraising, Reviewing and Rewarding the employee which taken
together makes PMS.
The conducted research study confirms that as there is no significant difference between
the opinion of top managers and the executives, PMS can be implemented for its employee. It
will not be a hindrance for employee‟s output and organizational goal.
References:
1) Wagner J. (2009). Měření výkonnosti: Jak měřit, vyhodnocovat a využívat informace o
podnikové výkonnosti. Prague: Grada Publishing, a. s. Měření výkonnosti jako proces, pp. 36-39. ISBN 978-80-247-2924-4.
2) Nankervis, A. R. and Compton, R.-L. (2006), Performance management: Theory in
practice?. Asia Pacific Journal of Human Resources, 44: 83–101. doi:10.1177/1038411106061509
3) Lebas, Michel. J, (1995), “Performance Measurement & Performance Management”, International Journal of Production Economics, Vol-41, pg 23-25.
4) Adebayo. Martins, Kehinde. Tabiti (2015), “An Empirical study of Performance Management as a managerial tool for the development and improvement in employees job performance in organisation”, Australian Journal of Business and Management research, Vol-4, N0-12, pg-1-17, ISSN-1839-0846.
5) Bates, A.R & Holton, F.E (1995), „Computerized Performance Monitoring‟, HRM review, Vol 6, No-2.
6) Bernadian, H.K.,Kane J.S.Soss. S,Spina.(1995)‟Performance appraisal design,development and implementation‟,in G.R. Ferris, S.D.Rosen and
D.J.Barnum(eds), Handbook of Human Resource
Management.Cambridge,Mass.,Blackwell.
7) Brumbach, G.B. (1998); Some Ideas, Issues and Predictions about Performance Management, Public Personnel Management, Winter: 387-402.
8) Batch, D. and K. Sisson (2000), Personnel Management: A Comprehensive Guide to Theory and Practice, Blackwell, Oxford.
9) Jones T.W. (1995) „Performance management in changing context‟.Human Resource Mnagement.Fall.pp425-442.
10) Marchington M. and Wilkinson A.(1996) Core Personnel and Development.London,Institute of Personnel and Development.
11) Striteska, Michaeta., (2012), “Key features of Strategic PMS in manufacturing companies”, Procedia-Social & Behavioral Sciences, Vol 58, pg 1103-1110.
12) American Compensation Association, see Englemann and Rosech 1996.
14) Guin K.A. (1992) “Successfully Integrating Total Quality and Performance Appraisal”. New York, Springs, Faulkner and Gray.
15) OPTCL Newsletter 16) OPTCL Broucher
17) Orissa Power Sector at a Glance 2009, OERC Souvenir.
18) www.optcl.co.in
19) OPTCL Company manual. 20) OPTCL Annual Report 2014-15.
21) http://www.optcl.co.in/View/writereaddata/Downloads/vision2009.pdf
22) http://indianpowersector.com/home/tag/odisha/