© Associated Asia Research Foundation (AARF)
A Monthly Double-Blind Peer Reviewed Refereed Open Access International e-Journal - Included in the International Serial Directories.
Page | 12
DESIGN AND DEVELOPMENT OF SELF LEARNING GUIDE FOR
TECHNICAL PUBLICATION DEPARTMENT USING AHP APPROACH
V. S. Harshith Babu
Assistant Professor, Department of Management Studies,
Dayananda Sagar College of Arts, Science and Commerce, Bengaluru, India.
Dr. J. Vijayakumar
Associate Professor, Department of Management Studies,
Dayananda Sagar College of Arts, Science and Commerce, Bengaluru, India.
ABSTRACT
A Self-learning guide is a standard document used by reputed companies for documenting the work process that is accountable and provides information at any point of time. Thus, a self-learning guide acts as a measure which demonstrates management’s accountability and records
the professional practices of a company. This paper attempts to prioritize those factors that can be made use to develop a self-learning guide from the factors that is taken in a general perspective of documentation procedure through literature review for technical publication domain. This study uses Analytical Hierarchy Process method to select the most appropriate factors that can be used in developing the self-learning guide. This study uses four criteria such as language, design, content and relationship that enable to develop a self-learning guide. The results reveal that AHP method helped to measure, rank and choose those factors that is required in developing the self-learning guide. The research findings revealed that the content criterion was the most favored criterion followed by relationship, design and language. The most important factor are relevance factor followed by action, alignment, contact, subject and the
© Associated Asia Research Foundation (AARF)
A Monthly Double-Blind Peer Reviewed Refereed Open Access International e-Journal - Included in the International Serial Directories.
Page | 13 least important factor are tone, impression and plain words that can be made use in developing the self-learning guide.
Key Words - Analytical hierarchy process, Self-learning guide, Technical Publication, Technical Writing
INTRODUCTION
In the present scenario the companies make use of self-learning guides to make the employees
accountable for providing information, improving operational efficiency as it provides
background history and acts as a proof to safety plans. The reason for developing a self-learning
guide is to give a clear information on what are the processes that one needs to be doing in the
departments as it creates a new improved approach to look in to problems faced during the work.
A self-learning guide also acts one of the materials that is accountable to provide information at
any given time and it also helps in reducing the time in the routine works and also provides
service improvements. The self-learning guides enable the professionals to use previous, present
as well as the latest information, which facilitates continuous output. Accurate and factual
self-learning guides provide hard and trustworthy records of the work process and acts as an accurate
documentary for the previously done work. A guide demonstrates the Managements
accountability and records their professional practice. Thus self-learning guide should be
developed by prioritizing those criterions that are taken from a general perspective of
documentation procedure.
LITERATURE REVIEW
Technical documents are usually written to complete the report which will be usually asked by
the immediate superior.Anastasi (1971), Blake and Bly (1993) have mentioned in their studies that technical documents completes the job when downsizing happens in the industries where an
individual has to do those work which is not under his domain at this time these technical
documents serves as a guide to the employee.
G. Blake & R.B. Bly (1993) and J.M. Lannon, (1988) focused on the factors relating to the technical content of the guides.Atkinson et al. (2007) and Liberman et al. (2002), says that the writer has to be very careful while writing down the technical documents and to make the right
© Associated Asia Research Foundation (AARF)
A Monthly Double-Blind Peer Reviewed Refereed Open Access International e-Journal - Included in the International Serial Directories.
Page | 14 about the level of conceptual difficulty that the reader is capable of understanding which is to be
appropriate.
R.H. Fiske (1996), J. Gibaldi (1999) have worked tremendously to bring out many factors in developing the technical documents such as technical self-learning guides. Their work is broadly
classified to three sections those are Technical Content, Presentation and language skills. In
technical content the first they talked about was the proper word usage such as the patent
document requires different word usages then the technical report.
Wright (1981), Wright, Crieghton and Threlfall (1982), in their study showed that people refer asking expert than understanding the complicated documents by themselves. Their study
revealed that reader asks help to understand the content which leads us to the fact that a clear
contact detail should be established while communicating information in the technical
documents.
Harker and Vargas (1987) defined analytical hierarchical process as a framework, “which is designed to deal with the intuitive, the rational and the irrational when we make multiple
objectives, criterions and decisions with or without certainty for any quantities of alternatives”.
Eddie Cheng and Heng Li, (2001) says in their study that the selection of process carried out by AHP procedure is very transparent. It brings out the relative advantages of alternative solutions
in a Multi Criteria Decision Making (MCDM) problem and it is a subjective methodology.
Ruchi Garg Zillur Rahman and Quareshi Ishwar Kumar, (2012) says that a decision-maker of the company can use direct questioning or a questionnaire method to obtain information and
the priority weights of elements. In spite of many approaches, AHP is considered to be the most
effective methodology in prioritization of criterions. AHP is also adept in treating large number
of criteria and sub criteria’s proficiently.
Sakuja S and Jain v (2012) analyzed the collaboration of different service operations of different organizations to satisfy customers. The basic model is constructed which consists of
different elements and various decision criteria which can easily fit in the service SC so that
© Associated Asia Research Foundation (AARF)
A Monthly Double-Blind Peer Reviewed Refereed Open Access International e-Journal - Included in the International Serial Directories.
Page | 15
Rabihah Md.Sum and Norlida Mahussin(2016) mentioned that AHP is a useful and practical decision making tool for personal financial planning. It increases transparency of a problem by
structuring criteria and alternatives of a problem in a hierarchy.
Pankaj Agarwal, Hamant Asati, Dharmendra Gour (2016) in their study stated that AHP approach creates a new interest because of simplicity and ease of its application. It has various
advantages over previously adopted approaches due to the inclusion of weightage of factors and
a combined structure of selection criteria.
OBJECTIVE OF THE STUDY
1. To identify the factors for developing the self-learning guide.
2. To analyse and prioritize the factors for developing the self-learning guide.
3. To rank the best suitable factors among the overall factors to develop the self-learning
guide.
RESEARCH METHODOLOGY
The methodology carried out for this study is through interview method and Analytical
Hierarchy Process. The interview method is used to collect the data and opinion from the
employees. The Analytical Hierarchy Process is used for analyzing and prioritizing the important
factors from the selected factors through various literatures. Analytical Hierarchy Process is
possibly the most dominant and the most widely used approach in prioritization process. AHP
has also proved helpful to convert those immeasurable aspects in to measureable aspects which
will help to draw the results or conclusions.
The factors identified from the literature survey contain the relative studies carried out by other
authors supporting these factors criteria wasestablished to evaluate the factors. The four main
criteria’s got from literature review are Design, Relationship, Language and Content. Language
criteria isabout the ease the reader feels in understanding the words. Design criteria give the
visual feel of the document and its design enhances the usability. Relationship criteria depict
how far a document establishes a relationship with its users. Content criteria reveals about the
content and the way the content is organized to deliver the document’s purpose. The table 1
© Associated Asia Research Foundation (AARF)
A Monthly Double-Blind Peer Reviewed Refereed Open Access International e-Journal - Included in the International Serial Directories.
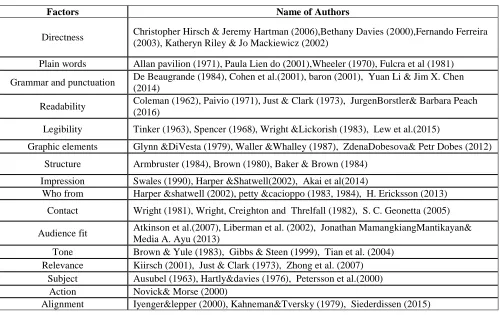
[image:5.612.69.569.86.401.2]Page | 16 Table 1. Factors from the Literature
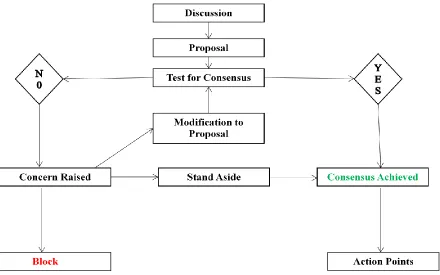
Before conducting AHP analysis the data’s are collected by having the consensus of the team.
These consensuses are collected as an input for the pair wise comparison of the factors. The
method applied to collect these data’s is through consensus decision making method as the group
consist of 9 members it is hard to go for a quantitative approach to collect the data that is through
surveys or questionnaires. Hence the qualitative approach is used to collect the consensus for the
pair wise comparison. The below figure will show in brief the steps used in collecting the
consensus through consensus decision making method.
After the discussion, a meeting was arranged to collect the responses from the employees of the
technical publication team regarding the mentioned factors in terms of their consensus on these
factors. In this meeting, the team members consisting of 9 employee’s consensus are collected.
The employees were asked to rate the factors in pair wise both at level 1 and level 2 by rating the
factors from 1 to 9 in a pair wise comparison manner. The responses were recorded only after the
Factors Name of Authors
Directness Christopher Hirsch & Jeremy Hartman (2006),Bethany Davies (2000),Fernando Ferreira (2003), Katheryn Riley & Jo Mackiewicz (2002)
Plain words Allan pavilion (1971), Paula Lien do (2001),Wheeler (1970), Fulcra et al (1981)
Grammar and punctuation De Beaugrande (1984), Cohen et al.(2001), baron (2001), Yuan Li & Jim X. Chen (2014)
Readability Coleman (1962), Paivio (1971), Just & Clark (1973), JurgenBorstler& Barbara Peach (2016)
Legibility Tinker (1963), Spencer (1968), Wright &Lickorish (1983), Lew et al.(2015)
Graphic elements Glynn &DiVesta (1979), Waller &Whalley (1987), ZdenaDobesova& Petr Dobes (2012)
Structure Armbruster (1984), Brown (1980), Baker & Brown (1984)
Impression Swales (1990), Harper &Shatwell(2002), Akai et al(2014)
Who from Harper &shatwell (2002), petty &cacioppo (1983, 1984), H. Ericksson (2013)
Contact Wright (1981), Wright, Creighton and Threlfall (1982), S. C. Geonetta (2005)
Audience fit Atkinson et al.(2007), Liberman et al. (2002), Jonathan MamangkiangMantikayan& Media A. Ayu (2013)
Tone Brown & Yule (1983), Gibbs & Steen (1999), Tian et al. (2004) Relevance Kiirsch (2001), Just & Clark (1973), Zhong et al. (2007)
Subject Ausubel (1963), Hartly&davies (1976), Petersson et al.(2000) Action Novick& Morse (2000)
© Associated Asia Research Foundation (AARF)
A Monthly Double-Blind Peer Reviewed Refereed Open Access International e-Journal - Included in the International Serial Directories.
Page | 17 whole group came in to common consensus or in other words agreed upon the same numerical
[image:6.612.73.513.74.349.2]rating.
Figure 1. Consensus Decision Making Procedure
The Analytic Hierarchy Methodology
Experts in various areas have recognized AHP process as a very powerful method in bringing out
the best choices that are available from the lots.AHP process enables to compare either the
qualitative and quantitative data’s or findings to reach the desired objective.AHP methodology
uses verities of qualitative and mathematical process to infer the result from various data and
from this collected data a valid conclusion is drawn out.
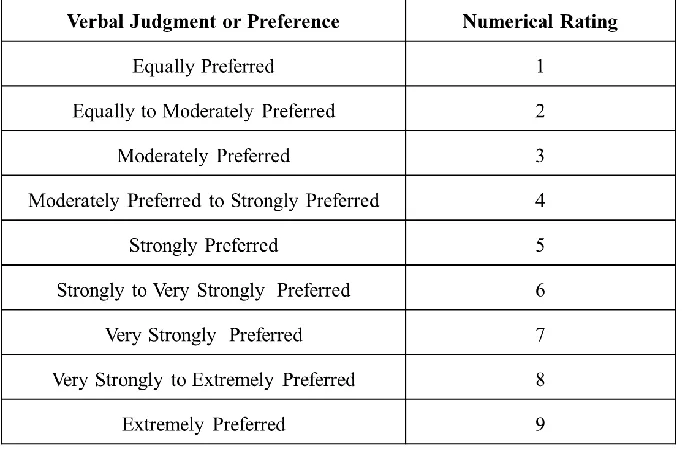
One to one comparisons are made to identify the one which is more preferred then the other. One
to one comparison is done to find the relative importance amongst the two variables that are
taken in to study and these factors is rated by the nine point scale. This rating was prepared and
developed by Saaty (Taylor, 2010). The scale has a rating from number 1 to 9 which reflects the
level of importance from equal, moderate, strong, very strong to extreme level by 1,3,5,7 and 9,
respectively.2, 4, 6, 8 denotes intermediate values between two adjacent comparison. This nine
© Associated Asia Research Foundation (AARF)
A Monthly Double-Blind Peer Reviewed Refereed Open Access International e-Journal - Included in the International Serial Directories.
Page | 18 variable is considered absolutely more important than the other then it is rated as 9. If the same
variable is considered absolutely less important than the other then it is rated as 1/9. This type of
one to one comparisons are carried out for all the factors that has been mentioned in this study
The goal of this research is to find out the most relevant and relative importance of the various
factors that are taken in general aspect of developing document procedures from the literature
reviews. To reach this particular goal, the mathematical steps that are provided by (Taylor, 2010)
was used and the steps used are carried out as below:
I. Prepare a one to one comparison matrix for each decision alternative (factors) under
each criterion
II. The normalization methodology is carried as below
a. Summing up the ratings of each column of the one to one comparison matrices.
b. Each ratings of every column of the one to one comparison matrices are divided by
the corresponding column sum. This has to be done for all the comparison matrices
that are prepared. The resulting values represent the normalized matrices.
c. The preference vectors is found by computing the average values of each row of the
normalized matrices
d. The vectors of preferences for each criterion (from step ii c) are combined into one
preference matrix which shows the preference for each alternative for each criterion.
III. Prepare a one to one comparison matrix for criteria.
IV. The normalized matrix is computed by dividing each value in each column of the matrix
by the corresponding column sum.
V. The preference vector is prepared by computing the row averages for the normalized
© Associated Asia Research Foundation (AARF)
A Monthly Double-Blind Peer Reviewed Refereed Open Access International e-Journal - Included in the International Serial Directories.
[image:8.612.101.522.64.490.2]Page | 19 Table 2. The AHP One to One Comparison Ratings between Two factors or Alternatives
Source: Taylor (2010)
Figure 2. Traditional AHP Model: Goal, Criteria and Alternatives or factors
Source: Saaty (2008)
After computing the preference matrix for both the alternatives as well as for the criteria’s these
preference vectors are nothing but the local weights of level 1 and level 2. By multiplying the
local weights of level 1 and level 2 we get what is called the global weights. These global
weights are calculated to assign the ranking and the sum of all the global weights should be equal
[image:8.612.137.478.67.292.2]© Associated Asia Research Foundation (AARF)
A Monthly Double-Blind Peer Reviewed Refereed Open Access International e-Journal - Included in the International Serial Directories.
Page | 20
Consistency check
The other part of the AHP process is to check for the consistency which measures how much or
with what our judgments are consistent even when it is tested amongst the large sample of
judgments. This study involves four main criteria they are language, relationship, content, design
criteria’s. These are four main criteria’s that form the level 1 in the AHP process. Under each of this criteria’s there are four alternatives, each of these forms the level 2 in the AHP process.
According to Saaty, the judgments are perfectly consistent when consistency ratio is 0 and there
is no need to repeat the process. If the consistency ratio is above 0.1 then the process must be
repeated, and the judgments are inconsistent, random and untrustworthy.
The consistency reliability is given by the formula (CR) =CI/RI, wherein CI is the consistency
index of the judgments and RI is the index of the same corresponding random matrix used for
comparison. RI is provided by the table 3 and table 4. In both the tables, (n) is the order of the
random matrix and corresponding values are the index of consistency for random judgments
[image:9.612.182.433.472.558.2](R.I).
Table 3. RI = 3 to 9
Source: Alonso and lamata (2006)
Table 4.RI values for different values of n= 10 to 16
Source: Alonso and lamata (2006)
Consistency index is (CI) = [λavg-n]/[n-1]. Now consider the equation [Ax=λavg x], where A
refers to the preference matrix and x refers to the eigenvector. The formula for λavg can be got by
rearranging the equation for Ax as mentioned before, so λavg=average │AX/X│
n 3 4 5 6 7 8 9
R.I 0.52 0.88 1.10 1.24 1.34 1.40 1.44
n 10 11 12 13 14 15 16
© Associated Asia Research Foundation (AARF)
A Monthly Double-Blind Peer Reviewed Refereed Open Access International e-Journal - Included in the International Serial Directories.
Page | 21
ANALYSIS USING AHP METHODOLOGY:
The analysis and discussion aspect of AHP process is presented in this section.
[image:10.612.131.481.227.294.2]Table5. Pair-Wise Comparison Matrix with respect to Criteria
Table 6. Pair-Wise Comparison Matrix of Alternatives in Design Criteria
[image:10.612.139.476.457.526.2]Table 7. Pair-Wise Comparison Matrix of Alternatives in Relationship Criteria
[image:10.612.116.501.577.643.2]Table 8. Pair-Wise Comparison Matrix of Alternatives in Content Criteria
Table 9. Pair-Wise Comparison Matrix of Alternatives in Language Criteria FACTORS LANGUAGE DESIGN RELATIONSHIP CONTENT
LANGUAGE 1 0.5 0.33 0.2
DESIGN 2 1 0.5 0.17
RELATIONSHIP 3 2 1 0.25
CONTENT 5 6 4 1
FACTORS GRAPHIC LEGIBILITY IMPRESSION STRUCTURE
GRAPHIC 1 3 2 2
LEGIBILITY 0.33 1 2 2
IMPRESSION 0.5 0.5 1 0.5
STRUCTURE 0.5 0.5 2 1
FACTORS WHO FROM AUDIENCE FIT TONE CONTACT
WHO FROM 1 0.5 6 0.25
AUDIENCE FIT 2 1 5 0.33
TONE 0.17 0.2 1 0.14
CONTACT 4 3 7 1
FACTORS RELEVANCE SUBJECT ALIGNMENT ACTIONS
RELEVANCE 1 3 2 2
SUBJECT 0.33 1 0.33 0.5
ALIGNMENT 0.5 3 1 0.5
ACTIONS 0.5 2 2 1
FACTORS DIRECTNESS PLAIN WORDS READABILITY GRAMMER
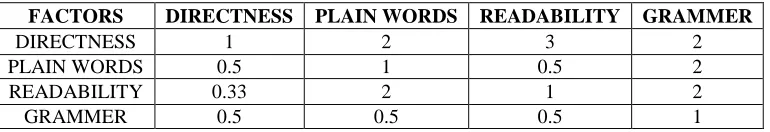
DIRECTNESS 1 2 3 2
PLAIN WORDS 0.5 1 0.5 2
READABILITY 0.33 2 1 2
© Associated Asia Research Foundation (AARF)
A Monthly Double-Blind Peer Reviewed Refereed Open Access International e-Journal - Included in the International Serial Directories.
[image:11.612.68.548.59.174.2]Page | 22 Table 10. Normalized Score Tables for Criteria (Level 1)
FACTORS LANGUAG E DESIG N RELATIONSHI P CONTEN T ROW TOTA L LOCAL WEIGHT S WEIGHT S IN %
LANGUAGE 0.09 0.05 0.05 0.12 0.32 0.08 8
DESIGN 0.19 0.10 0.09 0.10 0.47 0.12 12
RELATIONSH
IP 0.27 0.21 0.17 0.15 0.81 0.20 20
CONTENT 0.45 0.63 0.69 0.63 2.40 0.60 60
[image:11.612.67.546.214.345.2]TOTAL 1 1 1 1 4 1 100
Table 11. Normalized Score Tables for Alternatives of Design Criteria (Level 2)
FACTORS GRAPHI C LEGIBILIT Y IMPRESSIO N STRUCTUR E ROW TOTA L LOCAL WEIGHT S WEIGHT S IN %
GRAPHIC 0.43 0.6 0.29 0.36 1.68 0.42 42
LEGIBILIT
Y 0.14 0.2 0.29 0.36 1.00 0.25 25
IMPRESSIO
N 0.22 0.1 0.14 0.10 0.54 0.14 14
STRUCTUR
E 0.21 0.1 0.28 0.18 0.78 0.19 19
TOTAL 1 1 1 1 4 1 100
Table 12. Normalized Score Tables for Alternatives of Relationship Criteria (Level 2)
Table 13. Normalized Score Tables for Alternatives of Content Criteria (Level 2)
FACTORS RELEVANC E SUBJEC T ALIGNMEN T ACTION S ROW TOTA L LOCAL WEIGHT S WEIGHT S IN %
RELEVANC
E 0.43 0.33 0.37 0.5 1.64 0.40 40
SUBJECT 0.14 0.11 0.06 0.12 0.44 0.11 11
ALIGNMEN
T 0.21 0.33 0.19 0.13 0.86 0.22 22
ACTIONS 0.21 0.22 0.38 0.25 1.06 0.27 27
TOTAL 1 1 1 1 4 1 100
FACTORS WHO FROM
AUDIENCE
FIT TONE CONTACT
ROW TOTAL LOCAL WEIGHTS WEIGHTS IN %
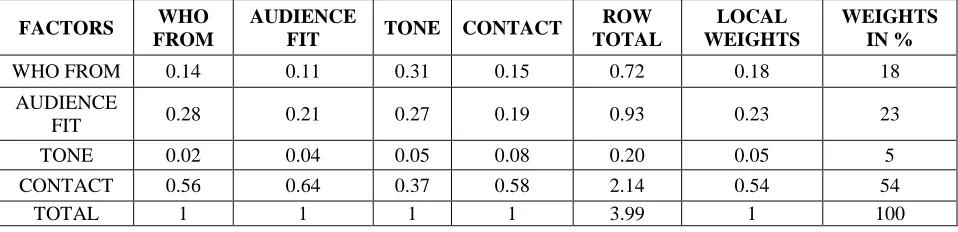
WHO FROM 0.14 0.11 0.31 0.15 0.72 0.18 18
AUDIENCE
FIT 0.28 0.21 0.27 0.19 0.93 0.23 23
TONE 0.02 0.04 0.05 0.08 0.20 0.05 5
CONTACT 0.56 0.64 0.37 0.58 2.14 0.54 54
[image:11.612.67.546.387.503.2] [image:11.612.67.547.539.671.2]© Associated Asia Research Foundation (AARF)
A Monthly Double-Blind Peer Reviewed Refereed Open Access International e-Journal - Included in the International Serial Directories.
[image:12.612.64.551.252.374.2]Page | 23 Table 14. Matrix for language criteria
Table 15. Consistency Reliability for language criteria
The AVG is the average of Matrix Prod/ Local Weight that is
AVG=(4.36+4.11+4.24+4.15)/6= 4.21
Consistency index, (CI) = (AVG-n)/(n-1) = (4.21416-4)/(4-1) = 0.07
Consistency Reliability, (CR) = CI/RI=0.07133/1.59= 0.079255556
In the similar manner the consistency index and consistency reliability is calculated for all the
other factors or alternatives belonging to the other three criteria’s and also for the four criteria’s
that are considered as per the table 15. The calculation revealed that the consistency for the
design, relationship and content and criteria are .051, 0.079, 0.071, and 0.0793 respectively
whose values were less than 0.1. Hence consistent. A (Matrix) * LOCAL WEIGHTS (X) = AX (Matrix Product)
λmax=AX/X
(Matrix product/ Local weights) FACTO RS DIREC TNESS PLAIN WORDS READA BILITY GRA MME R DIRECT
NESS 1 2 3 2 0.42 1.83 4.36
PLAIN
WORDS 0.5 1 0.5 2 0.20 0.80 4.11
READA
BILITY 0.33 2 1 2 0.25 1.05 4.24
GRAM
MER 0.5 0.5 0.5 1 0.14 0.57 4.15
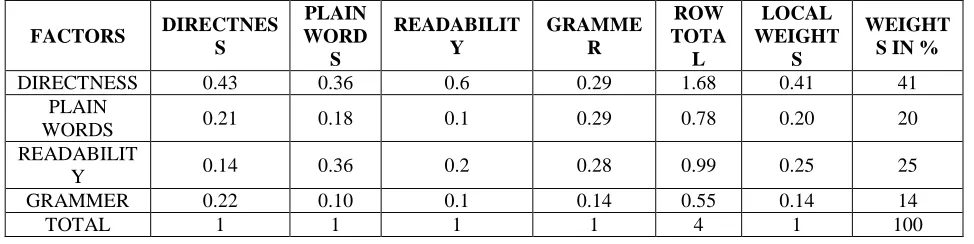
FACTORS DIRECTNES S PLAIN WORD S READABILIT Y GRAMME R ROW TOTA L LOCAL WEIGHT S WEIGHT S IN %
DIRECTNESS 0.43 0.36 0.6 0.29 1.68 0.41 41
PLAIN
WORDS 0.21 0.18 0.1 0.29 0.78 0.20 20
READABILIT
Y 0.14 0.36 0.2 0.28 0.99 0.25 25
GRAMMER 0.22 0.10 0.1 0.14 0.55 0.14 14
© Associated Asia Research Foundation (AARF)
A Monthly Double-Blind Peer Reviewed Refereed Open Access International e-Journal - Included in the International Serial Directories.
Page | 24 The table 15 depicts the data’s required to calculate the Consistency Reliability for language
criteria. A refers to the matrix of the Language criteria. The local weights of language criteria are
taken from the table 15. AX is the matrix product which is got by multiplying A (matrix) with
the local weights (x) for language criteria. The λmaxis calculated by dividing AX with local
weights. The AVG, consistency index and consistency reliability is calculated as mentioned
above. In the same way, the consistency reliability is calculated for criteria’s, and the alternatives
or factors of design criteria, relationship criteria and content criteria in the same way as done for
language criteria. After calculating, consistency index and reliability the next task is to calculate
global weights. The global weights are calculated by multiplying the local weights of Level 1
and level 2. The same procedure is continued till all the global weights of the alternatives are
[image:13.612.71.524.316.556.2]calculated.
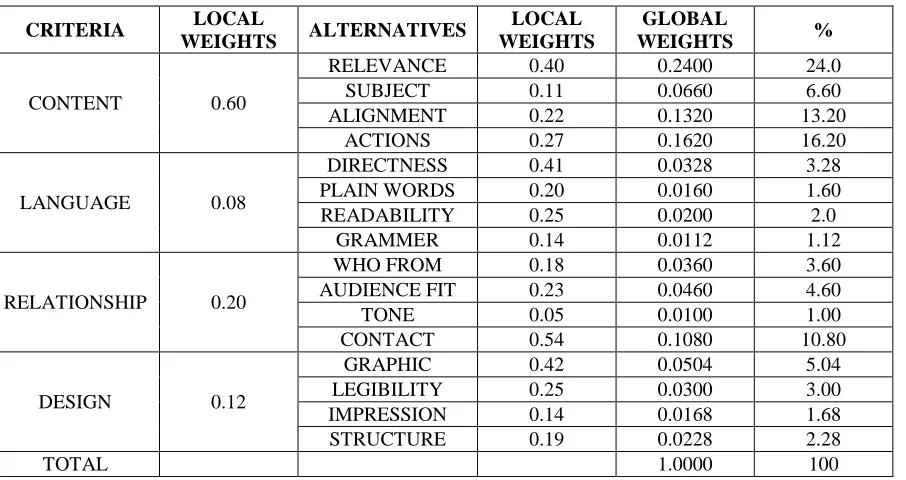
Table 16. Global weights and the local weights of criteria’s
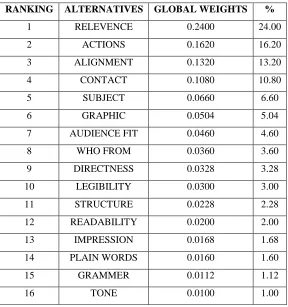
Table 16 shows the global weights and the local weights of criteria’s (level 1) and alternatives
(level 2). Table 17 shows the ranking of the alternatives that is used in developing the guide.
Based on the ranking, those alternatives that have the highest ranking is made use in developing
the self-learning guide to a largest extent. CRITERIA LOCAL
WEIGHTS ALTERNATIVES
LOCAL WEIGHTS
GLOBAL
WEIGHTS %
CONTENT 0.60
RELEVANCE 0.40 0.2400 24.0
SUBJECT 0.11 0.0660 6.60
ALIGNMENT 0.22 0.1320 13.20
ACTIONS 0.27 0.1620 16.20
LANGUAGE 0.08
DIRECTNESS 0.41 0.0328 3.28
PLAIN WORDS 0.20 0.0160 1.60
READABILITY 0.25 0.0200 2.0
GRAMMER 0.14 0.0112 1.12
RELATIONSHIP 0.20
WHO FROM 0.18 0.0360 3.60
AUDIENCE FIT 0.23 0.0460 4.60
TONE 0.05 0.0100 1.00
CONTACT 0.54 0.1080 10.80
DESIGN 0.12
GRAPHIC 0.42 0.0504 5.04
LEGIBILITY 0.25 0.0300 3.00
IMPRESSION 0.14 0.0168 1.68
STRUCTURE 0.19 0.0228 2.28
© Associated Asia Research Foundation (AARF)
A Monthly Double-Blind Peer Reviewed Refereed Open Access International e-Journal - Included in the International Serial Directories.
Page | 25 The figure 2 shows the graphical representation of the global weights of all the alternatives in
terms of percentage. From the figure, it is seen that the relevance has the highest percentage then
the rest of the factors in terms of global weights. It is ranked as number 1 in the ranking of the
factors amongst the other factors which directly tells us that the relevance factor is preferred the
[image:14.612.163.451.157.464.2]most amongst the rest of the sixteen factors. The tone alternative is the least preferred.
Table 17. Ranking of Alternatives
RANKING ALTERNATIVES GLOBAL WEIGHTS %
1 RELEVENCE 0.2400 24.00
2 ACTIONS 0.1620 16.20
3 ALIGNMENT 0.1320 13.20
4 CONTACT 0.1080 10.80
5 SUBJECT 0.0660 6.60
6 GRAPHIC 0.0504 5.04
7 AUDIENCE FIT 0.0460 4.60
8 WHO FROM 0.0360 3.60
9 DIRECTNESS 0.0328 3.28
10 LEGIBILITY 0.0300 3.00
11 STRUCTURE 0.0228 2.28
12 READABILITY 0.0200 2.00
13 IMPRESSION 0.0168 1.68
14 PLAIN WORDS 0.0160 1.60
15 GRAMMER 0.0112 1.12
© Associated Asia Research Foundation (AARF)
A Monthly Double-Blind Peer Reviewed Refereed Open Access International e-Journal - Included in the International Serial Directories.
[image:15.612.111.502.55.301.2]Page | 26 Figure 3. Graph showing alternatives and its global weight’s in percentage (%)
FINDINGS AND INTERPRETATIONS
The AHP approach is used to rank the alternatives so that it enables to choose the factors which
are used in developing the self-learning guide. This study is used to find the four important
criteria’s. They are language, content, relationship and design. The AHP analysis has revealed that content criteria was relatively important then rest of the criteria’s such as Language,
Relationship and Design. The relevance factor with global weight of 24.471 was found to be
highly relevant and relatively important factor followed by action, alignment, contact and subject
with 15.569, 12.858, 10.856, and 6.569 respectively. The alternatives that are considered to be
least relatively important ones are the once like tone, impression, plain words etc. This meant to
depict that the technical publication team which is going to use this self-learning guide needs a
technical document which gives important to its content such that there is relevant information
provided in the self-learning guide, clear and hassle free information while communicating the
work process, clarity in action that is to be taken by the personal while carrying out the processes
and the guide is to be developed in such a way that it depicts the organization’s intended aims
and values.
0 5 10 15 20 25 30
RELEVANCE SUBJECT ALIGNMENT ACTIONS DIRECTNESS PLAIN WORDS READABILITY GRAMMER WHO FROM AUDIENCE FIT TONE CONTACT GRAPHIC LEGIBILITY IMPRESSION STRUCTURE
Percentage
A
lte
rm
ativ
e
s
© Associated Asia Research Foundation (AARF)
A Monthly Double-Blind Peer Reviewed Refereed Open Access International e-Journal - Included in the International Serial Directories.
Page | 27
CONCLUSIONS
In this study an effort is made to identify the different factors that can be helpful in developing
the self-learning guide using literature review as the main means of identifying the factors in
order to facilitate smooth flow of information while carrying out the process in the technical
publication department. There were sixteen factors grouped in to four criteria’s were identify.
The factors are relevance, actions, alignment, contact, subject, graphic, audience fit, who from,
directness, legibility, structure, readability, impression, plain words, grammar and tone falling
under four criteria’s language, content, design and relationship.The prioritizing of these factors is
done by the Analytical hierarchy process. The Analytical hierarchy process revealed that
relevance factor was given the high priority than the rest of the factors. The relevance factor was
followed by action, alignment, contact, subject as the immediate next high priority factors. The
least priority factors are tone and impression.
From the present study it is seen that developing a technical document such as self-learning
guide is qualitative in nature. The analytical hierarchy process is used for data analysis, but there
are so many other processes that could be employed such as multi criteria decision making
analysis to conduct the data analysis.
A self-learning guide is developed to meet the organizations requirements when the process are
dynamic in nature, but the use of the self-learning guide is simply overlooked as the importance
of having a self-learning guide are neglected as it is thought to be time consuming to develop.
But in fact, the self-learning guide acts as an information centre by providing the accurate
information when it is required the most. Not many studies have been conducted on the topics
such as documents in the technical publication and the effect of using such documents such as
self-learning guide. More studies can be conducted using the other factors to validate the effect
© Associated Asia Research Foundation (AARF)
A Monthly Double-Blind Peer Reviewed Refereed Open Access International e-Journal - Included in the International Serial Directories.
Page | 28
REFERENCES
1. Anastasi, T.E (1971) “How to manage your writing”, The Maqua Company,
Schenectady, NY.
2. Blake, G. and Bly, R.B. (1993) “The elements of technical writing”, Macmillan
Publishing Company, New York
3. Ausubel, D. (1963), Psychology of Meaningful Verbal Learning. Orlando, Florida:
Grunne & Stratton.
4. Just, M., & Clark, H.H., (1973), Drawing inferences from the presuppositions and
implications of affirmative and negative sentences. Memory & Cognition, 4, 318-322.
5. Wright, P. (1981), “The instruction clearly states… can’t people read? Applied
Ergonomics, 12, 131-142.
6. Wright.P, Creighton, p. and Threlfall S.M.(1982), “Some factors determining when
instructions will be read. Ergonomics”, 25, 225-237.
7. Harker, P.T.,& L. G. Vargas. (1987), “The Theory of Ratio Scale Estimation: Saaty’s
Analytic Hierarchy Process”, Journal of Management Sciences, 33(11), 1383-1403.
8. Fiske R H (1996), “Disctionary of concise writing, writer’s digest books”, Cincinnati,
OH.
9. Gibaldi J (1999), “MLA Handbook for writers of research papers, The modern language
association of America”, New York.
10.Cabrerizo, F., Alonso, S., & Herrera-Viedma, E. (2009). A consensus model for group
decision making problems with unbalanced fuzzy linguistic information. International
Journal of Information Technology & Decision Making, 8(1), 109–131.
11.Eddie W.L. Cheng, Heng Li, (2001) “Analytic Hierarchy Process: An Approach to
Determine Measures for Business Performance, 5(3), 30-37.
12.Paivio, A. (2006). Dual Coding Theory and Education. Pathways to Literacy
Achievement for High Poverty Children, pp 1–20.
13.Atkinson, A., S. McKay, et al. (2007), “Level of financial capability in the UK public
money and management”, 27, 29-36.
14.Ruchi Garg Zillur Rahman M.N., Quareshi Ishwar Kumar, (2012). “Identifying and
Ranking Critical Success Factors of Customer Experiences in Banks”, Journal of
© Associated Asia Research Foundation (AARF)
A Monthly Double-Blind Peer Reviewed Refereed Open Access International e-Journal - Included in the International Serial Directories.
Page | 29 15.Saaty, T. L. (1990). How to Make a Decision: The Analytic Hierarchy Process. European
Journal of Operational Research, 24, 9-16.
16.Sakuja S, Jain V (2012), “Service supply chain: An integrated conceptual framework,
CIE42 Proceedings, 16-18.
17.Rabihah Md.Sum and Norlida Mahussin (2016), “Deciding on alternatives to meet the
need for a bigger house: personal financial decision making using Analytical Hierarchy