A STUDY OF EMOTIONAL INTELLIGENCE OF ENGINEERING
COLLEGE TEACHERS
S. Neelima,
Research Scholar, Krishna University, Machilipatnam.
ABSTRACT
Emotional intelligence (EI) has become an employee selection variable in recent times. It is viewed as a predictor of success in job performance and leadership ability. Though there are varied definitions of EI, there is a common ground which can be used to develop an
operational concept and measurement tool. A good number of studies have come up trying to establish the linkage between EI and psychological problems of employees at work like – stress, greediness, jealousies, etc. as well as job performance variables like productivity and success. This paper focuses on relationship between emotional intelligence and stress which impact job performance.
Key words: Emotional intelligence, stress, job performance
INTRODUCTION
Colleges are places of higher learning. In the era of advanced technology, life has become
both easy and difficult, so also learning process and systems. The goal of education is to
enable people, develop personality – physical, psychological and functional- to lead quality
life and contribute to society. In a society individual and social health has a special place.
People should be able to do their jobs with least stress or have the ability to control emotions
and tensions arising from work.
The modern world which is said to be the world of achievement is also a world of stress. One
can find stress everywhere, within in family, workplaces, and social groups. Right from the
time of birth till the last breath down, an individual is exposed to various stressful situations.
The present society is passing through an „Age of anxiety, conflict and stress. Studies have
other indicators of emotional arousal. (Kierstead, 1999, Cherniss, 2000, Poon Teng Fatt,
2002).
CONCEPT OF EI
While there are many definitions on EI, the following ones present the concept operationally.
EI is a regulator of emotions. It helps present and hide emotions, without harming health of
an individual.
Emotional Intelligence is "the competence to identify and express emotions, understand
emotions, assimilate emotions into thought, and regulate both positive and negative emotions
in the self and others" (Matthews, Zeidner & Roberts, 2002).
Emotional intelligence can be measured. To measure, the concept, one needs an
understanding of its components or dimensions. The following definition throws light on the
dimensions.
According to Goleman (1995), emotional intelligence consists of five components:
1. Knowing our emotions (self-awareness), 2. Managing them,
3. Motivating ourselves,
4. Recognizing emotions in others (empathy), and 5. Handling relationships.
IMPORTANCE OF EI
Abraham (2000) deliberated that the social skills component of Emotional Intelligence is
related to positive interpersonal relationships and it increases the feeling of job satisfaction
and decreases occupational stress. He further stated that these social skills foster networks of
social relationships which in turn increase faculty‟s commitment to the organization.
In their conceptual paper, Spector and Goh (2001) examined the role of emotion in
occupational stress. They employed a narrow definition of job stress as “any condition or
situation that elicits a negative emotional response, such as anger / frustration or anxiety /
control their emotions (particularly negative emotions) in the workplace will influence the
outcome of stress.
Slaski and Cartwright (2002) investigated the relationship between measures of emotional
quotient, subjective stress, distress, general health, and morale, quality of working life and
management performance of a group of retail managers. Significant correlations in the
expected direction were found, indicating that managers who scored higher in emotional
quotient suffered less subjective stress, experienced better health and well-being, and
demonstrated better management performance.
Goleman has asserted that Emotional Intelligence (EQ) can be as powerful, and sometimes
more powerful, than IQ (Goleman, 1995, p.34). Ediger (1997) proclaimed that the emotions,
feelings, and values are essential for a person‟s well being and achievement in life. Success
depends on several intelligences including emotional intelligence. IQ is not the only measure
of success; there are other measures like emotional intelligence, social intelligence, and luck
that play a vital role in a person's success (Goleman, 1995).
It is a common conviction that, when emotions are interlinked with role, performance, or
both, they tend to interfere with task achievement (Ashforth & Humphrey, 1995). Kahn
(1990) put forward that personal engagement,or emotional involvement in tasks, reflects the
highest level of motivation and leads to high performance.
Ghosh (2003) reported that those children with high EI are more confident, positive & happy,
have high self esteem and few behavioral problems, handle their emotions better and are
better learners.
Several studies as given above thus argued that there exists a relation between EI and stress.
OBJECTIVES AND METHODOLOGY
The present study seeks to measure the emotional intelligence of teachers in an engineering
college. As majority sample size is teaching staff, and they not only teach but spent long
hours in the laboratories. This may lead to anxiety, frustration and high stress and sometimes
agitation with little concern for human relationships. Communication is hampered, reducing
can prevent eruption of such situations by helping them to be in touch with their own
emotions and empathy for others.
The Researcher wants to know about teachers‟ emotional intelligence in-order to test whether
there is emotional stability or not. As few studies took place in emotional intelligence there is
a lot of instability in the emotional balance so the researcher wants to test whether the same
will be prevailing in this study.
Survey method was used for data collection. The population for the study comprised 250
teachers of the chosen engineering college. A Simple random sampling technique was
adopted and the response rate was 54% on the day of the data collection, for many teachers
were sent on duty on university work and some of them were on leave on their personal
causes. Therefore on 135 teachers the questionnaire was administered. After the thorough
scrutiny the 35 respondents responses were not adequate and hence screened out. Therefore
the sample size is 100 respondents and the analysis of the data was taken care of for the 100
respondents‟ responses.
Questionnaire
21 questions related to emotional stability of the teachers and 22 questions to know the
occupational stress index in performing respondents‟ role (role ambiguity). This
questionnaire was adopted from the study of Anju Puri (2010), Emotional Intelligence of
executives in the Indian corporate sector. The reliability and validity of the emotional
intelligence scale was 0.88 and 0.93 and occupational stress index was 0.93 and 0.9
respectively.
The first section dealt with demographic details of the teachers and the second section with
emotional intelligence items. A five point scale of agreement with scale points represent
Strongly Agree (SA), Agree (A), Neutral (N), Disagree (DA), and Strongly Disagree (SD)
was used. The respondents were asked to express emotional intelligence on the five point
scale. The collected data was described using Factor analysis for factor identification.
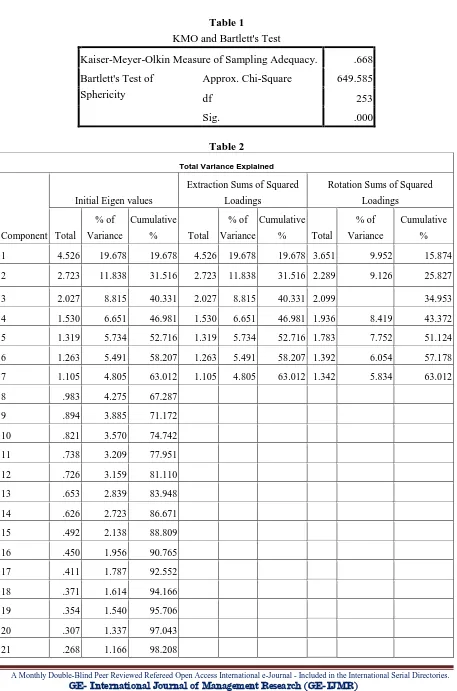
Table 1
KMO and Bartlett's Test
Kaiser-Meyer-Olkin Measure of Sampling Adequacy. .668
Bartlett's Test of Sphericity
Approx. Chi-Square 649.585
df 253
Sig. .000
Table 2
Total Variance Explained
Component
Initial Eigen values
Extraction Sums of Squared
Loadings
Rotation Sums of Squared
Loadings
Total
% of
Variance
Cumulative
% Total
% of
Variance
Cumulative
% Total
% of
Variance
Cumulative
%
1 4.526 19.678 19.678 4.526 19.678 19.678 3.651 9.952 15.874
2 2.723 11.838 31.516 2.723 11.838 31.516 2.289 9.126 25.827
3 2.027 8.815 40.331 2.027 8.815 40.331 2.099 34.953
4 1.530 6.651 46.981 1.530 6.651 46.981 1.936 8.419 43.372
5 1.319 5.734 52.716 1.319 5.734 52.716 1.783 7.752 51.124
6 1.263 5.491 58.207 1.263 5.491 58.207 1.392 6.054 57.178
7 1.105 4.805 63.012 1.105 4.805 63.012 1.342 5.834 63.012
8 .983 4.275 67.287
9 .894 3.885 71.172
10 .821 3.570 74.742
11 .738 3.209 77.951
12 .726 3.159 81.110
13 .653 2.839 83.948
14 .626 2.723 86.671
15 .492 2.138 88.809
16 .450 1.956 90.765
17 .411 1.787 92.552
18 .371 1.614 94.166
19 .354 1.540 95.706
20 .307 1.337 97.043
22 .231 1.004 99.213
23 .181 .787 100.000
[image:6.595.69.528.156.758.2]Extraction Method: Principal Component Analysis.
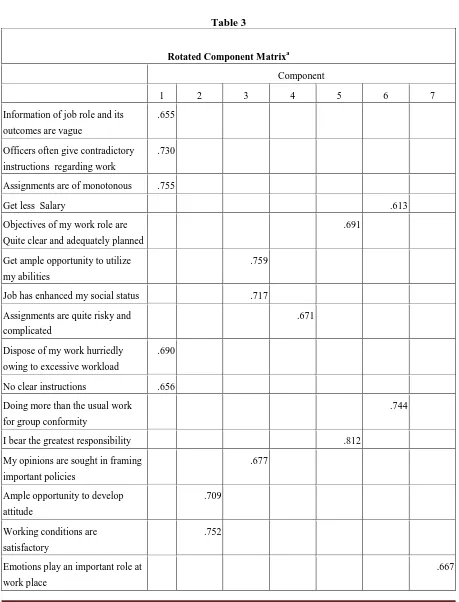
Table 3
Rotated Component Matrixa
Component
1 2 3 4 5 6 7
Information of job role and its
outcomes are vague
.655
Officers often give contradictory
instructions regarding work
.730
Assignments are of monotonous .755
Get less Salary .613
Objectives of my work role are
Quite clear and adequately planned
.691
Get ample opportunity to utilize
my abilities
.759
Job has enhanced my social status .717
Assignments are quite risky and
complicated
.671
Dispose of my work hurriedly
owing to excessive workload
.690
No clear instructions .656
Doing more than the usual work
for group conformity
.744
I bear the greatest responsibility .812
My opinions are sought in framing
important policies
.677
Ample opportunity to develop
attitude
.709
Working conditions are
satisfactory
.752
Emotions play an important role at
work place
Extraction Method: Principal Component Analysis.
Rotation Method: Varimax with Kaiser Normalization.
a. Rotation converged in 10 iterations.
The results indicate that a Factor Analysis can be applied to the set of given data as the value
of KMO Statistics is greater than 0.5 & the Bartlett‟s test of Sphericity is significant. There
are seven factors resulting from the analysis explaining a total of 63.012% of the variations in
the entire data set. The percent of variation explained by the seven factors are 19.678%,
11.838%, 8.815%, 6.651%, 5.734%, 5.491%, 4.805% respectively after vari-max rotation is
performed. We will use the rotated component matrix using 0.63 as a cut-off point for factor
loading for naming the factors. According to the present study these factors are extracted and
explained below:
Factor1: Organizational Decision Making
The available information relating to my job-role and its outcomes are vague and insufficient
My different officers often give contradictory instructions regarding my work
Sometimes it becomes complicated problem for me to make adjustment between formal rules and instructions.
I have to dispose of my work hurriedly owing to excessive workload.
I am not provided with clear instructions and sufficient facilities regarding the new assignments trusted to me.
Factor 2:Organizational Culture
I get ample opportunity to develop my attitude and proficiency properly
Working conditions are satisfactory here from the point of view of our welfare and convenience
Factor 3: Employee Engagement
I get ample opportunity to utilize my abilities and experience independently.
This job has enhanced my social status.
My opinions are sought in framing important policies of the organization or department.
Some of my assignments are quite risky and complicated.
Factor 5: Self-Esteem
The objectives of my work-role are quite clear and adequately planned.
I bear the great responsibility for the progress and prosperity of this organization.
Factor 6: Compensation
I get less salary in comparison to the quantum of my work.
I have to dispose of my work hurriedly owing to excessive workload.
Factor 6: Emotional Stability
Emotions play an important role at work place
From the above components, Factor (F1): Organizational Decision Making has more significant impact on emotional intelligence of faculty under total variance with a proportion
of 19.678.
Factor (F2): Organizational Culture is also important which is identified as second most important component of emotional balance of faculty with a total variance with a proportion
of 11.838.
Factor (F3): Faculty Engagement is even more important which is identified as third most important component under total variance with a proportion of 8.815.
Factor (F4): Risk is the next important factor under total variance with a proportion of 6.651.
Factor (F5): Risk is the next important factor under total variance with a proportion of 5.734.
Factor (F6): Compensation is the next important factor under total variance with a proportion of 5.491.
The screen plot is another way of identifying the number of useful factors. We look for a
sharp break in sizes of twenty three values which result in a change in the slope of the plot
from steep to shallow. From, the screen plot, we clearly identify which is the component
which is of highly significant.
FINDINGS, CONCLUSION & SUGGESTIONS
The present research study explored that Among 7 factors Factor 1: Organizational Decision
Making is influencing the Emotional Intelligence of teachers.
Emotional intelligence is considered to be a pre-requisite to lead a happy and successful life.
Institution need to give priority to teachers in organizational matters so that sense of
belongingness occurs.
The relationship between the two variables i. emotional intelligence and ii. Stress may also
depend on whether it is professional education or non-professional education and technical or
managerial education.
The future research studies can further investigate this that may provide useful dimension and
enrich the research.
References
2. Aziz, Mohsin (2004). “Role Stress among Women in the Indian Information Technology Sector”, Women in Management Review, Vol 19 (7), pp 356-363.
Ashforth, B. E., & Humphrey, R. H. (1995). Emotions in the workplace: A reappraisal. Human Relations, 48, 97–125.
3. Dasgupta, Hirak, and Kumar, Suresh (2009).“Role Stress among Doctors Working in a Government Hospital in Shimla (India)”, European Journal of Social Sciences, Vol 9 (3).
4. Ediger, M. (1997). Affective objectives in the science curriculum. (Clearinghouse No. SE060514)_Montgomery, AL: Auburn University at Montgomery, School of Education. (ERIC Document Reproduction Service No. ED412070).
5. Goleman, D. (1995). Emotional intelligence: why it can matter more than IQ. New York: Bantam Books.
6. Kahn,W. A. (1990). Psychological conditions of personal engagement and disengagement at work. Academy of Management Journal, 33, 692–724.
7. Kierstead J. 1999. Human Resource Management Trends and Issues. Emotional Intelligence in The work place. Research directorate-PSC.
8. Lawrence, G. (1998). Emotional intelligence: Does it develop differently in thinking types and feeling types? In Proceedings of the Conference: Counter attack; Rising to the challenges to education: The role of psychological type. Orlando, March 5-8. 9. Low, G.R. (2000). Quantifying Emotional Intelligence: Positive contributions of the
Emotional Mind, A paper presented for the spring 2000faculty lecture at Texas A & M University, Kingsville.
10.Mathurs, M., Dube, S. and Malhotra, B. (2003) Emotional Intelligence: Interrelationships of attribution, taking responsibility and scholastic performance in adolescents. Indian Psychological Review, 60,4,175-180.
11.Matthews, G., Zeidner, M. & Roberts, R (2002). Emotional intelligence: Science and myth. London,the MIT Press.
12.Nelson, D.B., & Low, G.R., (2003). Emotional Intelligence: Achieving academic and Career Success. Upper saddle River, N.J.Prentice Hall.
13.Parker, J.D. (2004).Emotional intelligence and academic success: Examining the transition from high school to university. Personality and individual differences, 36, 163-217.
14.Petrides, K.V., Frederick son, N. and Furnham, A. (2004). The role of trait emotional intelligence in academic performance and deviant behavior at school. Personality and individual Differences, 36, 2, 277-293(Psy.abs.2004, 91,4, 1559).
15.Slaski, M., & Cartwright, S. (2002). Health, Performance and Emotional Intelligence: An Exploratory Study of Retail Managers, Stress and Health, 18,63-68.